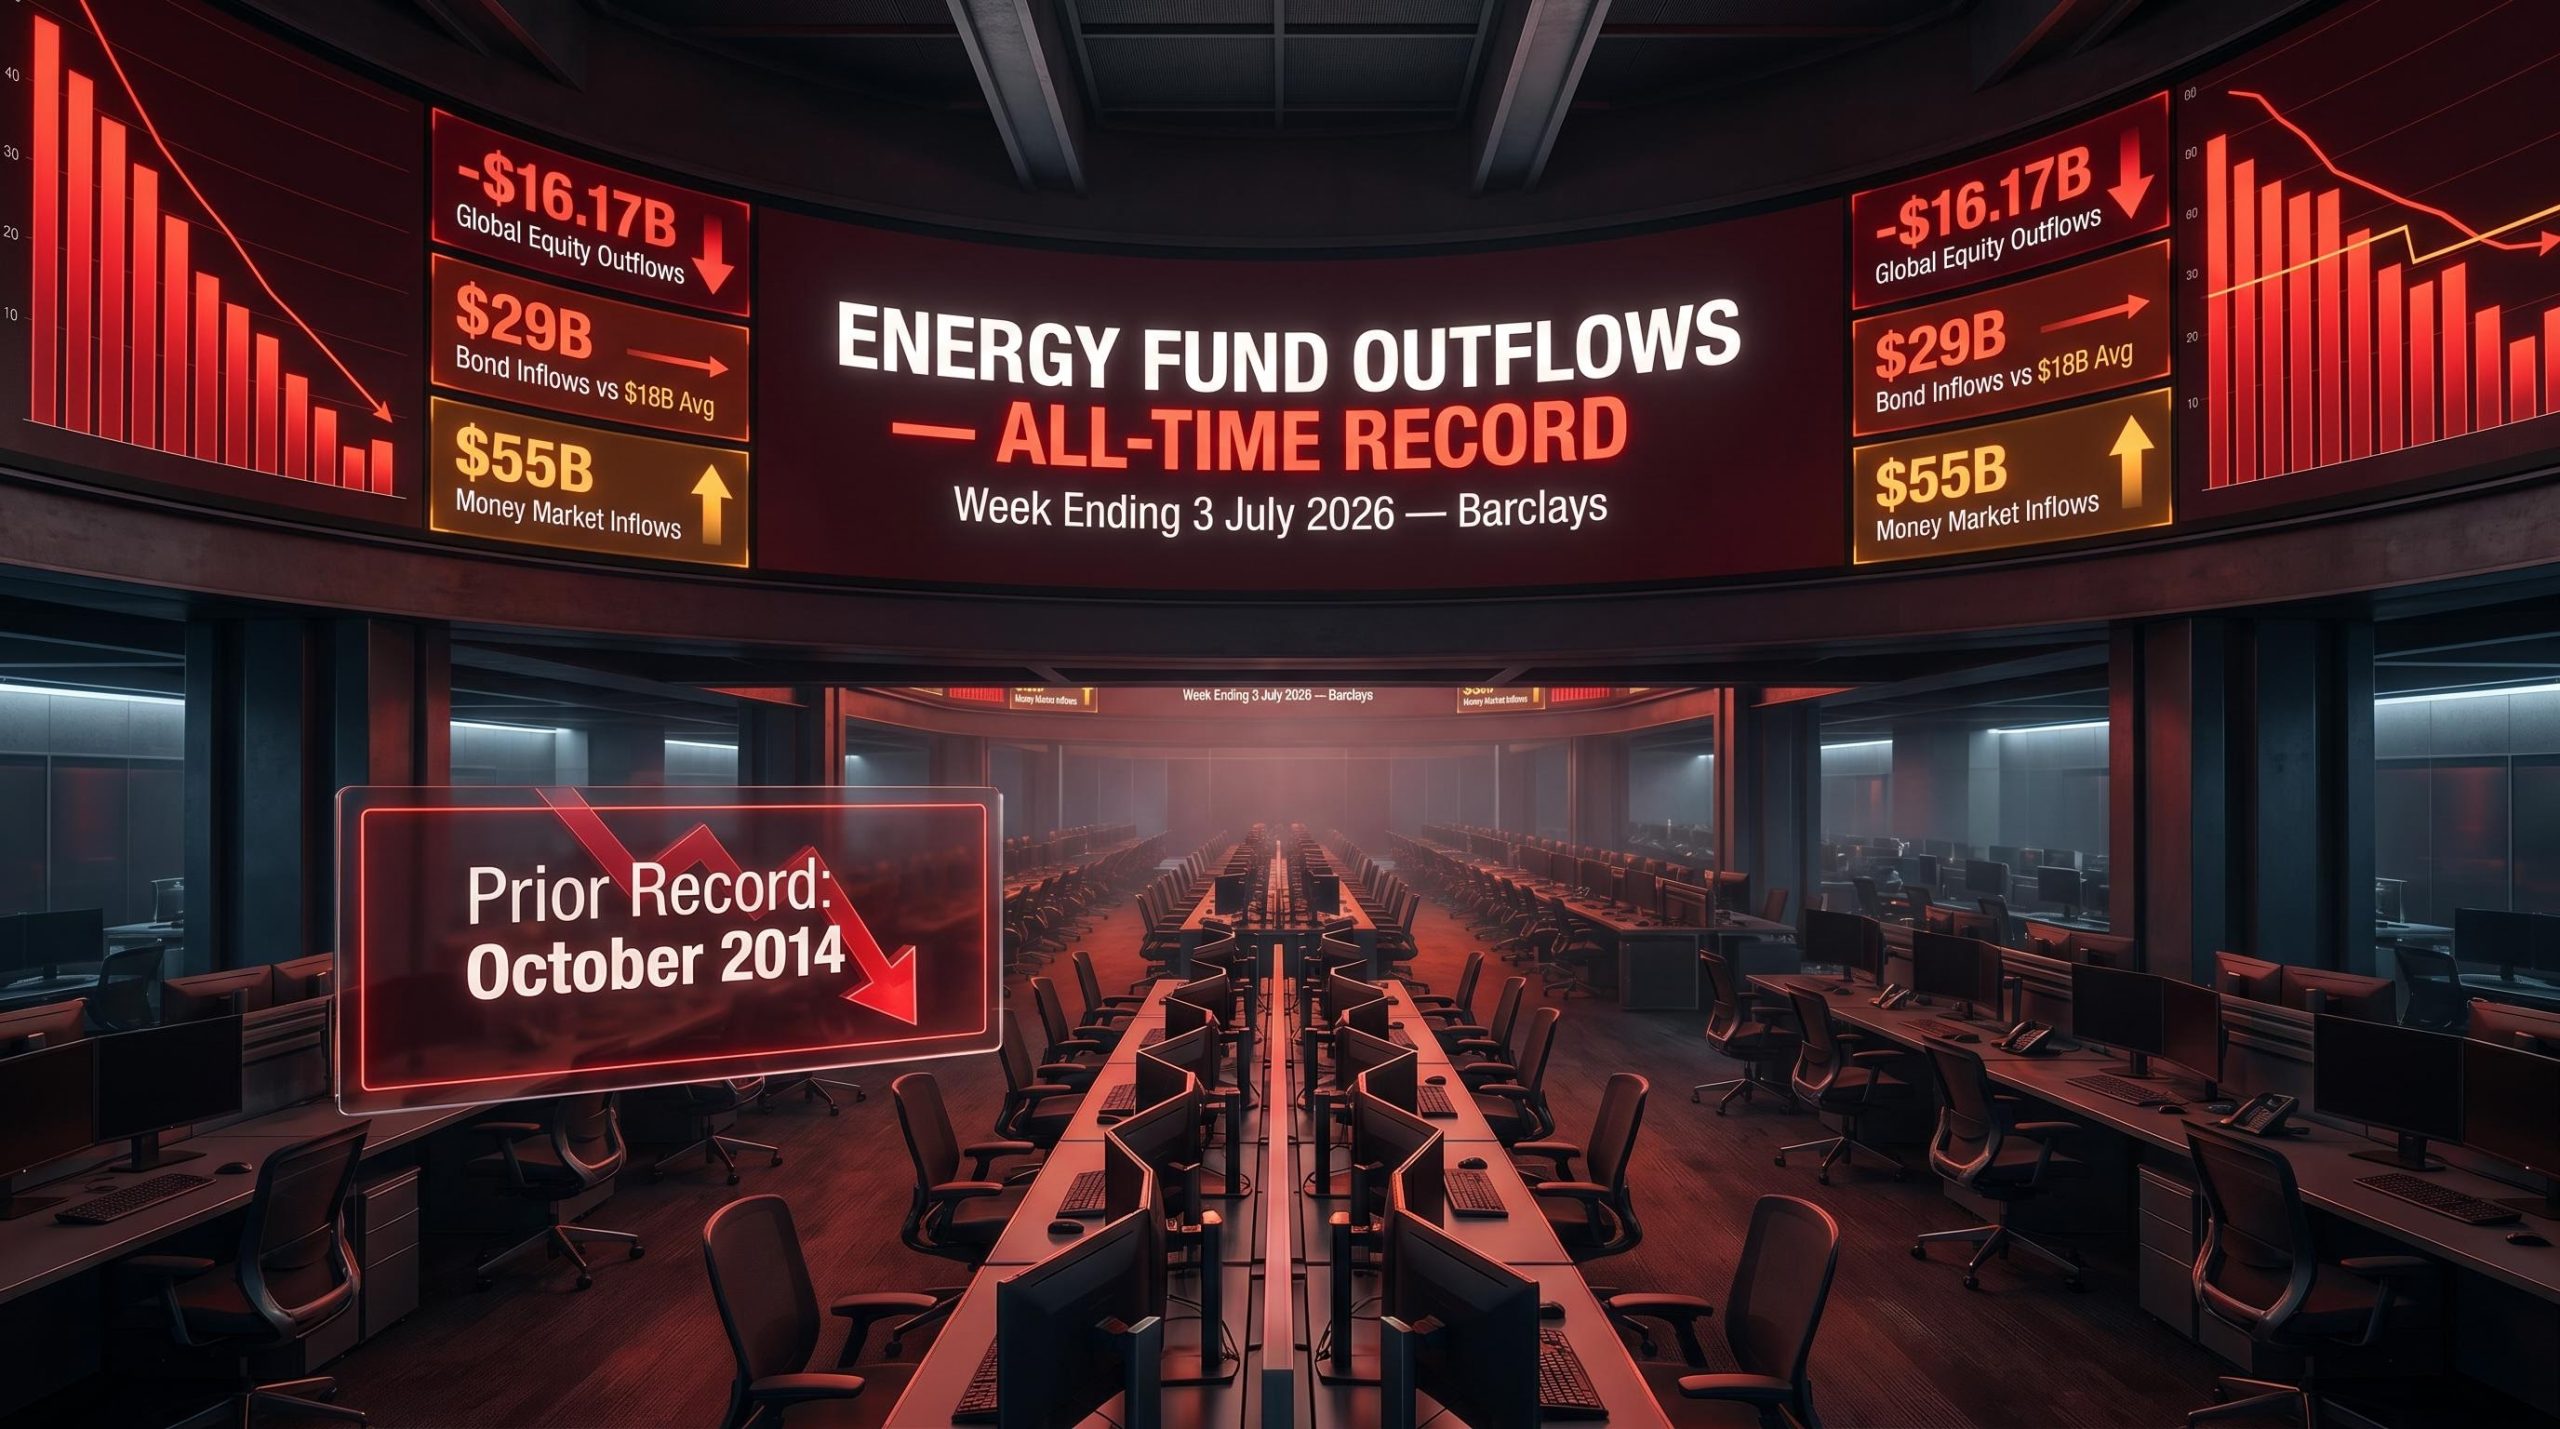
Energy Funds Post Record Outflows as Global Equities Bleed Capital
12 mins ago

Brent crude closed at $106.30 per barrel on 12 May 2026, roughly 52% above the pre-conflict baseline of approximately $70 per barrel. That single figure compresses an enormous chain reaction into one number: a closed shipping lane, a global supply deficit measured in millions of barrels per day, and an inflation impulse now working its way through every freight invoice, grocery receipt, and Federal Reserve projection in the United States.
The effective closure of the Strait of Hormuz since the U.S.-Israel military campaign against Iran began in late February 2026 has removed 12-13 million barrels per day from global seaborne oil flows. UN Security Council talks collapsed on 28 April. President Trump publicly dismissed Iran’s counter-proposal on 11 May, signalling no imminent resolution. April 2026 headline CPI is projected to print at 3.7% year-over-year when released today, up from 3.3% in March, and the Federal Reserve is watching for evidence that energy costs are bleeding into core categories.
What follows traces the full chain from the Hormuz chokepoint through oil markets, into U.S. inflation data, and out to Federal Reserve policy expectations, drawing on EIA, Goldman Sachs, JPMorgan, and CME FedWatch data to identify where the transmission is strong, where it is being absorbed, and what comes next.
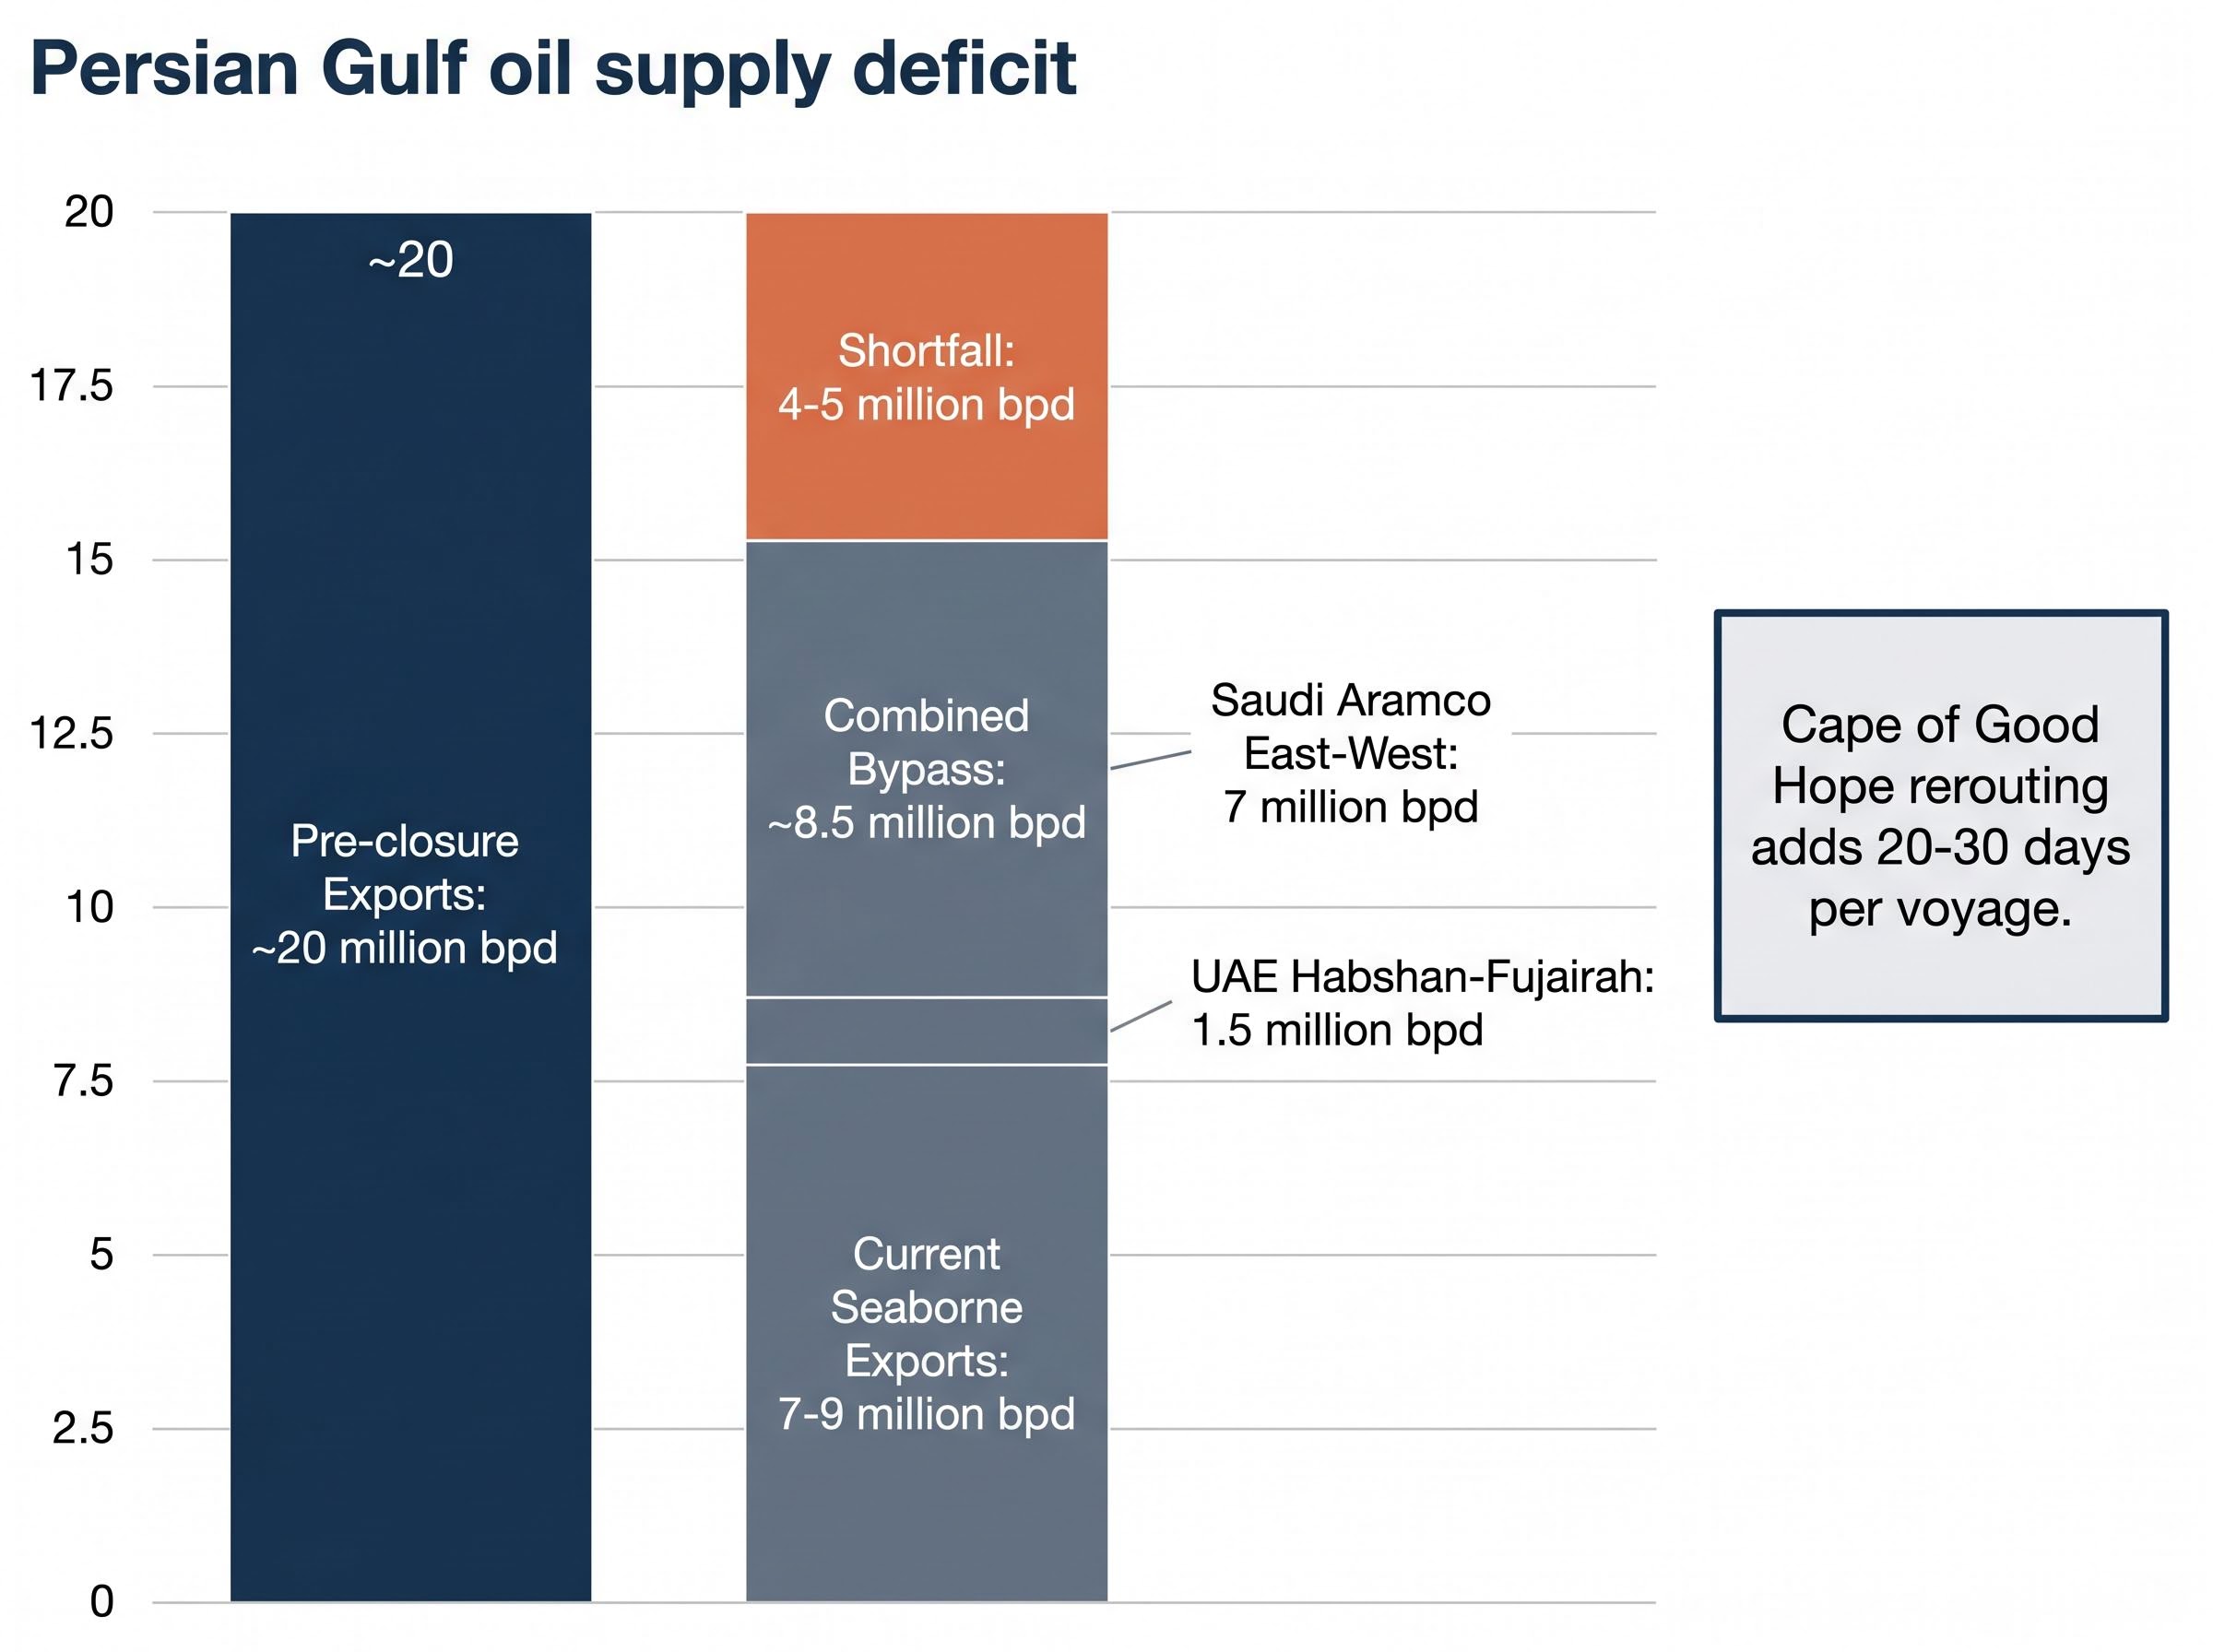
Under normal conditions, roughly one-fifth of global oil supply transits the Strait of Hormuz. The current closure has removed an estimated 12-13 million barrels per day from seaborne flows, cutting Persian Gulf exports from approximately 20 million bpd pre-closure to an estimated 7-9 million bpd.
Bypass pipelines narrow the gap but cannot close it. Saudi Aramco’s East-West Pipeline has been restored to its full capacity of 7 million bpd, while the UAE’s Habshan-Fujairah pipeline remains constrained at 1.5 million bpd following attack damage. Combined bypass capacity sits at approximately 8.5 million bpd, still 4-5 million bpd short of the seaborne volume removed.
| Flow Category | Volume (million bpd) |
|---|---|
| Normal Persian Gulf seaborne exports | ~20 |
| Current Persian Gulf seaborne exports | 7-9 |
| Combined pipeline bypass capacity | ~8.5 |
The alternative route around the Cape of Good Hope is a cost multiplier, not a solution. The consequences are threefold:
That structural deficit is the foundation for every downstream inflation and policy effect that follows.
The physical closure is itself only one layer of the disruption: the Hormuz triple lock combining U.S. naval blockade operations, Iranian toll enforcement on non-U.S. and non-Israeli vessels, and the near-total withdrawal of commercial war risk insurance means that even a partial diplomatic thaw would not immediately restore commercial tanker traffic to pre-conflict volumes.
Before the conflict, Brent traded near $70 per barrel. By the close on 11 May 2026, it sat at approximately $103.45. On 12 May, the price rose roughly 2% to $106.30, extending a rally that has now delivered an approximately 52% premium over the pre-conflict baseline.
Three major forecasters have staked out structurally distinct positions on where prices head from here, and the assumptions behind each differ materially.
| Institution | Q2 2026 View | Q4 2026 Base Case | Key Risk Scenario |
|---|---|---|---|
| Goldman Sachs | Elevated, near current levels | Recovery toward $90/bbl | Earlier upside of $115-$125 if no mitigation |
| JPMorgan | Low-$100s sustained | Low-$100s | $150/bbl if no diplomatic resolution |
| EIA | Peak near $115/bbl | Declining to ~$88/bbl | Demand destruction provides relief |
Goldman’s relative optimism rests on partial rerouting, Strategic Petroleum Reserve (SPR) releases, and demand destruction pulling prices lower by year-end. The EIA converges on a similar trajectory, projecting a peak near $115 in Q2 before supply adjustments take hold. JPMorgan’s base case is more stubborn, keeping Brent in the low-$100s for most of the year.
JPMorgan’s tail-risk scenario of $150 per barrel is contingent on a prolonged diplomatic stalemate and no meaningful resolution. That figure is not a forecast; it is a stress test, and the gap between it and Goldman’s $90 Q4 target implies two very different inflation and rate paths for the U.S. economy.
Two supply-side buffers deserve attention. U.S. domestic production reached 13.2 million bpd in April 2026, up approximately 8% year-over-year, with the Permian Basin driving the response. The U.S. SPR, drawn down by approximately 180 million barrels, holds roughly 350 million barrels in reserve, with further releases planned.
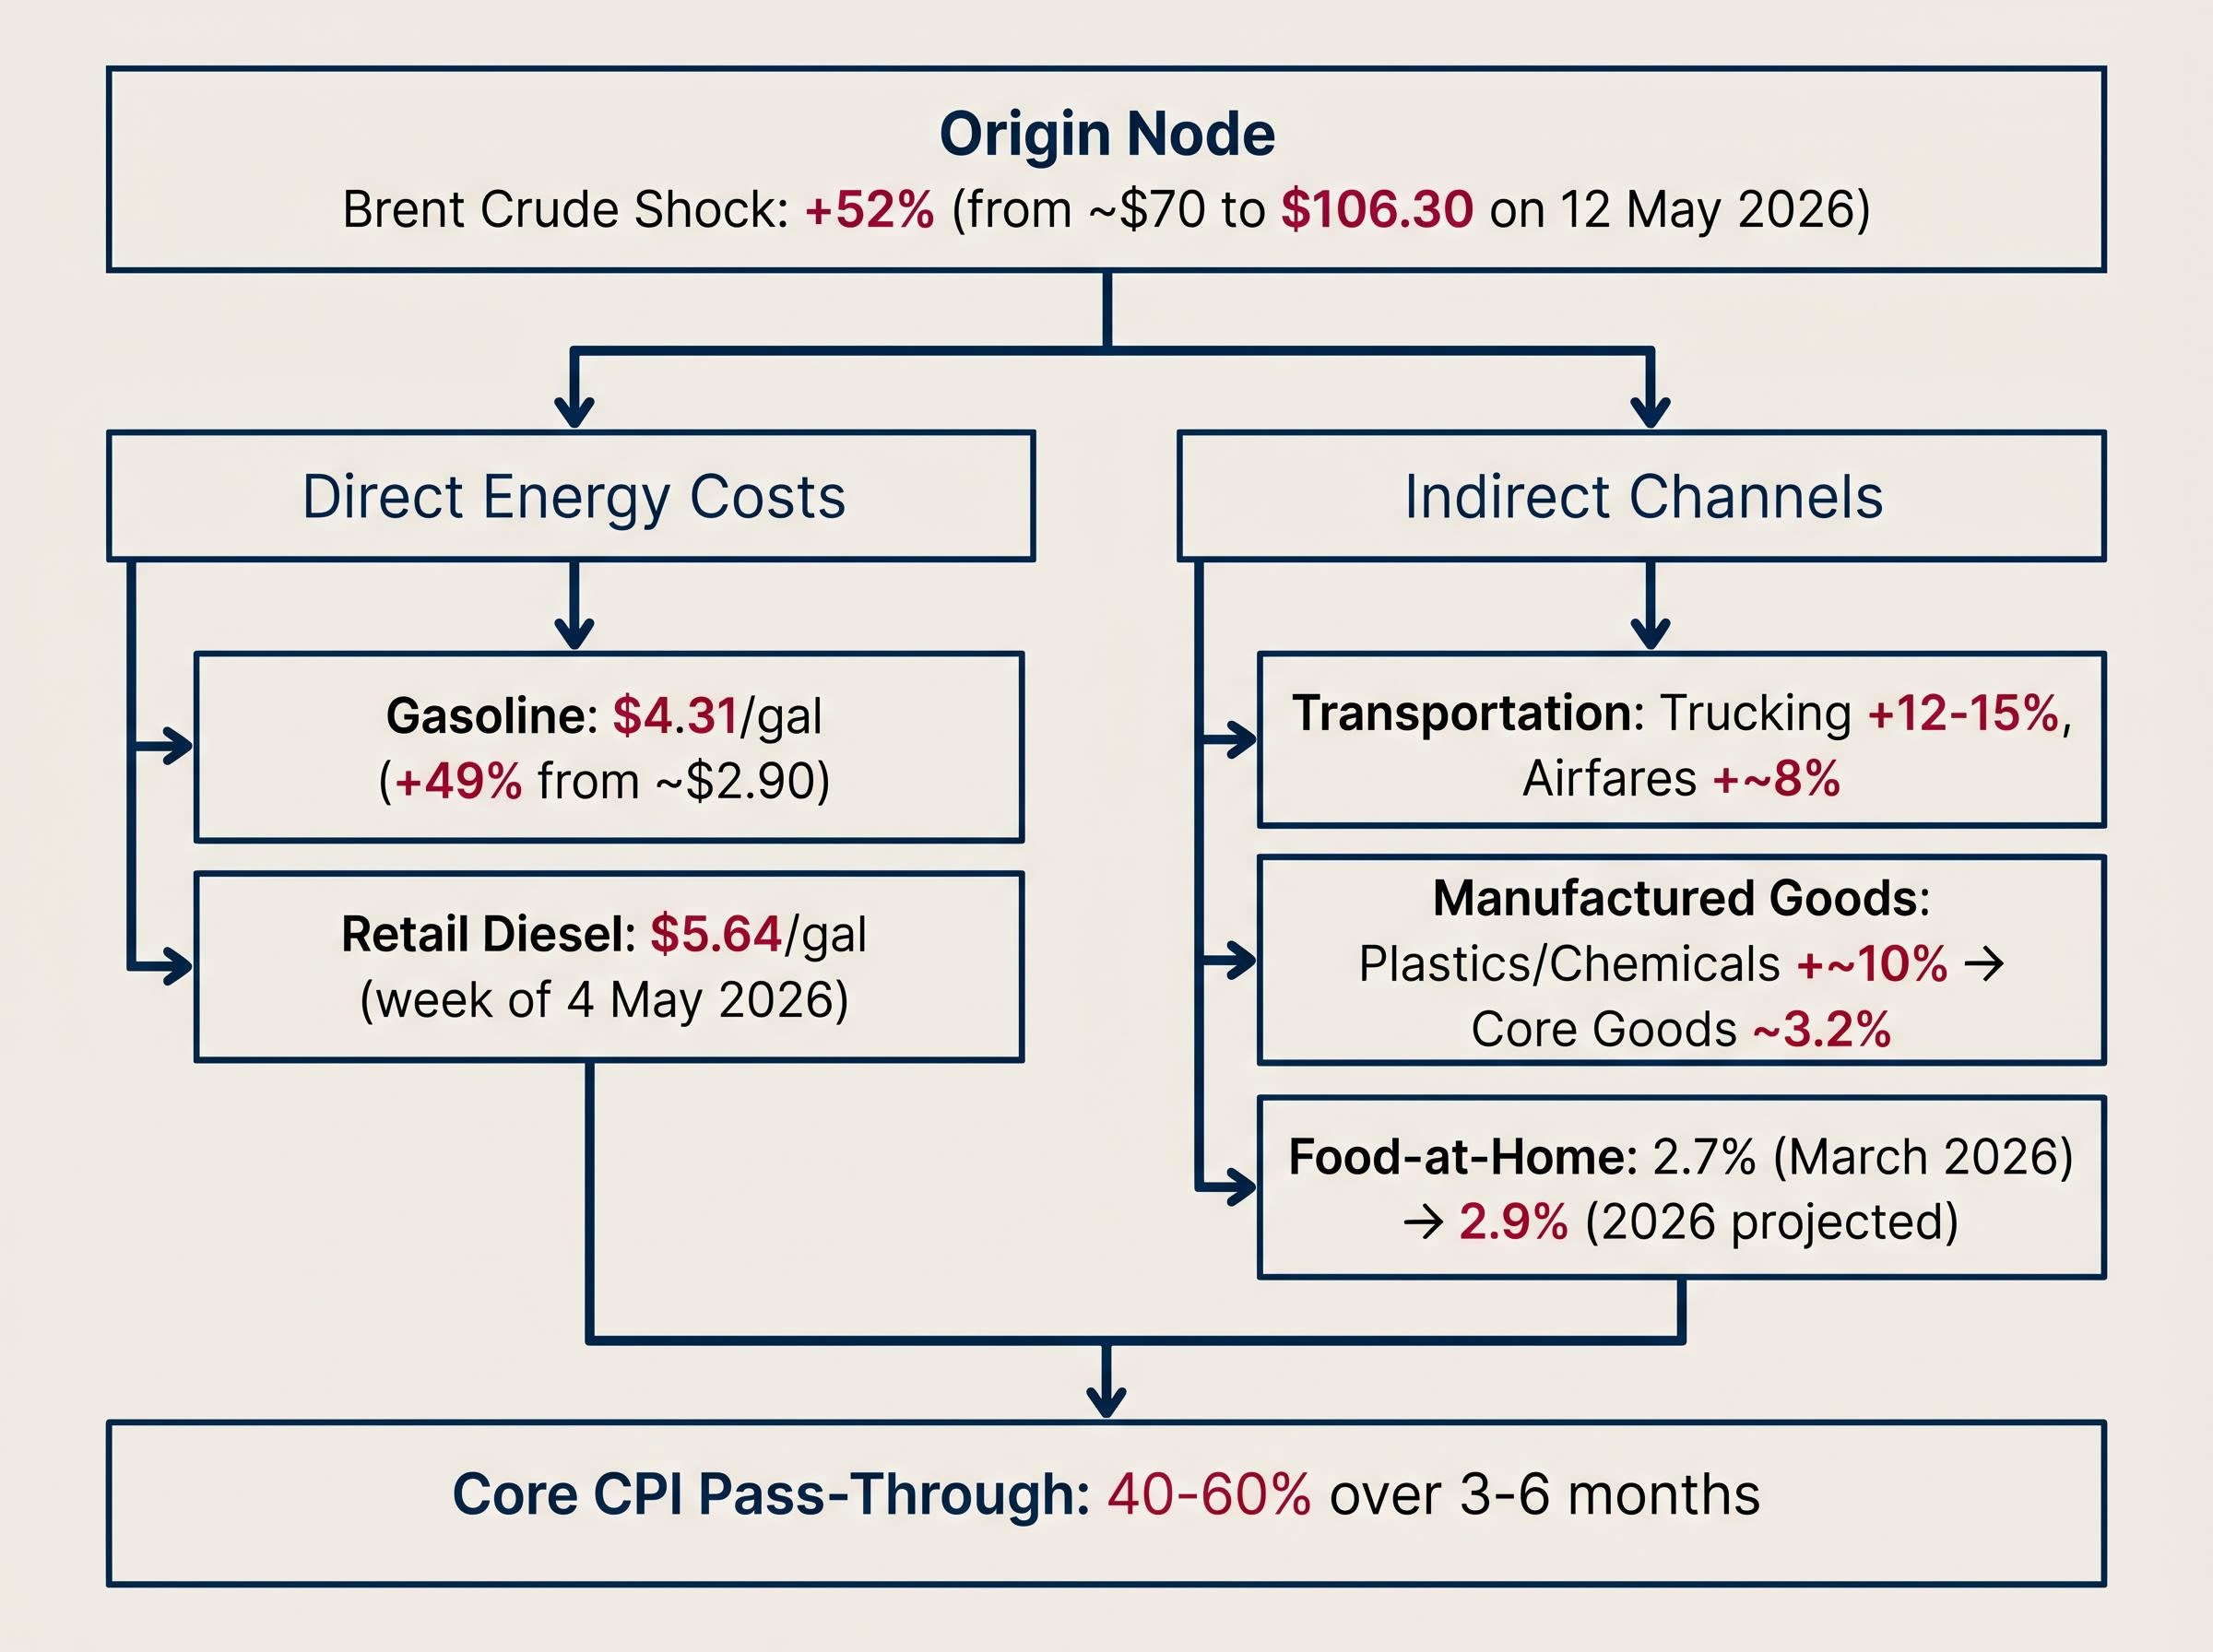
A 52% increase in crude prices does not stay in the oil market. It moves through the economy along distinct channels, each operating on its own timeline. Understanding those channels is what separates a headline reaction from a durable inflation assessment.
Analyst consensus estimates that 40-60% of an oil price increase passes through to core CPI (which excludes food and energy) over a 3-6 month window. That partial pass-through means headline inflation moves first and hardest, but core categories absorb the pressure with a lag.
The most immediate channel is fuel. U.S. average gasoline prices have risen to approximately $4.31 per gallon as of May 2026, up roughly 49% from the pre-conflict average of approximately $2.90. Retail diesel reached $5.64 per gallon as of the week of 4 May 2026.
Those diesel prices cascade directly into freight costs. Trucking expenses are up 12-15%, and the Federal Reserve’s April 2026 Beige Book noted widespread freight surcharges across reporting districts. Airfares have risen approximately 8% as jet fuel costs feed into core services.
Jet fuel supply constraints represent one of the more acute second-order effects of the Hormuz closure, with tanker loadings collapsing approximately 50% week on week in early May 2026 and ConocoPhillips warning that import-dependent nations could face critical inventory shortfalls as early as June, a timeline that would add additional upward pressure to airfare costs already running 8% above pre-conflict levels.
Food price transmission is more moderate but persistent. USDA Economic Research Service data shows food-at-home inflation running at 2.7% year-over-year as of March 2026, with a projected increase of 2.9% for 2026 as higher feed, transport, and energy costs work through supply chains into meat, dairy, and produce.
The USDA ERS Food Price Outlook tracks price changes across grocery categories including meat, dairy, and produce, and its methodology accounts for the compounding effect of transport and energy cost increases on retail food prices, which is precisely the mechanism driving the current forecast toward 2.9% food-at-home inflation for 2026.
Petrochemical feedstock shortages have pushed plastics and chemicals prices up approximately 10%, feeding into packaging, detergents, and manufactured goods. Core goods inflation is running at approximately 3.2% under current conditions. Goldman Sachs has flagged the risk of “sticky” core goods inflation if Brent remains above $100 on a sustained basis.
By the time the April 2026 headline CPI figure of 3.7% reaches the public today, each of these channels has already been active for weeks. The number should not be surprising.
The projected April 2026 headline CPI of 3.7% year-over-year, with a 0.6% month-over-month increase, confirms the first stage of the oil-to-inflation transmission is real. That reading follows a March 2026 headline of 3.3% year-over-year, which itself reflected a 0.9% monthly jump driven heavily by gasoline.
The more consequential figure sits underneath. April 2026 core CPI is forecast at 2.7% year-over-year (0.3% month-over-month), up from 2.6% in March. The upside risk, according to several analyst estimates, could push that reading toward 2.9% if energy spillovers into services and goods prove persistent.
| CPI Measure | March 2026 | April 2026 (Forecast) |
|---|---|---|
| Headline CPI (year-over-year) | 3.3% | 3.7% |
| Headline CPI (month-over-month) | 0.9% | 0.6% |
| Core CPI (year-over-year) | 2.6% | 2.7% |
| Core CPI (month-over-month) | 0.2% | 0.3% |
ING strategists have noted that core CPI is the most consequential reading for Federal Reserve policy, and that it is likely premature to see clear secondary effects in the April data. The 40-60% pass-through from oil to core operates over 3-6 months, meaning the true test arrives in the June and July prints, when freight surcharges, petrochemical cost increases, and food supply chain pressures have had time to fully embed.
The gap between headline and core is where the forward-looking policy debate lives. What core is not yet capturing is precisely what the Fed will be watching most closely over the next two months.
The federal funds target range sits at 3.50-3.75% as of May 2026. CME FedWatch data prices approximately 92.8% probability of no change at the June 2026 meeting, with roughly 7% probability of a hike. Markets are not pricing imminent tightening. They are pricing an extended pause.
The distinction matters. The Fed entered 2026 on an easing trajectory, with markets expecting approximately 100 basis points of cuts through the year. That expectation has been halved. Barclays and JPMorgan have both revised their 2026 rate-cut forecasts to approximately 50 basis points total, contingent on the Strait eventually reopening.
Fed Chair Powell stated on 2 May 2026: “Energy shocks are testing core inflation anchors, with transportation and housing utilities showing early persistence.” He added that “policy remains data-dependent, but upside risks could delay easing.”
May 2026 regional Fed surveys have noted “stagflation concerns” prompting a pause in easing plans. The bind is genuine: cutting rates while headline inflation accelerates toward 4% risks unanchoring inflation expectations, while holding rates at current levels for too long risks tipping rate-sensitive sectors into contraction.
Three scenarios define the path forward:
For U.S. borrowers and investors, the difference between 50 basis points of cuts and zero cuts this year is material. It affects mortgage rates, corporate borrowing costs, and equity valuations across rate-sensitive sectors.
For investors wanting to understand the institutional dynamics shaping that policy bind in depth, our dedicated guide to the FOMC’s internal fracture covers the 8-4 dissent split, the implications of Kevin Warsh’s imminent succession, and why five consecutive years of above-target inflation raise the risk that elevated price expectations become structurally entrenched regardless of whether the Hormuz supply shock resolves.
The Hormuz crisis is not the first oil supply shock to test U.S. inflation resilience, and comparing it to prior episodes calibrates both the severity and the structural advantages in play.
| Crisis | Peak Price Change | GDP Impact | Core CPI Pass-Through | Key Mitigating Factor |
|---|---|---|---|---|
| 1973 Arab Oil Embargo | ~300% | ~-2.6% | Severe | None (low domestic production) |
| 2022 Russia-Ukraine | Brent peaked ~$130/bbl | Moderate slowdown | ~40% | SPR releases, demand destruction |
| 2026 Hormuz Crisis | ~45-50% | ~-0.5% | 40-60% (estimated) | U.S. production at 13.2M bpd |
The comparison is genuinely reassuring on one dimension: GDP impact. The estimated -0.5% drag in 2026 is a fraction of the 2.6% contraction in 1973, and the reason is structural. U.S. domestic production at 13.2 million bpd, driven by the shale revolution, means the economy is a net exporter and can partially self-insulate in ways that were impossible half a century ago.
The inflation pass-through, however, tracks closer to the 2022 episode. An estimated 40-60% transmission to core CPI is consistent with what occurred after Russia’s invasion of Ukraine, when Brent peaked near $130 per barrel. The U.S. economy absorbed that shock without recession, but core inflation proved stubborn for over a year.
What distinguishes the current episode is not the baseline disruption but the escalation risk. Goldman Sachs has flagged the possibility that conflict could extend to LNG infrastructure, a scenario that would widen the supply shock beyond oil and into European and Asian energy markets simultaneously. That condition, not the current supply deficit, is what would change the historical comparison entirely.
Two divergent paths sit ahead, and the signals that distinguish them are identifiable now.
The moderation scenario depends on a specific sequence: partial Strait reopening allowing some tanker traffic to resume, continued SPR releases capping domestic gasoline prices, and a demand-destruction effect through Q3 2026 that pulls consumption lower and takes pressure off headline inflation. Goldman Sachs’ $90 per barrel Q4 target is built on this sequence taking hold. Key indicators to watch:
Saudi Aramco CEO Amin Nasser has warned that 2027 supply normalisation is the more realistic timeline for a return to pre-crisis conditions, a projection that sits in sharp contrast to the Goldman Sachs $90 per barrel Q4 2026 target and has material implications for how long core CPI remains elevated above the Fed’s 2% anchor.
The escalation path runs through diplomatic failure and military resumption. President Trump’s 11 May dismissal of Iran’s counter-proposal narrowed the negotiating window. Reports indicate resumed large-scale U.S. military operations remain under consideration. JPMorgan’s $150 per barrel tail risk is contingent on exactly this scenario, compounded by any targeting of LNG infrastructure that would widen the energy shock beyond oil. Warning signals include:
The China variable may be the most consequential near-term uncertainty. Beijing, as Iran’s largest petroleum buyer, holds unusual leverage as a potential guarantor of any ceasefire framework. An upcoming Xi meeting has been described as a potential diplomatic circuit-breaker. Its outcome, alongside the June 2026 CPI print and whether the Fed’s language at the July FOMC meeting shifts from “data-dependent pause” toward explicit hike consideration, will define the next phase of this cycle.
This article is for informational purposes only and should not be considered financial advice. Investors should conduct their own research and consult with financial professionals before making investment decisions. Financial projections referenced are subject to market conditions and various risk factors. Forward-looking statements from analysts and institutions are speculative and subject to change based on geopolitical developments and market performance.
Oil price inflation refers to the broader rise in consumer prices triggered by higher crude oil costs, which feed through into gasoline, diesel, freight, food, and manufactured goods. When Brent crude rises sharply, as it has by roughly 52% since the Hormuz closure began, households face higher fuel bills, grocery prices, and airfares within weeks to months.
The closure has removed an estimated 12-13 million barrels per day from global seaborne oil flows, pushing Brent crude to $106.30 per barrel and lifting U.S. gasoline prices to around $4.31 per gallon. Analysts estimate that 40-60% of an oil price increase passes through to core CPI over a 3-6 month window, meaning the full inflation impact is still working its way through freight, food, and goods prices.
CME FedWatch data shows approximately 92.8% probability of no change at the June 2026 FOMC meeting, with markets pricing an extended pause rather than imminent rate hikes. Both Barclays and JPMorgan have cut their 2026 rate-cut forecasts to around 50 basis points, down from an earlier expectation of roughly 100 basis points, contingent on the Strait eventually reopening.
Headline CPI includes food and energy prices directly, so it moves fastest when oil prices spike, with April 2026 headline CPI projected at 3.7% year-over-year. Core CPI strips out food and energy and reflects the slower secondary pass-through into services and goods, with April 2026 core forecast at 2.7%, though the real test comes in the June and July prints as freight and petrochemical cost increases fully embed.
U.S. domestic production reached 13.2 million barrels per day in April 2026, up roughly 8% year-over-year, allowing the economy to partially self-insulate from the supply shock in a way that was impossible during the 1973 Arab Oil Embargo. This structural advantage is a key reason the estimated GDP drag from the 2026 crisis is around -0.5%, compared to the -2.6% contraction recorded in 1973.