KOSPI Drops 10% as Crowded AI Trade Unwinds Across Global Markets
8 hrs ago
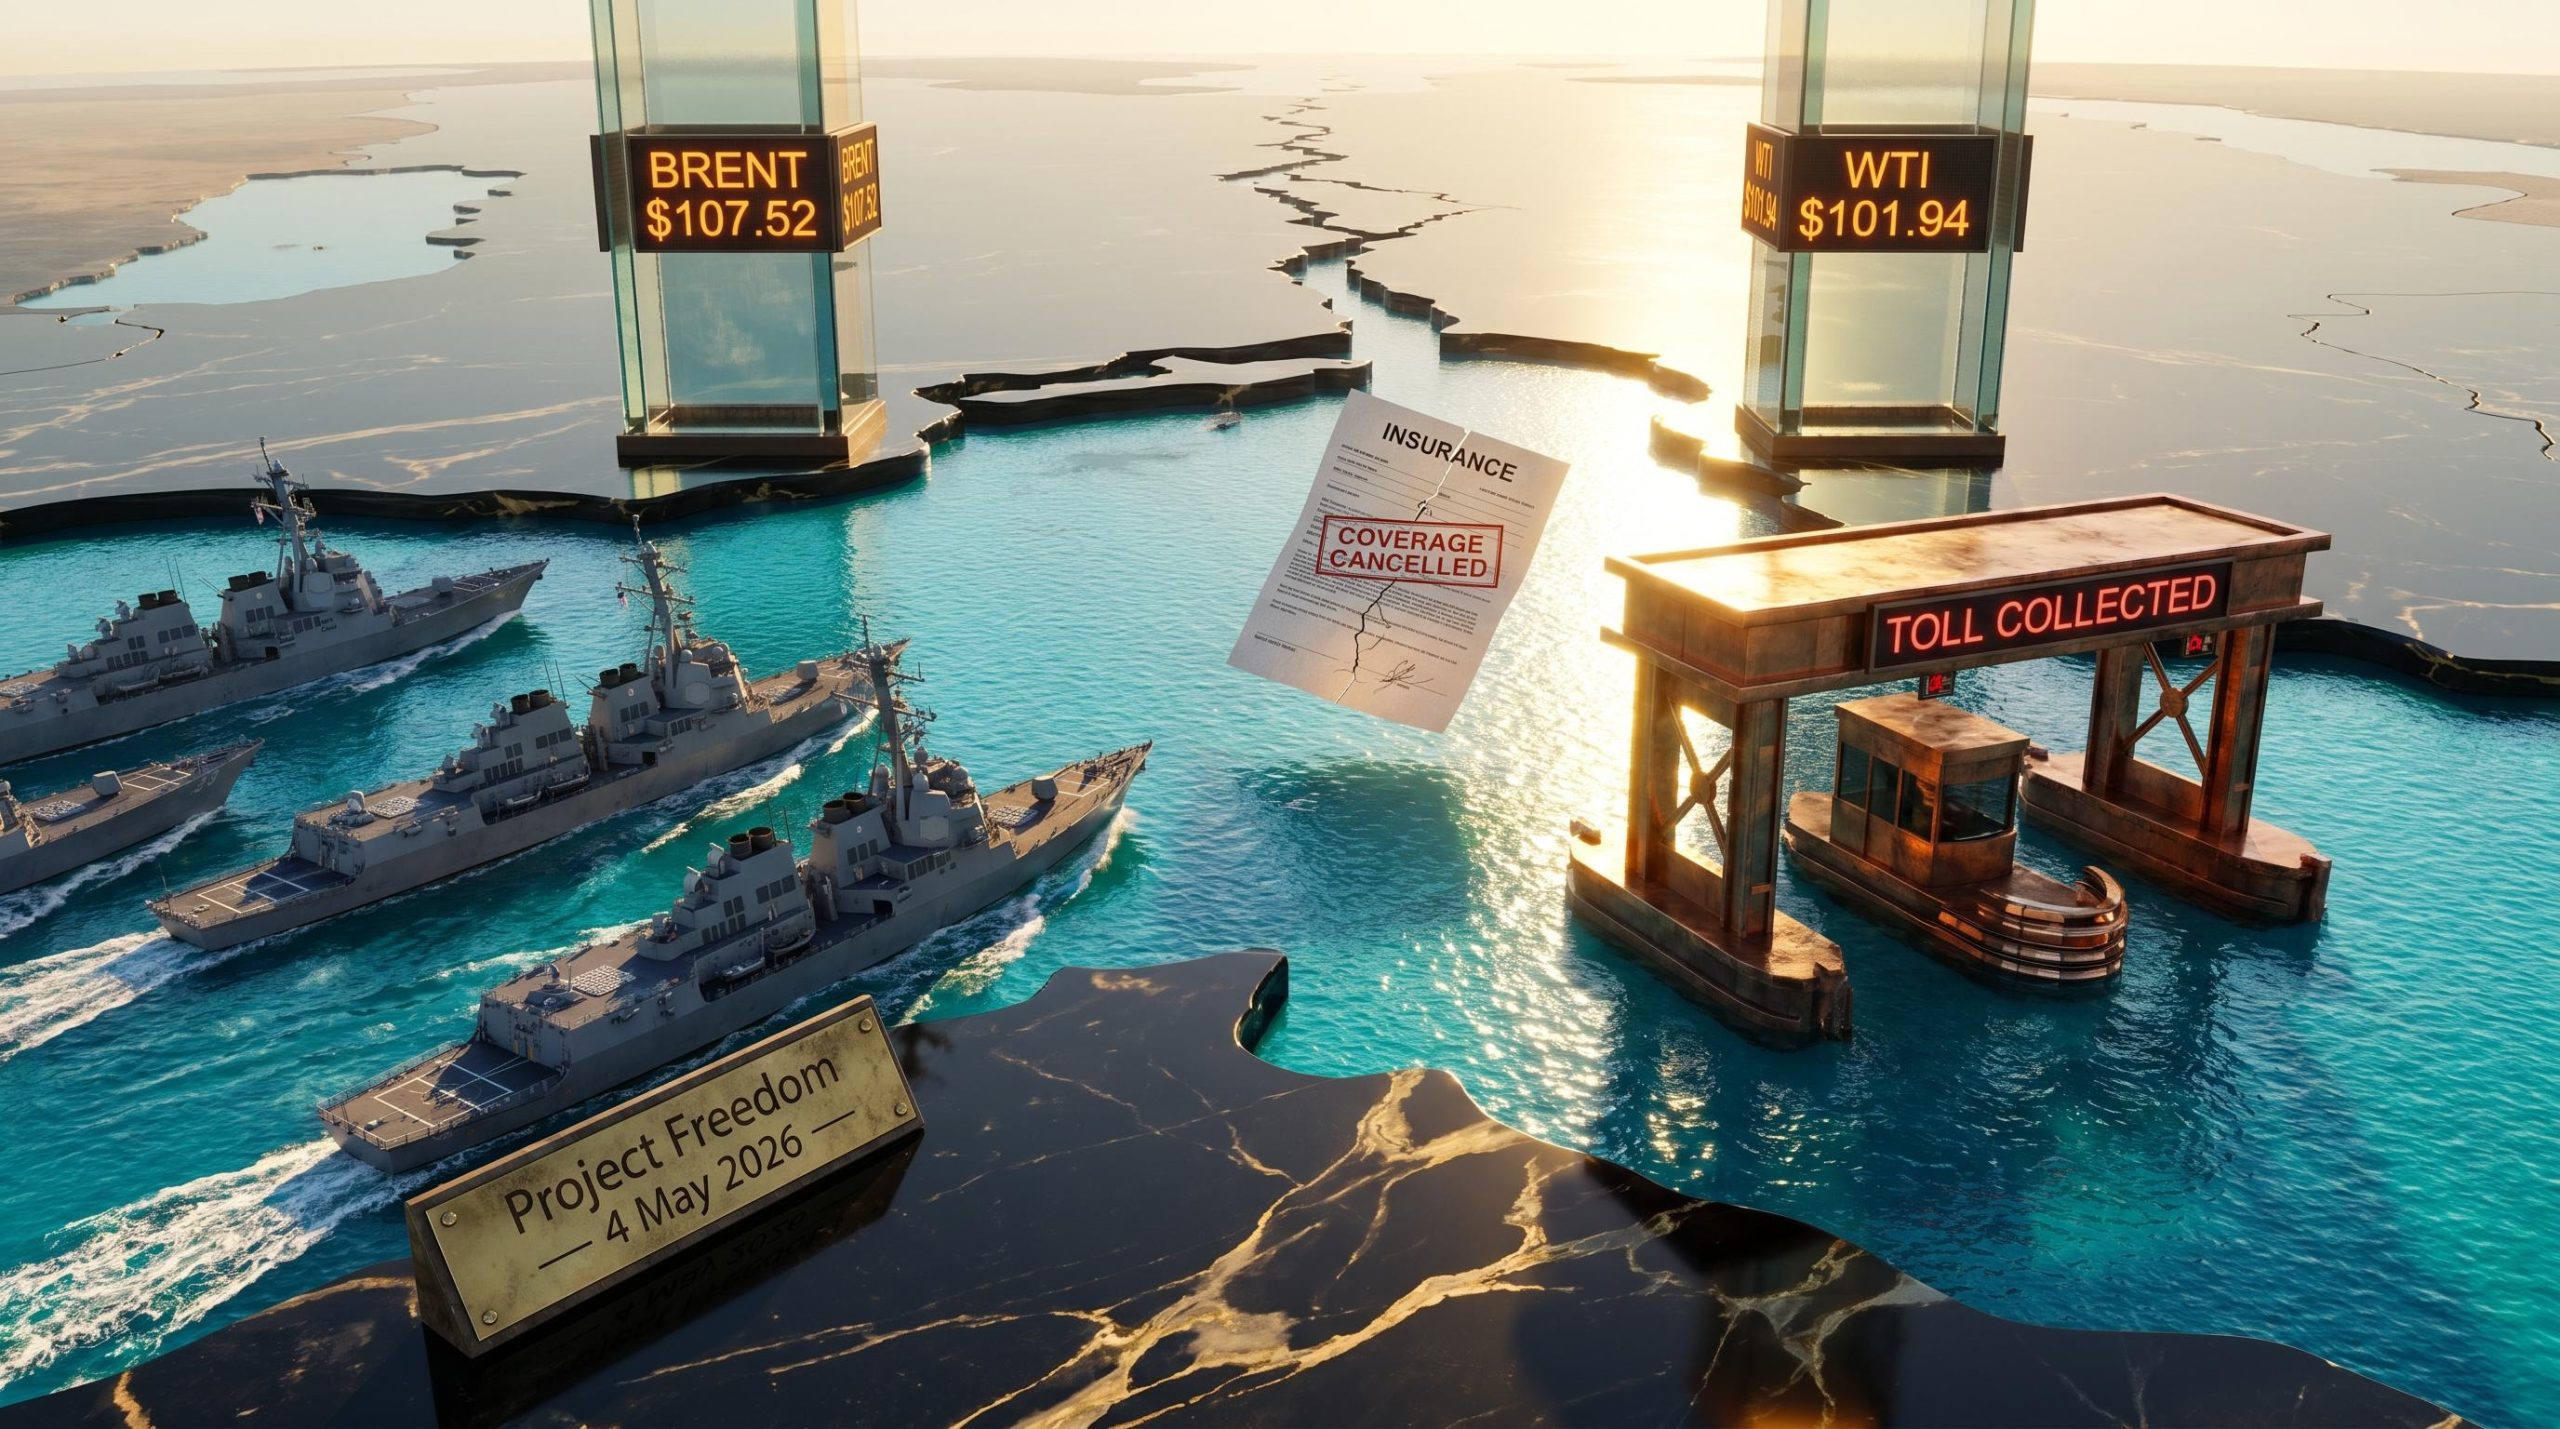
The Strait of Hormuz, a 33-kilometre-wide passage carrying roughly one-fifth of the world’s oil supply, is now operating under an undeclared dual blockade. On one side, the US Navy has turned back approximately 45 vessels. On the other, Iran is enforcing toll payments from select commercial ships and has attacked a bulk carrier near its coast. As of 4 May 2026, the confrontation between Washington and Tehran has moved beyond diplomatic posturing into active maritime enforcement, with President Trump launching “Project Freedom” naval escorts and Iran confirming it has already collected its first toll revenues. Oil markets, shipping insurers, and energy investors worldwide are recalibrating in real time. This article maps the current operational state of the Hormuz crisis, its measurable impact on oil prices and energy supply chains, how producers are responding, what it means for energy equities, and the scenarios investors should be monitoring.
The physical confrontation in the Strait of Hormuz has escalated through a series of discrete enforcement actions, each raising the operational stakes:
CENTCOM’s vessel blockade announcement confirmed the 45-ship figure as of 1 May, with the tally covering commercial vessels turned back from Iranian ports across multiple flag states, including those of major US trading partners.
Trump announced the escort initiative on 3 May, framing it as a direct response to commercial reluctance to transit the waterway. The programme’s operational commencement on 4 May marks the first time in decades that the US Navy has committed to routine commercial vessel accompaniment through the Strait.
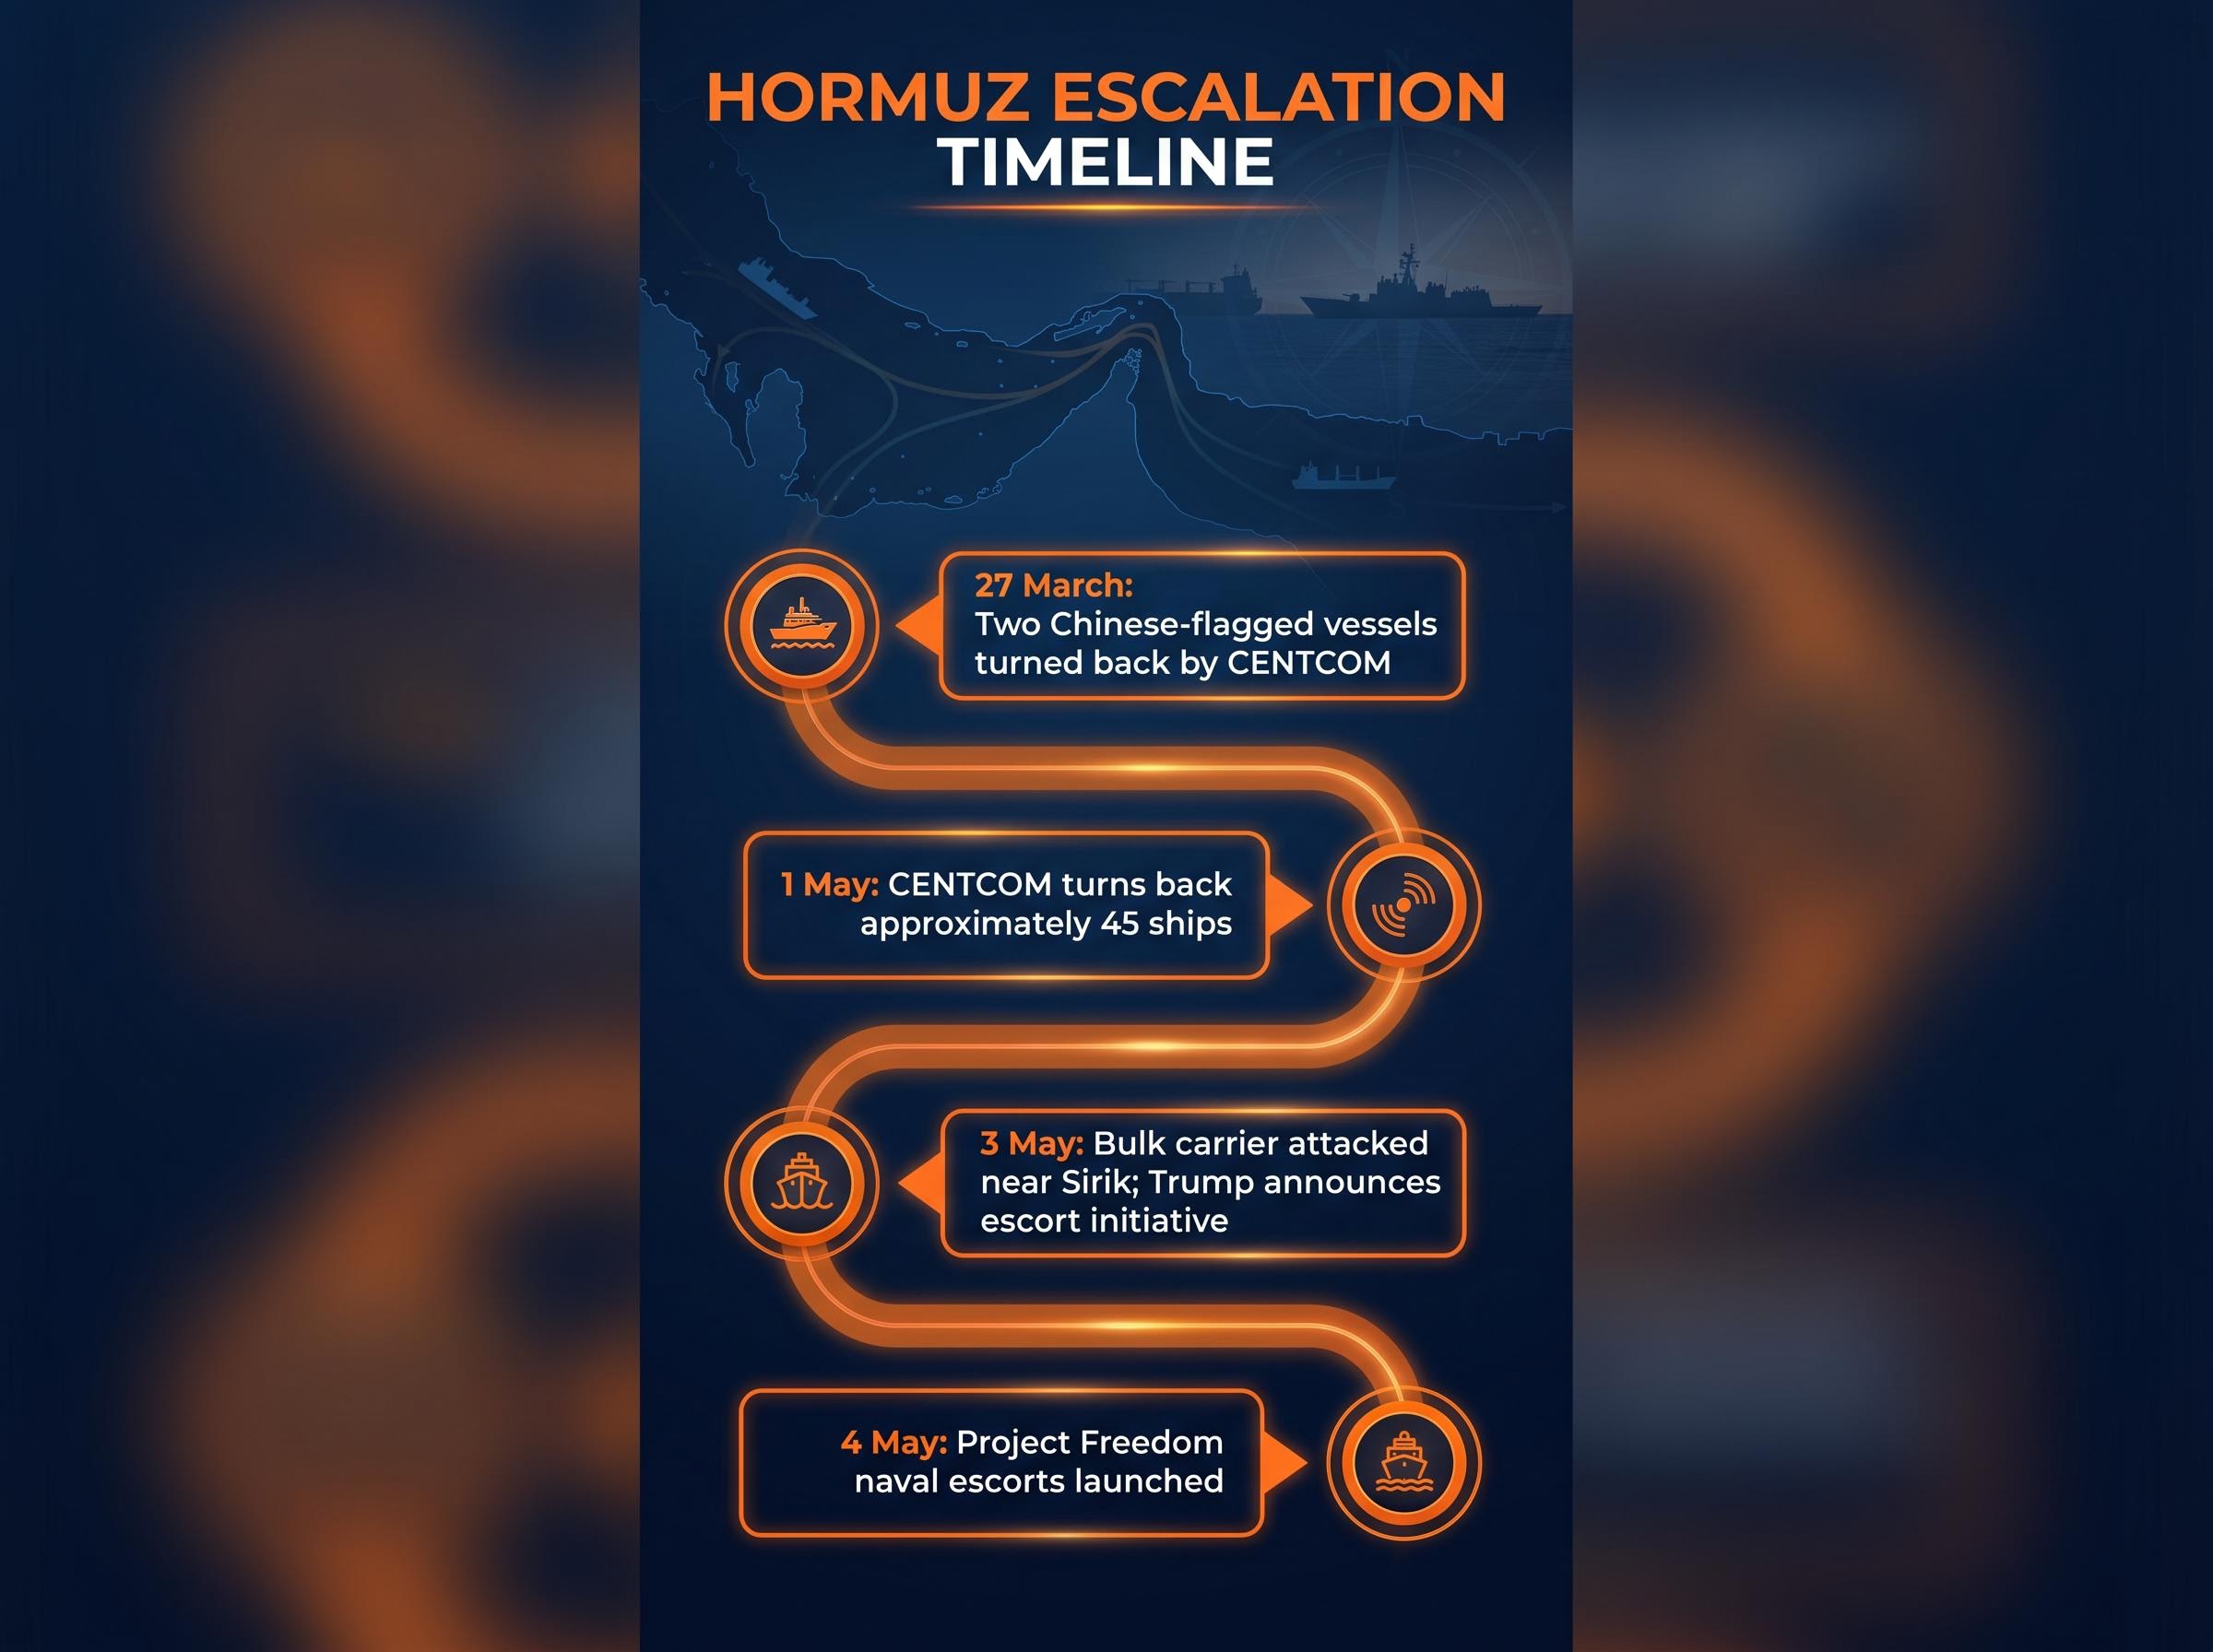
Iran’s deputy parliament speaker confirmed that non-US, non-Israeli vessels may transit the Strait only after paying a toll, and that first revenues have already been deposited. This is not rhetorical posturing. It is partial enforcement, a model distinct from full closure that complicates any binary “open or closed” framing. The toll regime also complicates the path to normal commercial transit: any ceasefire deal would need to address not just military de-escalation but the dismantling of an active revenue collection mechanism.
The Strait of Hormuz carries approximately 20% of global oil supply. The economies most exposed are among the largest on earth.
| Major Importer | Persian Gulf Dependency | Current Exposure |
|---|---|---|
| China | High (largest Gulf crude buyer) | Vessels already blocked; toll regime applies |
| India | High | Rerouting costs rising; insurance premiums spiking |
| Japan | High | Supply uncertainty; limited alternative sourcing |
| EU nations | Moderate to High | Crisis reinforcing arguments for energy independence |
According to Chatham House analysis, the Hormuz crisis has accelerated EU arguments for carbon pricing as a strategic energy independence tool, a policy shift that may outlast the current confrontation.
Houthi forces have threatened to escalate in the Red Sea and potentially close the Bab el-Mandeb strait, the chokepoint connecting the Red Sea to the Gulf of Aden. A simultaneous disruption of both corridors would leave global oil shipping with no straightforward rerouting solution.
This tail risk persists even if Hormuz negotiations succeed. Shipping markets and insurers are not pricing in a near-term normalisation for this reason.
Brent crude stood at approximately $107.52 as of 4 May, down 1.6% in early Monday trading but up 9.3% over the prior week. WTI traded at $101.94, down 2.98% on the day. The tension between a sharp weekly gain and a subsequent daily decline captures the market’s uncertainty in real time.
The current $107 Brent level represents a significant retreat from the Hormuz closure supply shock that pushed intraday prices above $125 on 30 April, when the IEA estimated approximately 13 million barrels per day had been removed from global circulation, a disruption with no modern parallel in scale.
The institutional forecast picture sharpens that uncertainty into a measurable gap.
| Institution | Forecast | Timeframe | Key Assumption |
|---|---|---|---|
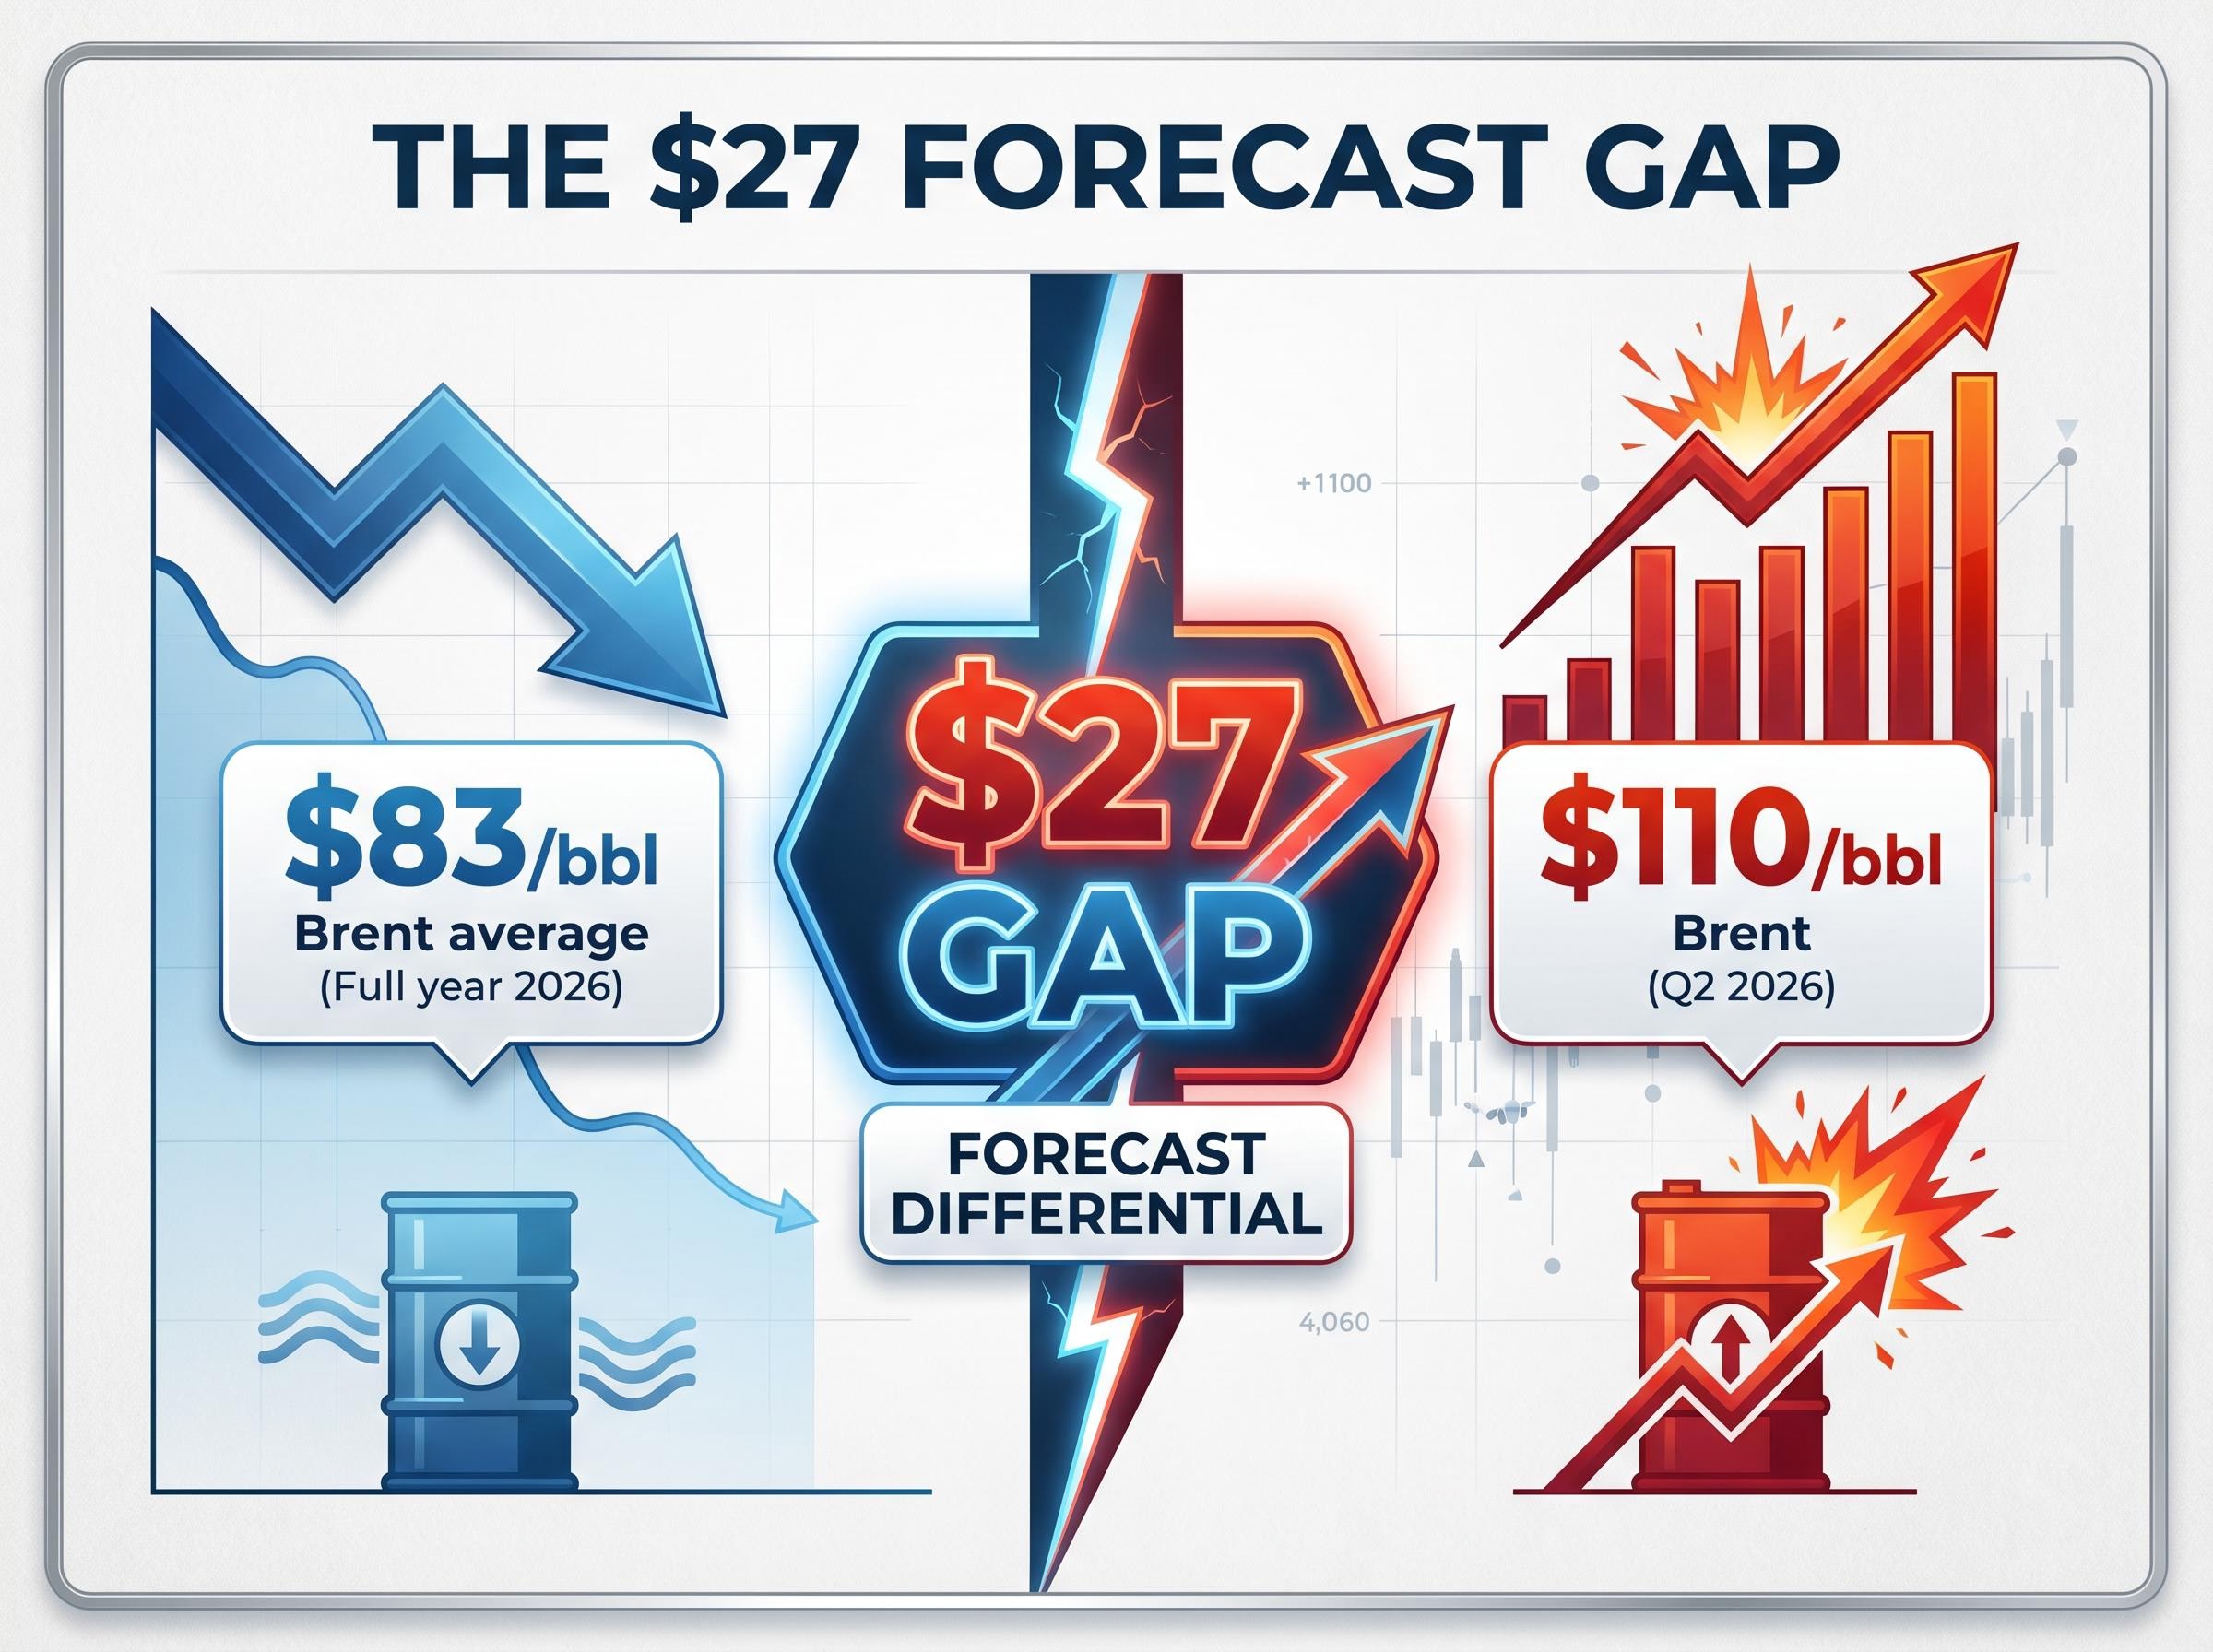
| Goldman Sachs | $83/bbl Brent average | Full year 2026 | Strait reopens; prices correct |
| Morgan Stanley | $110/bbl Brent | Q2 2026 | Disruption persists; slow supply recovery |
Goldman Sachs’s $83 per barrel annual average implies a significant correction from current levels if the Strait reopens. Energy equities currently priced for prolonged disruption face meaningful downside under this scenario.
The $27 gap between Goldman’s annual average and Morgan Stanley’s Q2 forecast is not a rounding error. It reflects a genuine analytical divide on conflict duration, and it represents the single most important variable for energy investor positioning over the next two quarters. The IEA’s May 2026 Oil Market Report, reflecting Hormuz disruption impacts, provides further context but does not resolve the divergence.
The supply-side response is real, but it is fragmented, conditional, and not yet sufficient to close the gap left by a 20% supply corridor disruption.
US crude exports at 5.2 million bpd, up 30% from pre-war levels, represent the largest single-source supply response to the Hormuz disruption.
No combination of these alternative sources can replace the Strait’s throughput at short notice. The buffer is partial.
The global supply deficit mechanics driving the current price floor are more severe than the headline barrel-per-day figures suggest: Goldman Sachs projected a 9.6 million barrel per day shortfall as of late April, while Iran faces a 12-22 day storage capacity ceiling that could force well shut-ins with potentially irreversible damage to mature fields.
The insurance market has created a second lock on the Hormuz corridor, independent of Iranian enforcement or US naval operations.
The Gulf war risk premium surge has been documented with specific cost figures, with per-voyage cover rising from a pre-conflict range of roughly $1,000-$2,200 to $20,000-$120,000, a scale of increase that makes commercial viability calculations straightforward for tanker operators.
The cost arithmetic is straightforward. Even if a vessel could physically transit the Strait, the absence of war risk cover makes the voyage commercially unviable. Insurers are not pricing in a near-term return to normal operations.
Tanker operators and insurers would require a sustained period of incident-free transits, not merely a ceasefire announcement. Restored insurance coverage, verified security guarantees, and demonstrated passage safety would all need to precede any return to normal commercial routing. The timeline for commercial restoration, rather than the date of any ceasefire, is the variable that determines whether Goldman Sachs’s $83 per barrel scenario materialises.
The companies most directly exposed to high oil prices reported profit declines in Q1 2026, and yet both beat depressed earnings expectations.
| Company | Net Income (Q1 2026) | YoY Change | Adjusted EPS (Actual vs Consensus) |
|---|---|---|---|
| ExxonMobil | $4.2 billion | Down 45% | $1.16 vs $1.00 |
| Chevron | $2.2 billion | Down 36% | $1.41 vs $0.95 |
ExxonMobil flagged the potential loss of up to 750,000 barrels per day of Middle East production. Chevron returned $6 billion to shareholders during the quarter. Both remain top institutional picks despite near-term earnings pressure.
The energy sector was the weakest S&P 500 performer on 4 May, falling 1.32%. The disconnect is structural: supply disruption cuts into producer volumes and raises operating costs, meaning not all elevated oil prices translate to elevated profits when production regions are directly affected. The decline occurred alongside a VIX of 16.99, suggesting modest overall market stress. The sector’s weakness is volume-driven, not panic-driven. Beating a depressed consensus while oil remains elevated may still be sufficient for relative outperformance, even as absolute profit figures are down sharply from 2025 levels.
Investors reassessing their exposure in light of the dual-scenario risk should note that energy sector ETF positioning across instruments such as VDE and XLE has shifted materially since the conflict escalated, with TIPS also attracting inflows from investors hedging the scenario where headline PCE inflation exceeds 4% by end-2026.
As of 3 May, Trump is reviewing Iran’s 14-point proposal. The terms include a 30-day ceasefire and simultaneous discussions on Strait reopening and US blockade lifting, with Iran’s nuclear programme deferred. Trump has expressed doubt about the timeline.
The US blockade has denied Iran an estimated $4.8-$5 billion in oil revenues to date, a measure of the economic pressure already embedded in the system.
Two primary scenarios frame the forward view. Rapid de-escalation would point Brent toward Goldman’s $83 per barrel average, with energy equities facing downside risk as the disruption premium unwinds. A prolonged standoff would sustain elevated prices, keep insurance markets locked, and compound shipping dislocation through the northern hemisphere summer.
The signals that will resolve this uncertainty are specific and monitorable:
Investors positioned for prolonged disruption face reversal risk if the Iranian proposal leads to rapid agreement. Those positioned for quick resolution face continued mark-to-market pressure if the standoff extends.
The Strait’s disruption is now reinforced by three independent mechanisms, each of which must unwind before normal commercial transit can resume.
The triple lock on Hormuz: Iranian enforcement and toll collection, US naval blockade operations, and the withdrawal of commercial maritime insurance coverage. Resolution requires all three to reverse, not just a diplomatic signature.
The Goldman Sachs and Morgan Stanley forecast gap, $83 versus $110 for their respective timeframes, remains the clearest single expression of the market’s uncertainty. The ceasefire terms under review, the insurance market’s response, and OPEC+ guidance on 7 June will each narrow or widen that gap.
The Hormuz crisis is no longer a geopolitical tail risk. It is the central variable in global energy supply, and investor positioning that treats it as temporary or binary is likely to be overtaken by events.
The retail sentiment divergence from institutional caution has been one of the more structurally unusual features of this crisis: AAII bullish readings reached 46% in late April even as Goldman Sachs warned of a 9.6 million barrel per day supply deficit, a disconnection between surveyed optimism and physical supply data that creates additional reversal risk when sentiment eventually reprices.
This article is for informational purposes only and should not be considered financial advice. Investors should conduct their own research and consult with financial professionals before making investment decisions. These statements are speculative and subject to change based on market developments and geopolitical outcomes. Past performance does not guarantee future results.
The Strait of Hormuz is a 33-kilometre-wide passage through which approximately 20% of the world's oil supply travels, making it the single most critical chokepoint in global energy logistics. Any sustained disruption forces major importers including China, India, Japan, and EU nations to seek costlier alternative supply routes.
Brent crude reached approximately $107.52 on 4 May 2026, having spiked above $125 intraday on 30 April when the IEA estimated around 13 million barrels per day had been removed from global circulation. The price was up roughly 9.3% over the prior week before a 1.6% daily pullback.
Project Freedom is a US Navy escort programme launched on 4 May 2026 to accompany neutral commercial vessels through the Strait of Hormuz, with explicit warnings that force would be used against Iranian interference. It was introduced as a direct response to commercial shipping reluctance caused by cancelled war risk insurance and Iranian toll enforcement.
The Goldman Sachs and Morgan Stanley forecast gap ($83 versus $110 per barrel for their respective timeframes) means investors face reversal risk in either direction: those positioned for prolonged disruption face downside if ceasefire terms are agreed quickly, while those expecting rapid resolution face continued mark-to-market pressure if the standoff extends. Monitoring ceasefire announcements, insurance market coverage restoration, and OPEC+ guidance on 7 June are the key signals.
Supply disruption directly cuts into producer volumes and raises operating costs, meaning elevated oil prices do not fully translate into elevated profits when production regions are affected. ExxonMobil and Chevron both reported sharply lower Q1 2026 earnings despite beating depressed consensus estimates, and the energy sector was the weakest S&P 500 performer on 4 May 2026.