Why the Magnificent Seven Are Lagging Despite AI Fever
14 mins ago
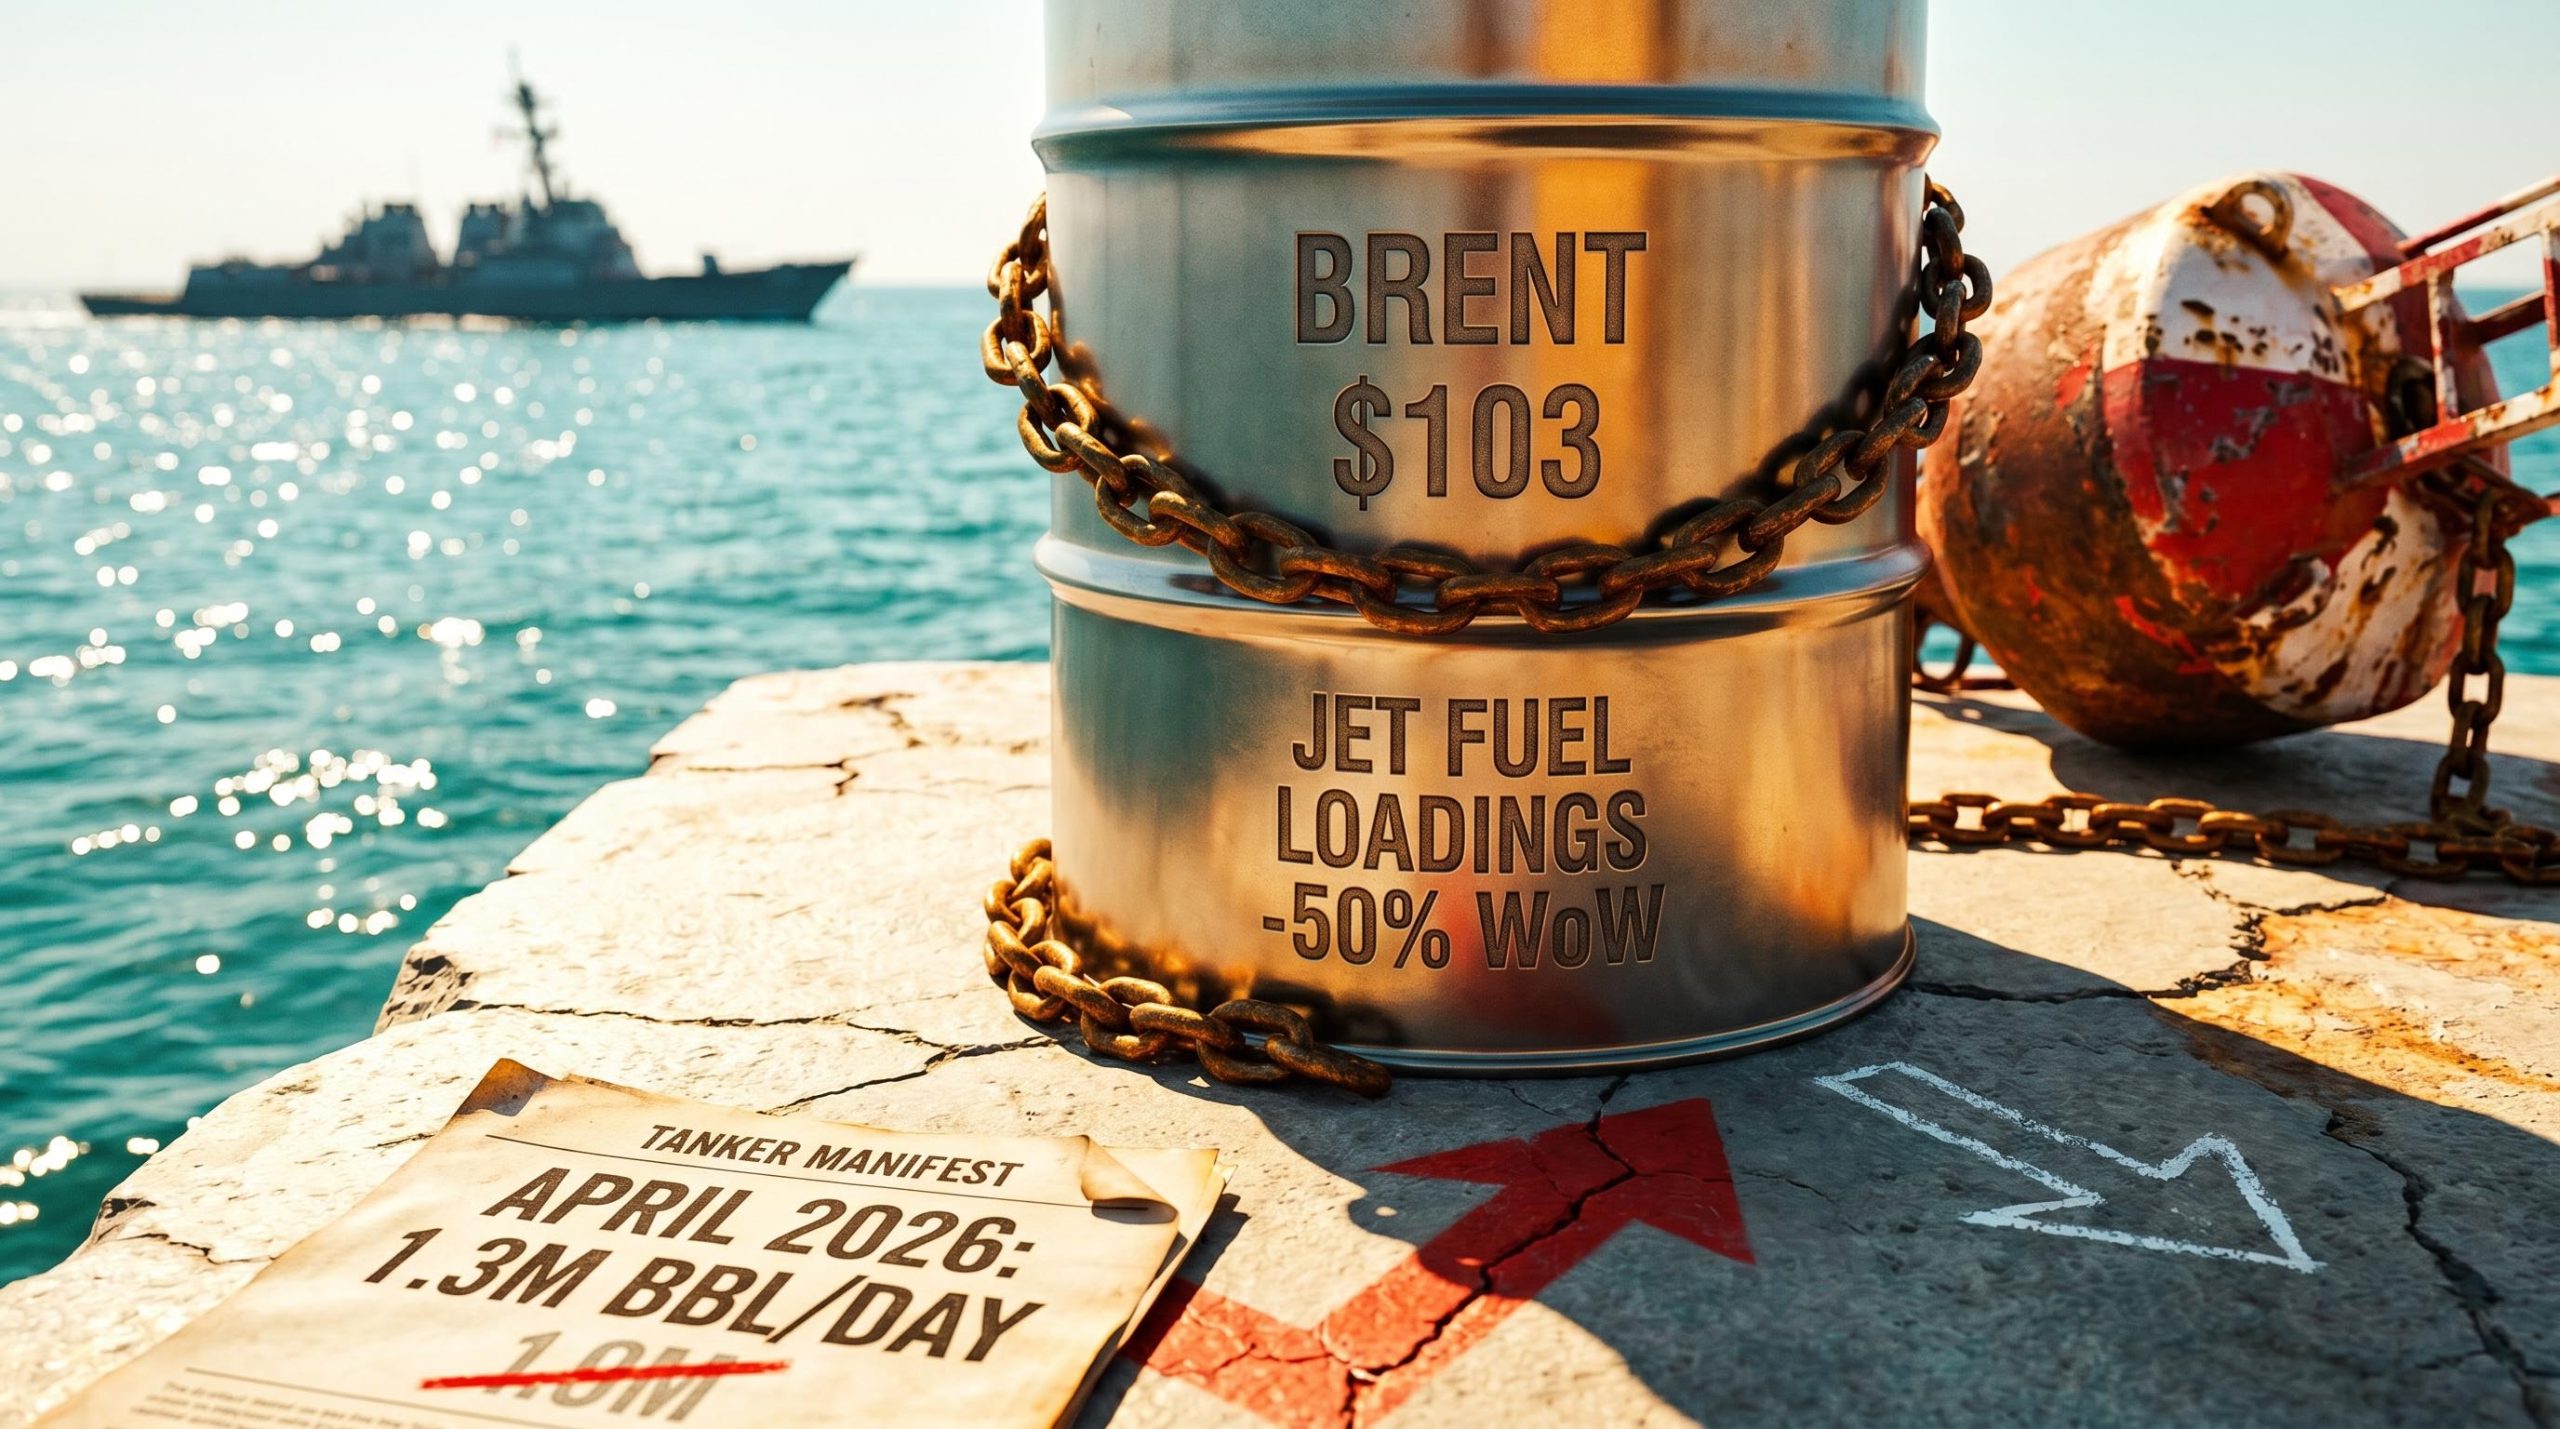
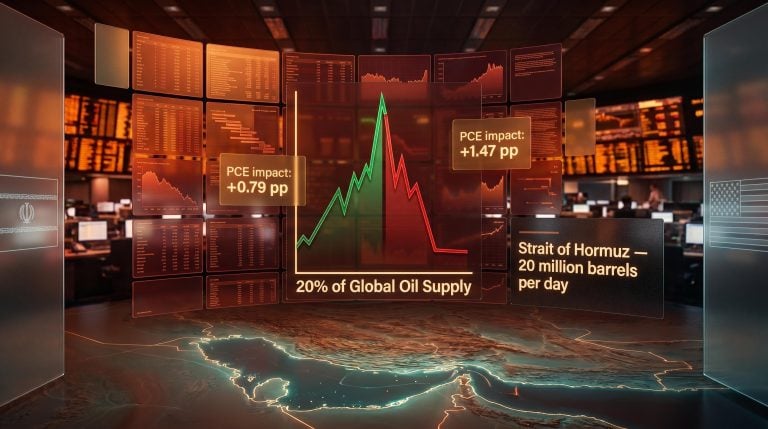
Brent crude reversed a 5.8% intraday freefall to close the overnight session up 1.3% at $103 on 7 May 2026, the same session in which US forces struck Iranian port facilities. The swing captured a market trading two mutually exclusive outcomes simultaneously: diplomatic de-escalation and military escalation. Behind the headline volatility, a structural supply crisis is building. The Strait of Hormuz, the chokepoint carrying roughly 20% of global petroleum, remains partially restricted, with tanker delays ongoing, US naval escorts operational, and war risk insurance costs up 20-30%. Jet fuel tanker loadings have collapsed 50% week on week according to Kpler data, and ConocoPhillips has warned that import-dependent nations could face critical shortfalls as early as June. This analysis traces the full supply-side chain: from the Iran conflict’s impact on oil prices through the Hormuz shipping constraint, into the jet fuel crisis building toward a summer shortfall, and out to the airline and consumer-sector consequences US investors need to price now.
Brent crude fell to an intraday low of approximately $96 on 7 May as peace deal rumours swept through trading desks. The collapse looked like capitulation. Then the session reversed.
By the New York close, Brent had recovered to $100.93. By the time the overnight session absorbed confirmation of US strikes on Iranian port facilities, the contract stood at $103, up 1.3% on the day. A barrel of oil that had been priced for peace at 10 a.m. was priced for escalation by midnight.
WTI traced the same arc. It touched an intraday low of $89.88, an 8-10% swing from the session high, before closing at $91.85 and then firming to $94.81 in subsequent trading.
The equity market moved in mirror image. The Dow closed at 49,913, with the S&P 500 at 7,337 (down 0.38% on the late-session strike confirmation) and the VIX at 17.08, down 1.78%, reflecting the de-escalation optimism that dominated the first half of the session.
Key price data from the 7 May session:
Brent reversed a 5.8% intraday decline to close the overnight session up 1.3% at $103, compressing the entire Iran conflict trade into a single session.
The intraday pattern is not noise. It is the market’s real-time attempt to price two incompatible outcomes, and it will repeat in every session where diplomatic rumours and military action compete for the tape.
The Strait of Hormuz has been a recurring source of oil supply disruption, and past episodes offer a calibration anchor for the current crisis. Two precedents matter most.
The 1980s Tanker War stretched across several years, with Iranian and Iraqi forces targeting commercial shipping in the Persian Gulf. Brent prices at that time operated from a significantly lower baseline, and the disruption, while prolonged, played out against a market with more spare capacity and fewer just-in-time refinery dependencies.
The 2019 incidents, including drone strikes on Saudi Aramco facilities and tanker seizures near the Strait, produced sharp but short-lived price spikes. Brent was trading below $65 at onset, meaning the percentage shock was large but the absolute dollar impact on downstream consumers was contained.
The current disruption starts from a fundamentally different position. Brent at approximately $103 is already elevated well above both prior baselines, meaning every additional dollar of risk premium compounds on a higher cost floor.
| Event | Approx. Brent at onset | Duration | Key supply impact |
|---|---|---|---|
| 1980s Tanker War | ~$30 | Multi-year | Sustained tanker attacks, naval escort convoys |
| 2019 incidents | ~$60-65 | Weeks to months | Short-term supply spike, rapid normalisation |
| 2026 Iran conflict | ~$103 | Ongoing | Partial Strait restriction, jet fuel loadings down 50% WoW |
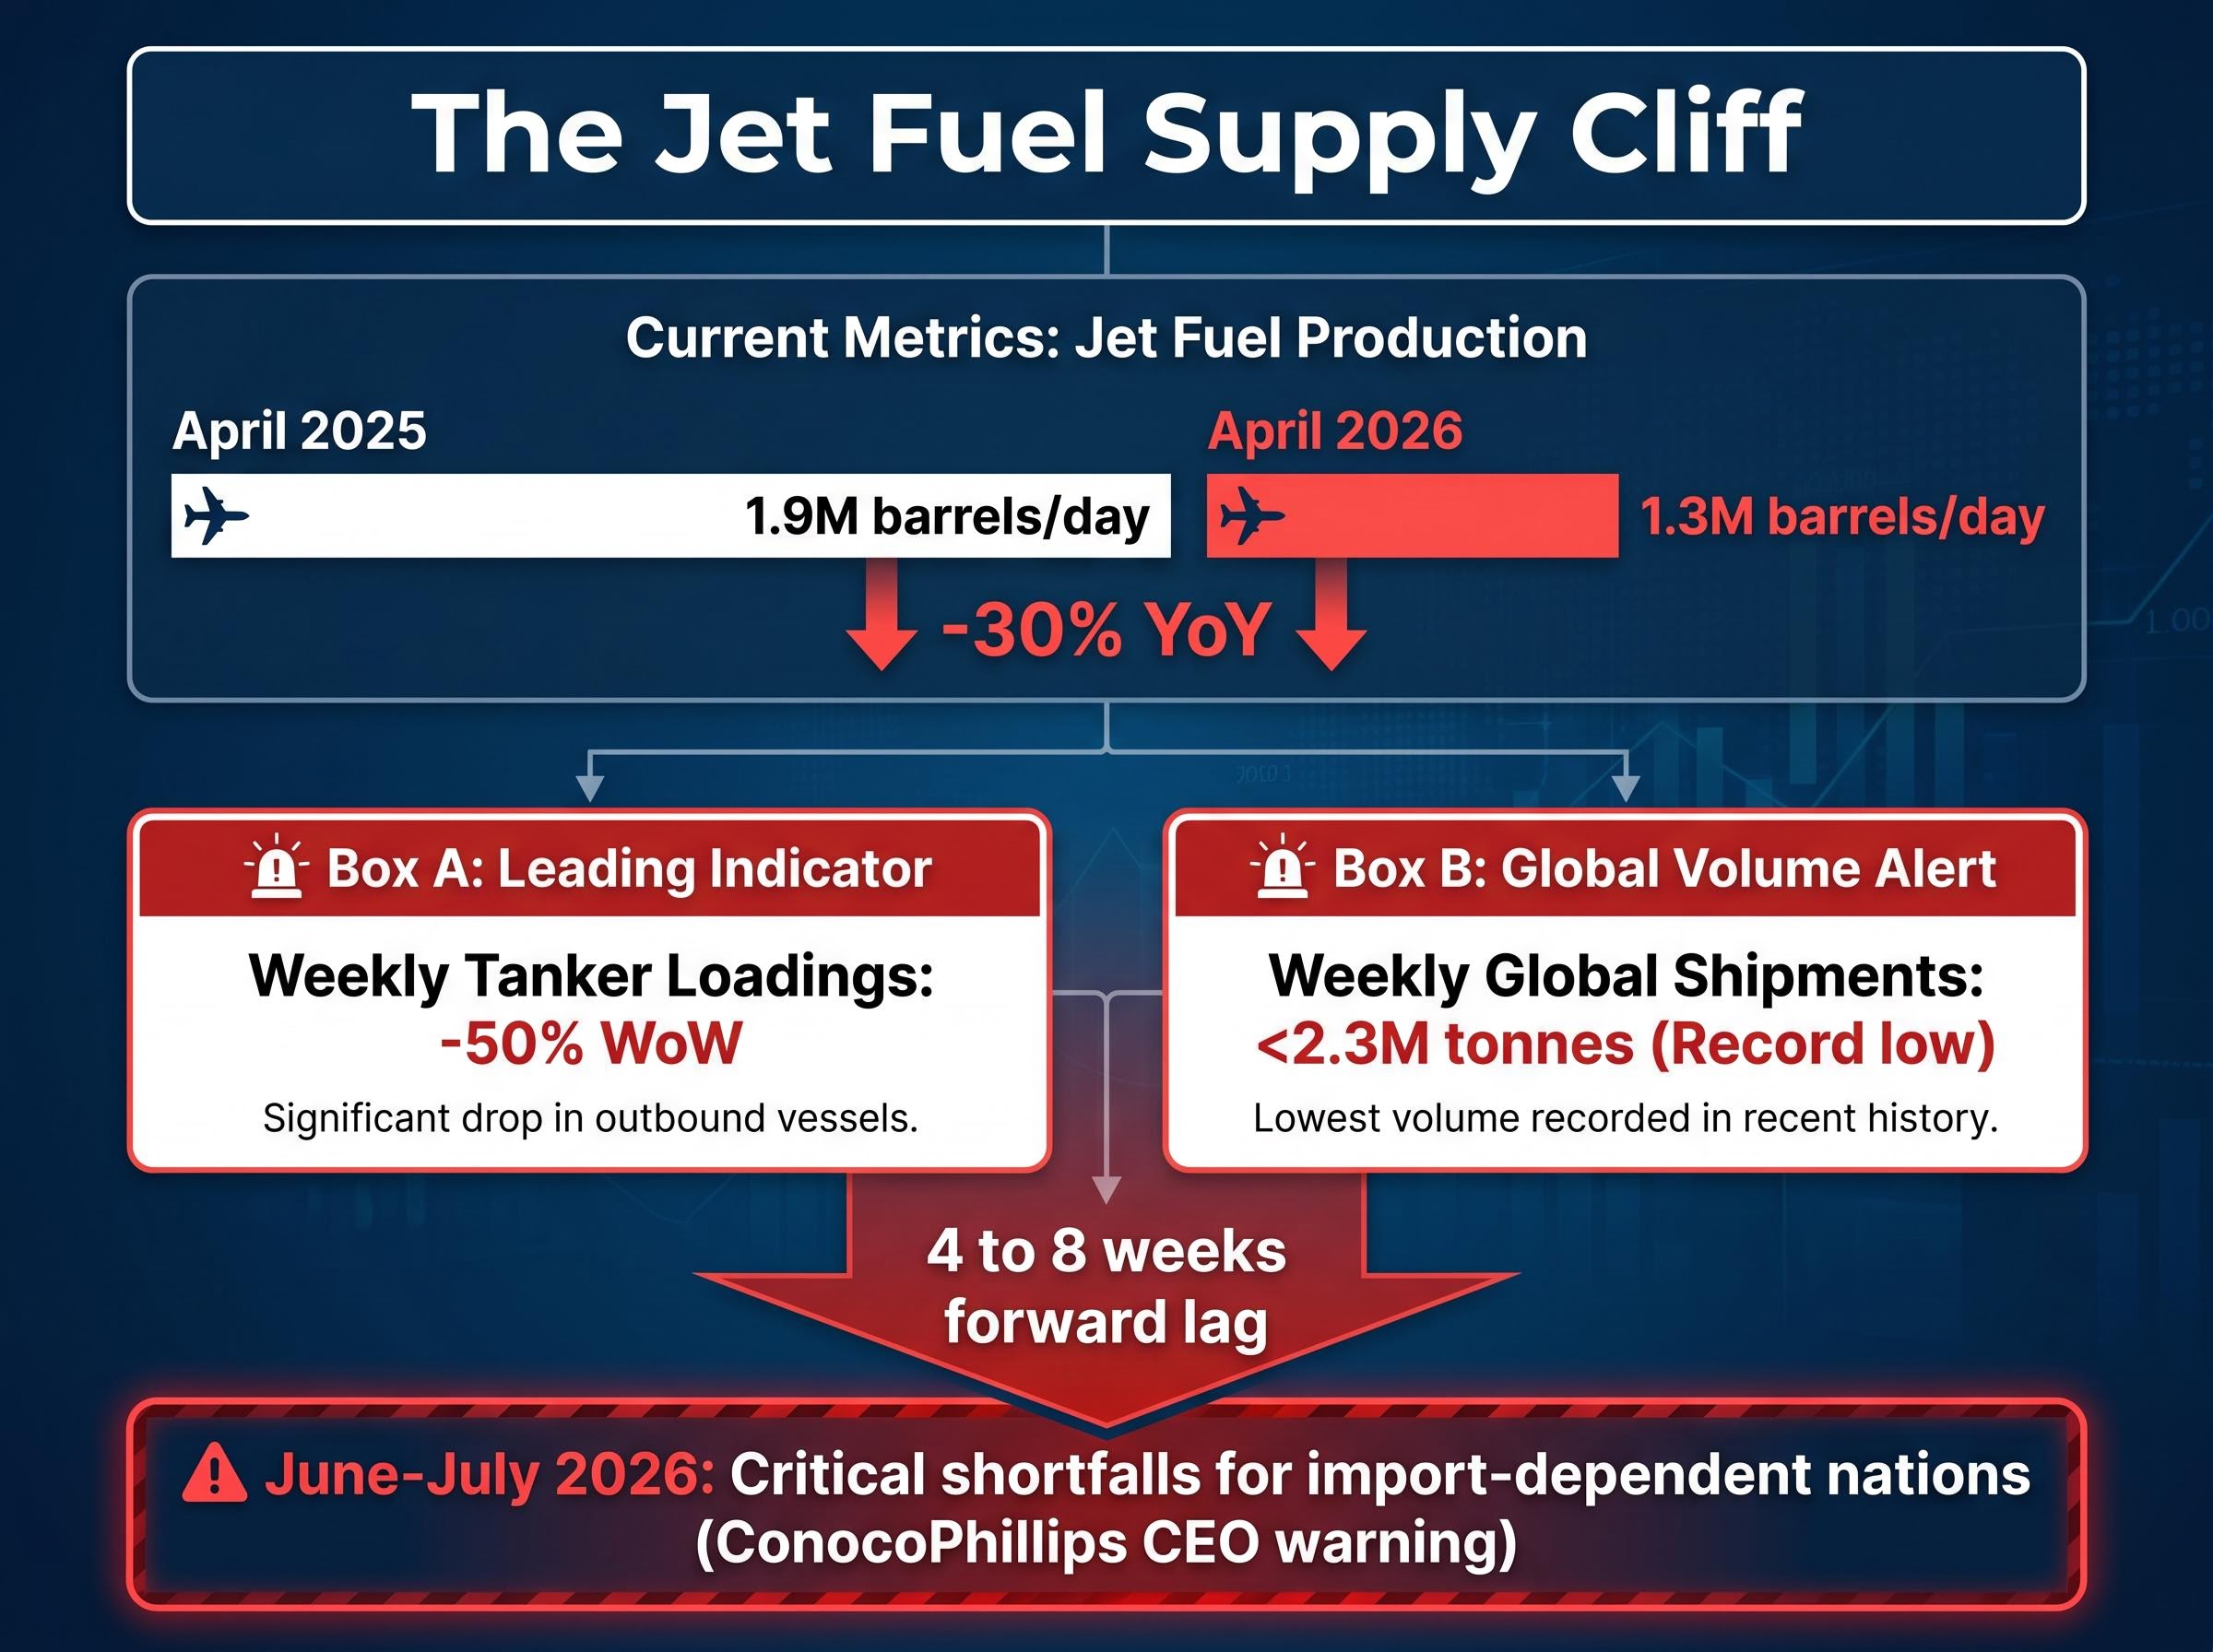
The Strait’s role as a single point of failure extends beyond aggregate crude flows. April 2026 jet fuel exports fell to 1.3 million barrels per day versus 1.9 million barrels per day in April 2025, a 30% year-on-year decline, suggesting jet fuel flows are disproportionately disrupted relative to total petroleum volumes. Historical analogues tend to be cited to argue that Hormuz disruptions resolve within months; the current elevated starting price means that even a short disruption carries a structurally larger economic cost than precedent would imply.
Iranian strikes on the Fujairah pipeline bypass route compounded the Hormuz bottleneck in a way that historical analogues do not account for: Fujairah served as one of the only active alternative export corridors, meaning its damage removed the primary safety valve that past disruption episodes could draw on when Strait traffic was constrained.
Approximately 20% of global petroleum transits the Strait of Hormuz. Partial restriction of that passage is not a sentiment event; it is a quantifiable supply constraint with three measurable indicators:
The Strait has not been fully closed. That distinction matters, because a partial restriction creates a supply drag that is harder to model than a binary shutdown. Every barrel still moves through, but it moves more slowly, at higher cost, and with greater uncertainty about whether it will reach its intended refinery.
The IEA estimated that at the peak of the closure, approximately 13 million barrels per day removed from global circulation, a disruption the agency described as without modern parallel in scale, establishing the outer bound of what the current partial restriction represents if conditions deteriorate rather than resolve.
Chevron’s chief executive offered the most direct forward-looking framing in early May commentary: normalising Strait traffic would likely take weeks to months even after any cessation of hostilities.
Chevron CEO commentary: Hormuz normalisation could take “weeks to months” post-ceasefire, establishing that the supply disruption has a duration problem, not just an intensity problem.
Additional sanctions on Iranian oil exports, confirmed by the US government on 7 May 2026, add a further layer. Even if tanker traffic resumes normal patterns, sanctioned barrels do not re-enter the market on the same timeline as physical restrictions ease. The insurance cost increase alone functions as a de facto supply-side tax; investors focused on downstream sectors need to recognise that the Hormuz constraint does not flip off when headlines improve.
The most concrete supply signal available is not a forecast. It is a shipment record.
Kpler data from early May 2026 shows jet fuel loaded onto tankers fell 50% week on week. Worldwide jet fuel exports contracted 30% year on year in April 2026, with volumes dropping to 1.3 million barrels per day from 1.9 million barrels per day in April 2025. Global jet fuel shipments hit a record low of fewer than 2.3 million tonnes in the most recent week of available data, with inventories described as exhausted.
| Metric | April 2025 | April 2026 | Change |
|---|---|---|---|
| Jet fuel exports (daily) | 1.9M barrels/day | 1.3M barrels/day | -30% YoY |
| Tanker loadings (weekly) | N/A | Record low | -50% WoW |
| Global shipments (weekly) | N/A | <2.3M tonnes | Record low |
The lag mechanic is what converts a loading statistic into an inventory crisis. Current low loadings translate to depleted inventories four to eight weeks forward. ConocoPhillips’ chief executive warned that import-dependent nations could face critical jet fuel shortfalls as early as June or July 2026.
ConocoPhillips CEO warning: import-dependent nations could face critical jet fuel shortfalls in June-July 2026, a supply-chain lag story rather than a prediction.
Citi’s framing reinforces the timeline uncertainty: crude prices are expected to remain highly volatile until a clear Iran diplomatic resolution emerges. The 50% loading decline is not a scenario. It is current data already translating into forward inventory gaps, establishing a hard deadline for investors in airlines, logistics, and energy.
The oil and jet fuel disruption has crossed from commodity markets into earnings guidance and household price levels. The evidence arrived in Q1 2026 results.
The Global Jets ETF gained 1.28% to 27.59 on 7 May as de-escalation rumours lifted sentiment. The Energy sector ETF fell 1.78% in the same session. That divergence looks rational on a one-day basis, but the Jets ETF is pricing in diplomatic relief, not the structural June-July fuel shortfall that Kpler data and ConocoPhillips have flagged. No major US carrier has publicly confirmed hedging ratios or capacity cut announcements as of 7 May, creating an information gap that increases binary risk for airline equity holders.
The crack spread exposure faced by airlines, the refinery margin component not covered by crude hedges, widened by as much as 423% in some markets, from approximately US$22 to US$115 per barrel, illustrating why carriers with high crude hedging ratios can still face catastrophic fuel cost increases when refining margins decouple from crude benchmarks.
Morgan Stanley has flagged aviation fuel as a significant knock-on from oil price spikes in 2026 conflict commentary, with higher Treasury yields from elevated defence spending creating additional headwinds for both stocks and bonds.
Downstream, the cost pass-through is already visible in consumer-facing earnings:
Whirlpool CEO commentary compared current conditions to the Global Financial Crisis, explicitly tying the cost environment to the Iran conflict’s impact on petroleum-derived input costs.
Chinese suppliers are reporting raw material cost increases of 20-30% or more due to Iran conflict-driven petroleum and shipping costs. The Whirlpool and Shake Shack results illustrate that the conflict’s petroleum cost shock is already visible in Q1 earnings, not merely in commodity futures. Consumer-facing equities with limited hedging capacity remain the most exposed if the June-July shortfall materialises.
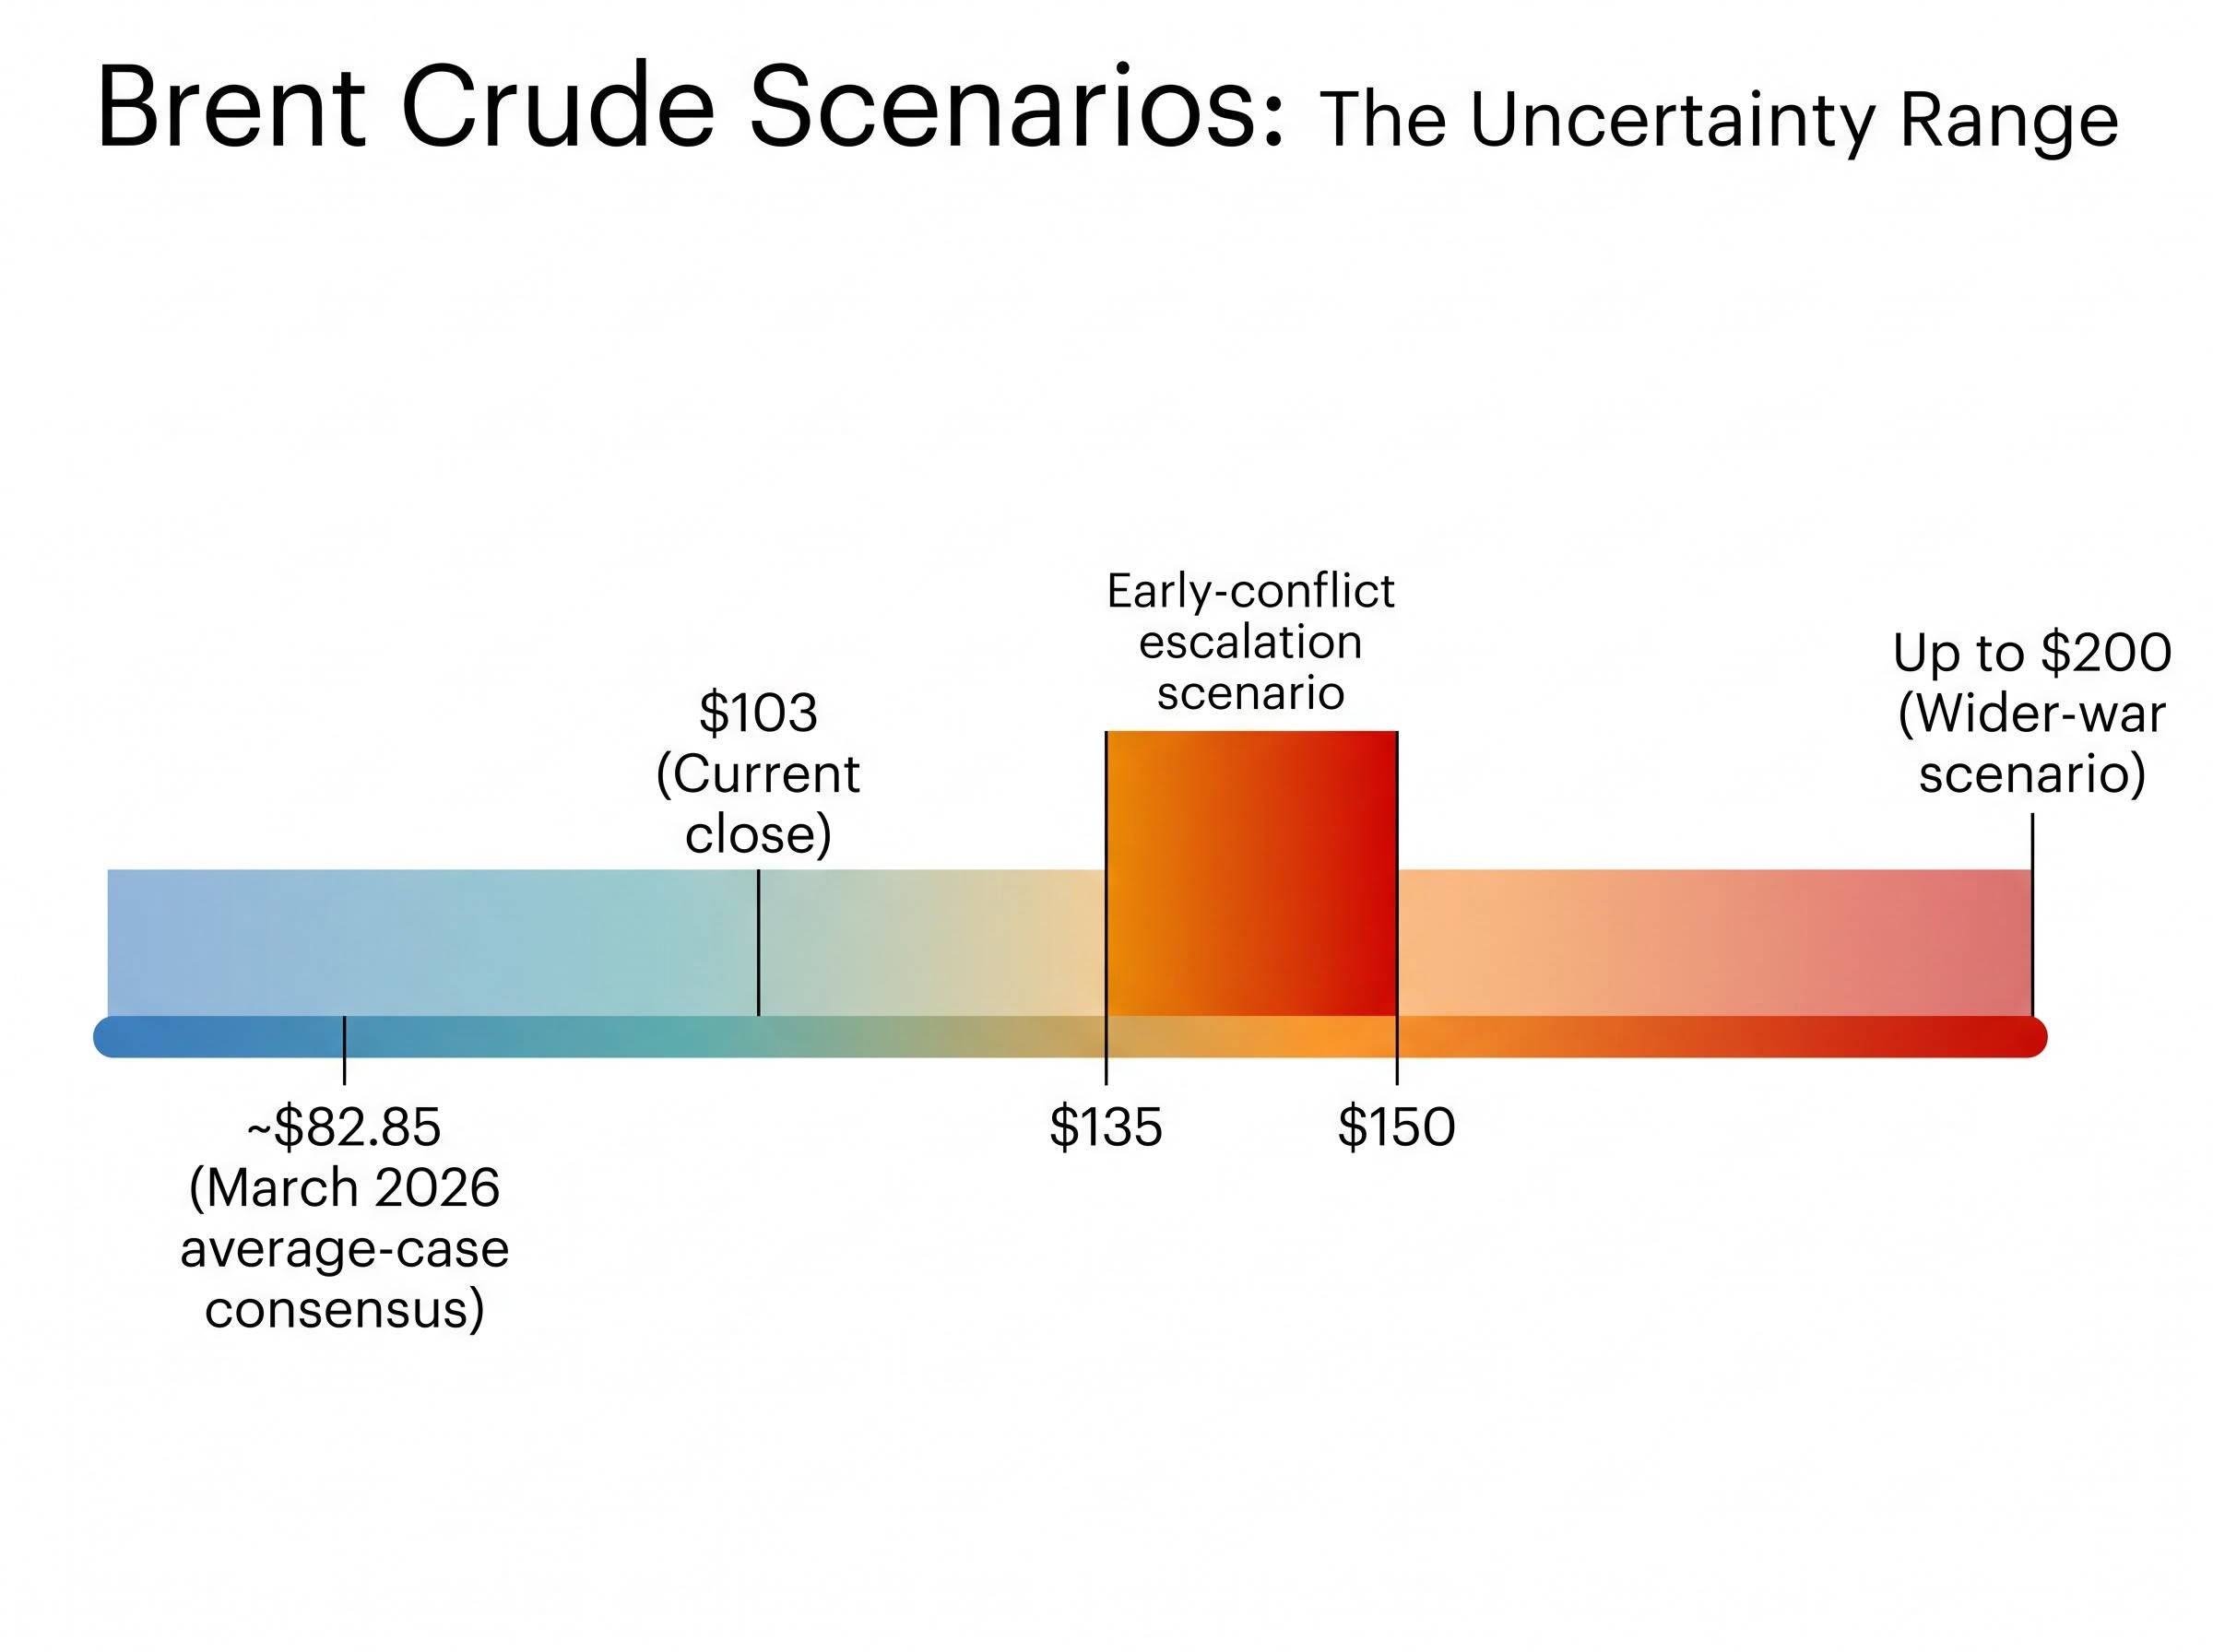
When Citi, early-conflict modellers, and consensus forecasters span from $82 to $200 on Brent, the range itself is the information.
| Source | Brent projection | Key assumption |
|---|---|---|
| March 2026 average-case consensus | ~$82.85 | Contained disruption, diplomatic resolution |
| Early-conflict escalation scenario | $135-$150 | Prolonged Hormuz restriction |
| Wider-war scenario | Up to $200 | Full regional escalation |
Brent’s current close of $103 already sits above the March 2026 average-case consensus, meaning the market has repriced the conflict baseline before the forecast period has even played out. Citi’s near-term framing is the most actionable: continued high volatility is the base case until a clear diplomatic resolution emerges, with no specific price target, because the variable that matters is diplomatic timeline rather than supply quantity.
Three partial relief measures cap extreme upside scenarios without resolving the structural Hormuz constraint:
A forecast range from $82 to $200 reflects genuine binary optionality in the diplomatic outcome. Investors who treat the midpoint as a planning assumption are underpricing tail risk in either direction.
Goldman Sachs’s supply-demand imbalance projection of a shift from a 1.8 million barrels per day surplus in 2025 to a 9.6 million barrels per day deficit in Q2 2026 represents the sharpest institutional forecast available, contextualising why even the downside Brent scenarios in the current analyst range sit well above the pre-conflict consensus.
Chevron’s chief executive stated that Hormuz normalisation would take weeks to months post-ceasefire. That timeline is the durable framework for the current crisis: even an agreement announced tomorrow does not unwind the jet fuel loading data from April or refill inventories before June.
Three investor exposure categories sit most directly in the path of the June-July shortfall:
Brent at approximately $103 already exceeds the March 2026 average-case consensus of approximately $82.85. The market has repriced the conflict’s baseline permanently upward, and the shortfall peak has not yet arrived.
The market has repriced the Iran conflict baseline above the pre-conflict consensus. The inventory gap between current loading data and June demand cannot be closed by diplomacy alone on any realistic timeline.
The 50% week-on-week loading collapse and exhausted inventories are not forward projections. They are current data. The supply disruption is already in the pipeline, and the second wave is loading onto tankers now.
This article is for informational purposes only and should not be considered financial advice. Investors should conduct their own research and consult with financial professionals before making investment decisions. Past performance does not guarantee future results. Financial projections referenced in this analysis are subject to market conditions and various risk factors.
The Strait of Hormuz is a narrow waterway through which roughly 20% of global petroleum transits, making it the world's most critical oil chokepoint. Partial restriction of the Strait in 2026 has created tanker delays, triggered US naval escorts, and pushed war risk insurance costs up 20-30%, effectively raising the cost of every barrel that passes through.
Jet fuel tanker loadings fell 50% week on week in early May 2026 according to Kpler data, with worldwide jet fuel exports contracting 30% year on year to 1.3 million barrels per day. ConocoPhillips CEO warned that import-dependent nations could face critical jet fuel shortfalls as early as June or July 2026 due to the supply-chain lag between loading data and inventory levels.
Brent dropped to an intraday low of approximately $96 as peace deal rumours circulated, then reversed to close the overnight session at $103 after US strikes on Iranian port facilities were confirmed. The swing reflected the market simultaneously pricing two incompatible outcomes: diplomatic de-escalation and military escalation.
Import-dependent airlines with limited fuel hedging, consumer goods manufacturers relying on petroleum-derived inputs, and energy sector equities are the three categories most directly in the path of the June-July shortfall. Q1 2026 earnings from Whirlpool and Shake Shack already showed margin compression and guidance cuts tied to conflict-driven cost increases.
Chevron's chief executive stated that normalising Strait of Hormuz traffic would likely take weeks to months even after any cessation of hostilities. This means a ceasefire announced today would not refill jet fuel inventories before the June-July shortfall window flagged by ConocoPhillips.