Hormuz Prices Have Normalised. Geopolitical Inflation Risk Has Not.
2 hrs ago
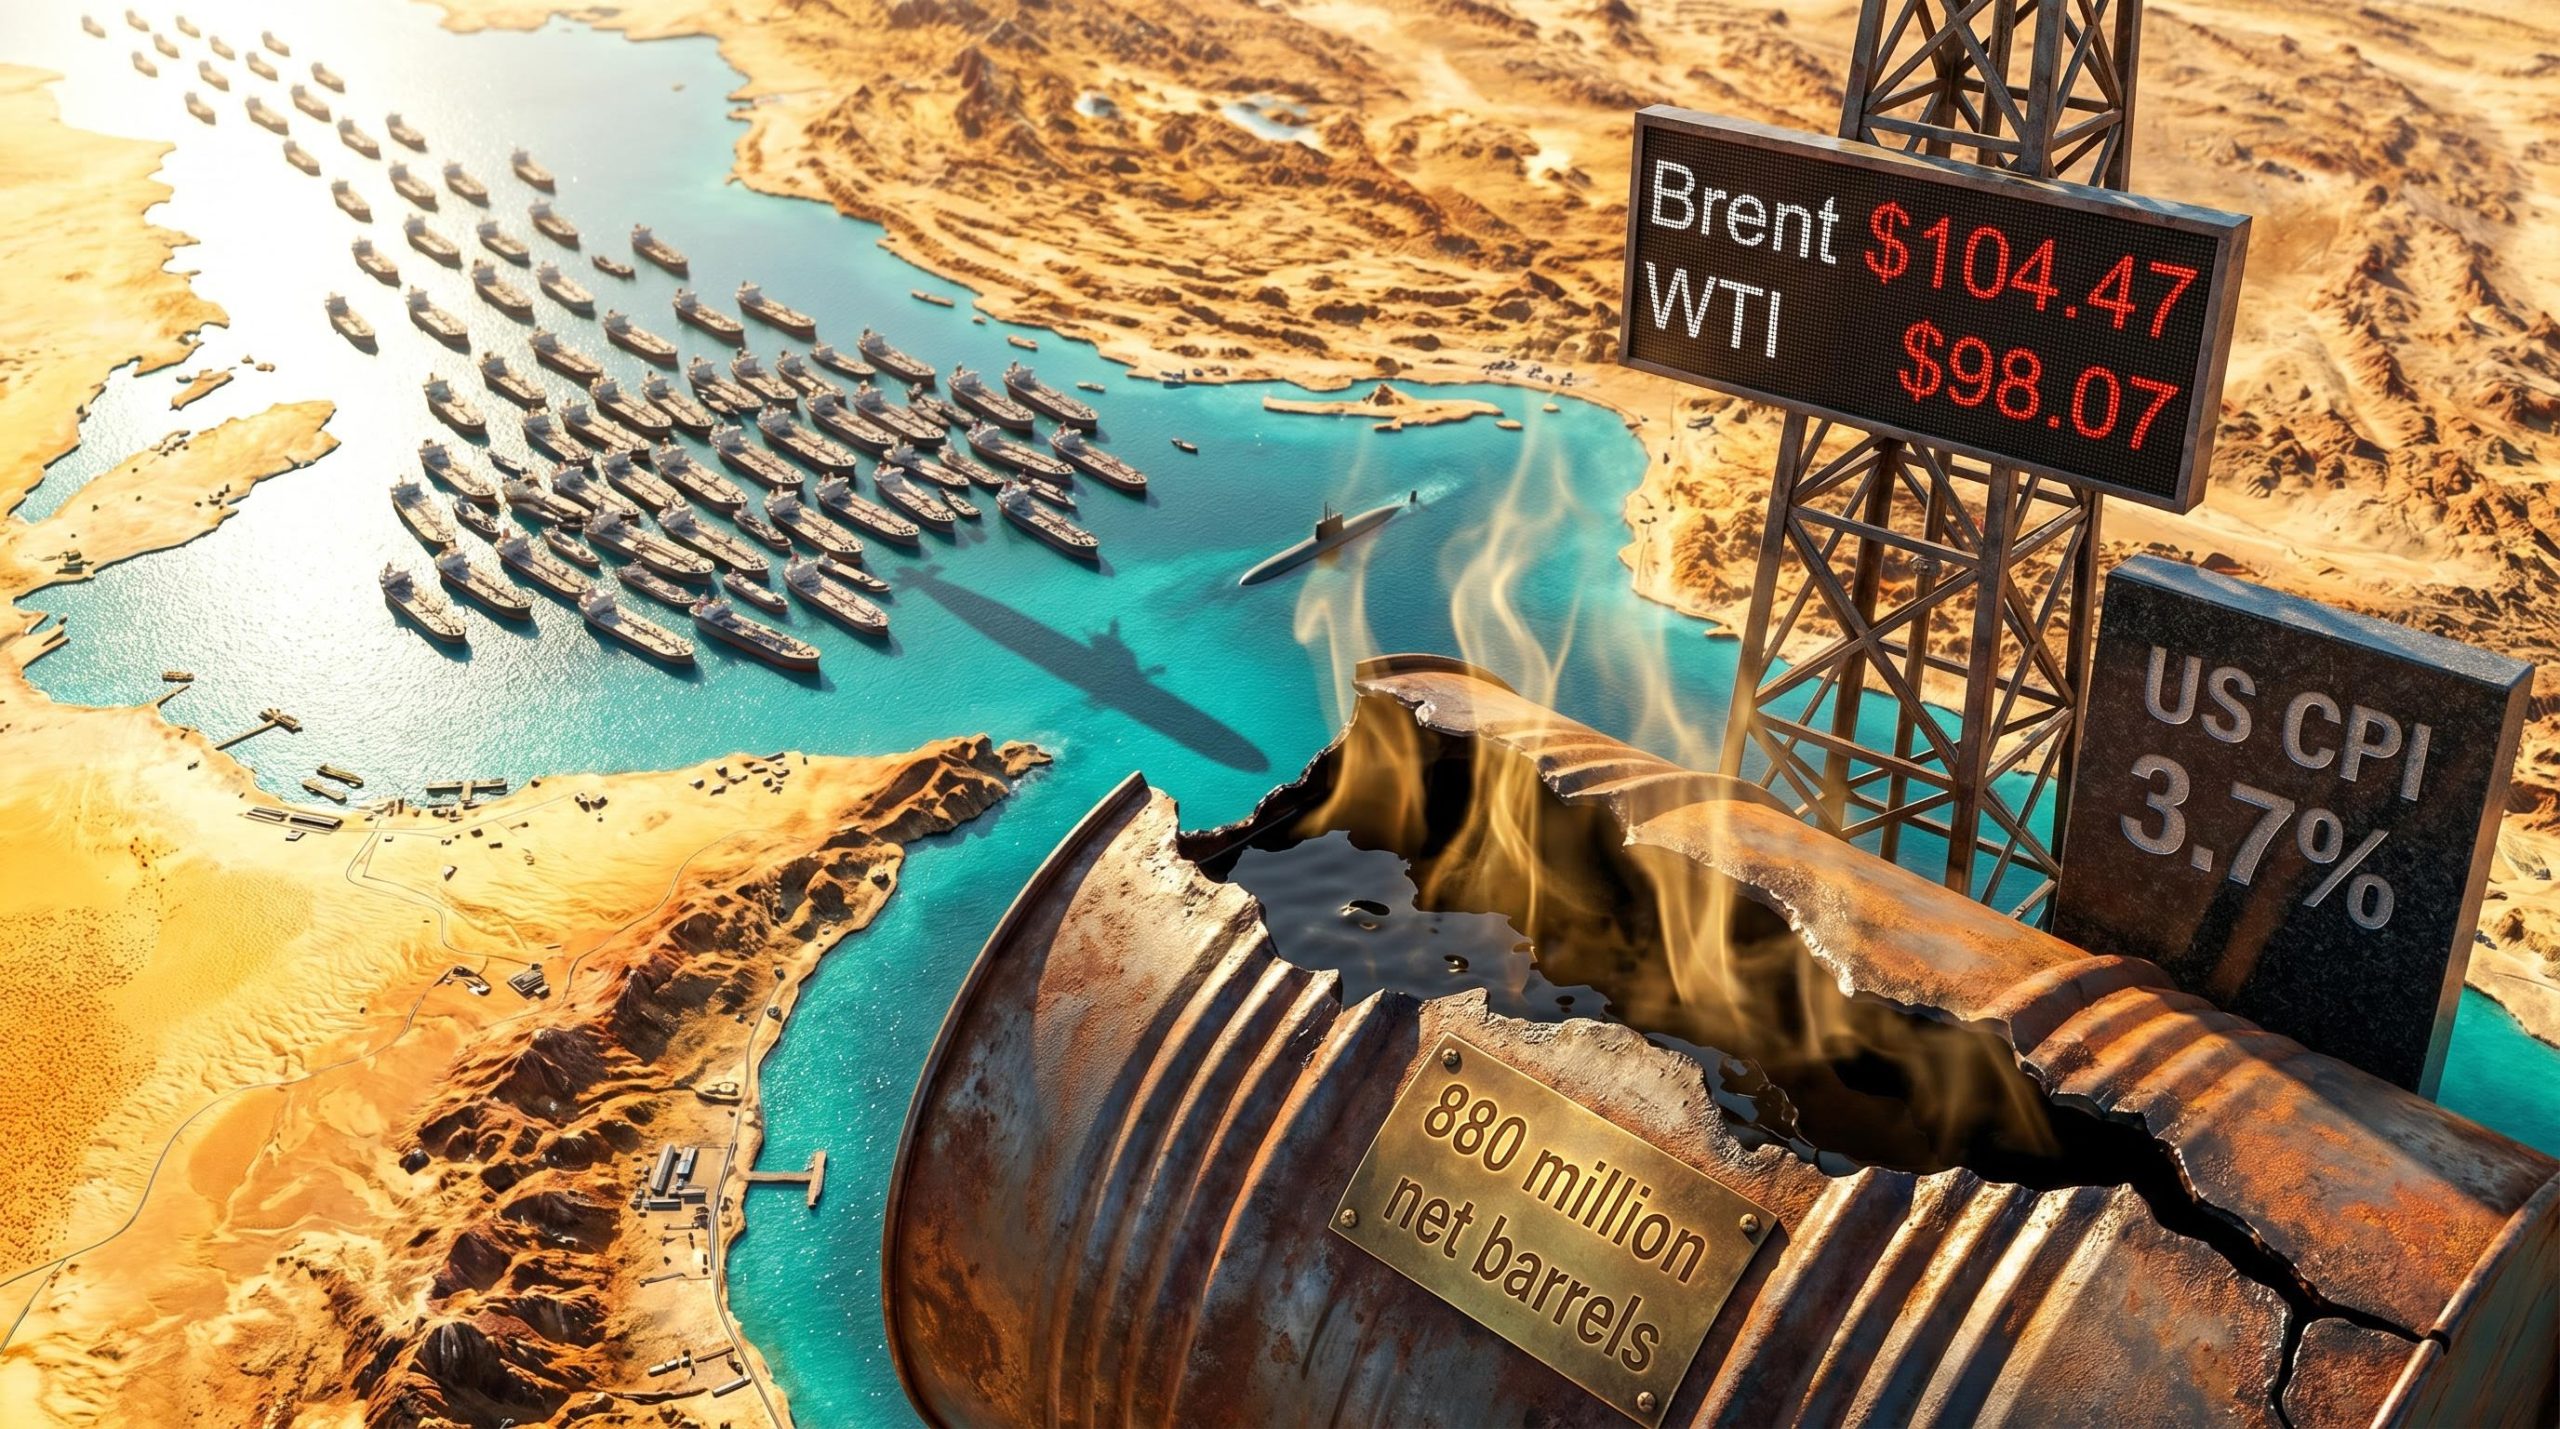
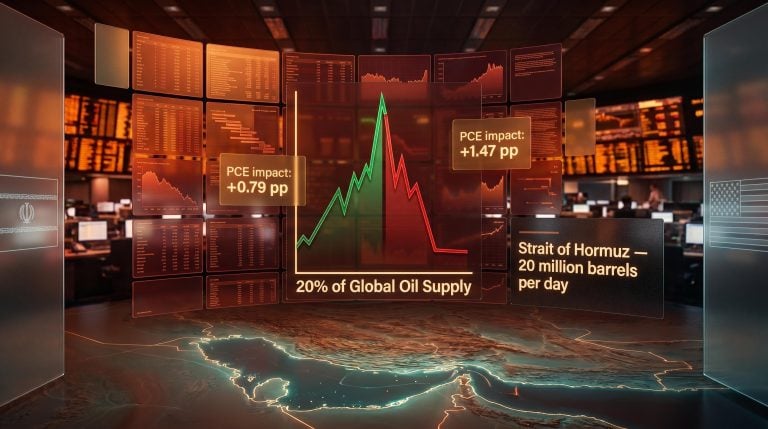
The Strait of Hormuz, a 21-mile-wide waterway that carried roughly 130 ships per day before the crisis began, is now averaging 2 to 5 transits daily. That collapse in traffic has erased an estimated 880 million net barrels of oil supply from global markets, and the crisis is not over.
Oil prices surged nearly 40% from early March to their early-May peak. A US-Iran ceasefire announced on 8 April has failed to restore shipping confidence. Saudi Aramco’s CEO is now warning that market normalisation may not arrive until 2027. With the April US CPI report due 13 May and consensus forecasting a sharp acceleration to 3.7% annually, the connection between a Gulf chokepoint and American household budgets has never been more direct.
This analysis traces the mechanical chain from tanker stranding and submarine deployments to gasoline prices, inflation trajectories, and portfolio risk, giving readers a structured picture of what the oil supply crisis means for the months ahead.
The disruption did not arrive as a single event. It compounded across four stages, each tightening the constraint further:
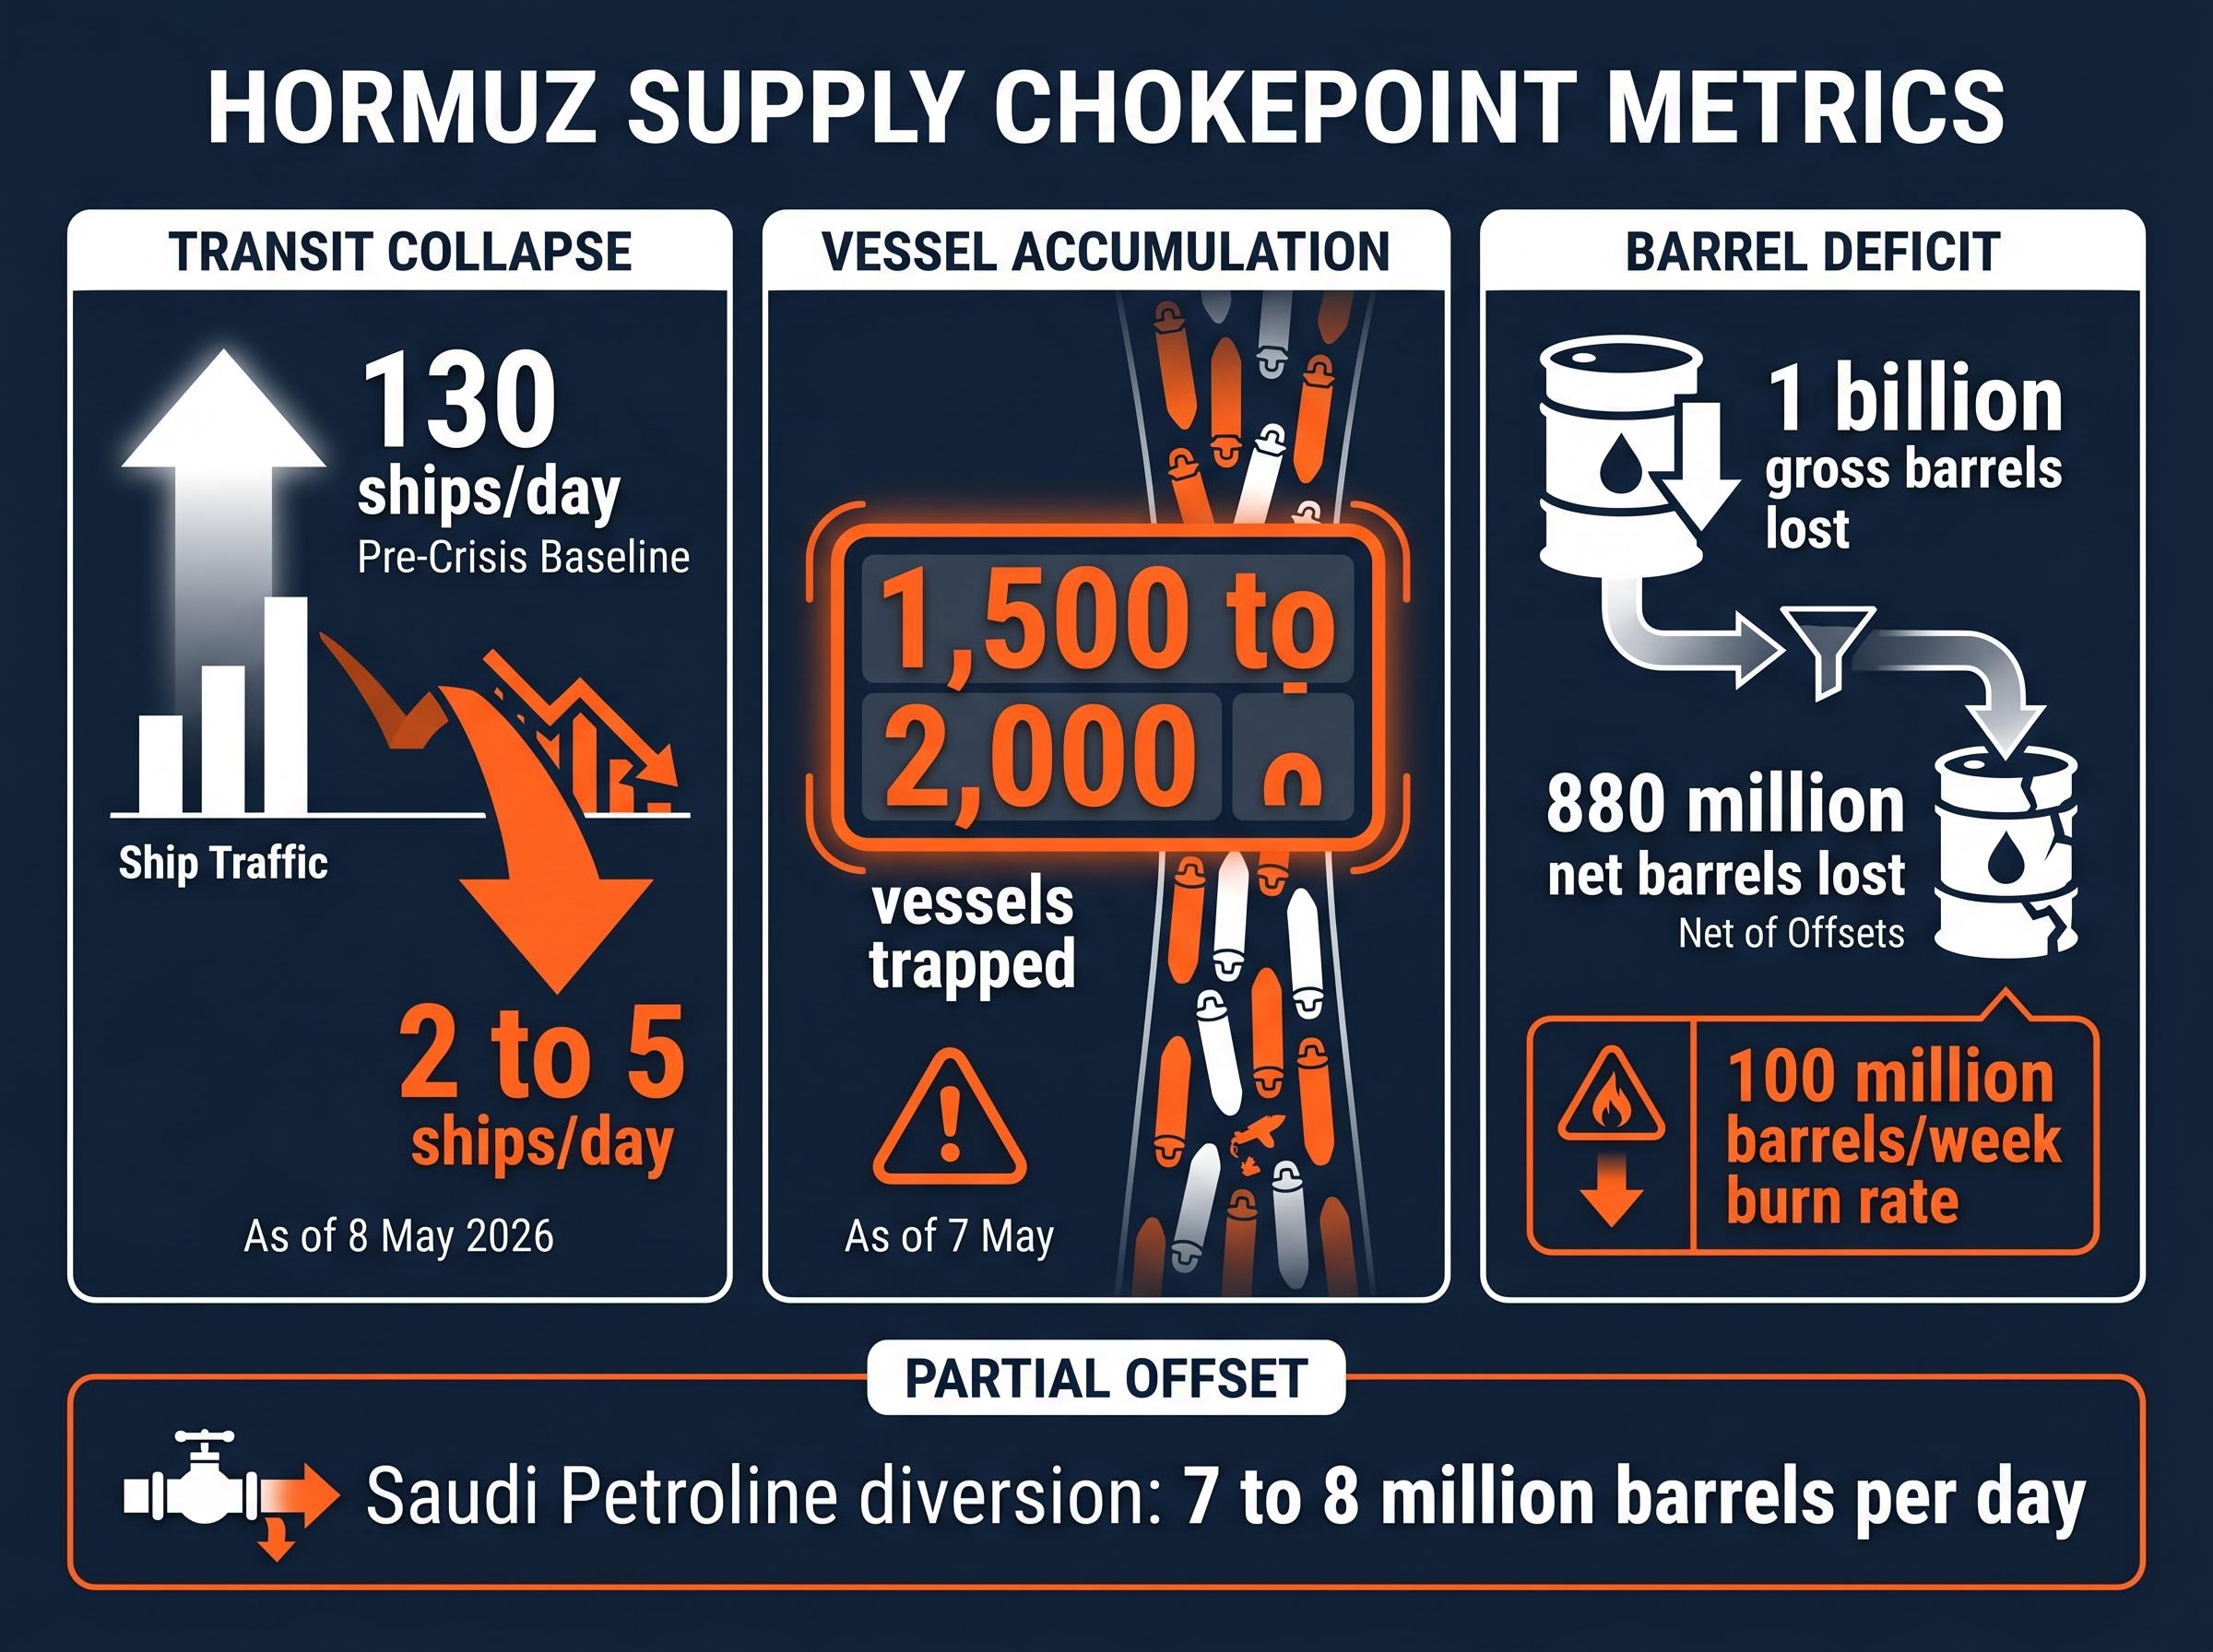
The cumulative result: approximately 1 billion barrels of gross supply lost, offset to roughly 880 million net barrels after accounting for the Petroline diversion. The weekly burn rate stands at approximately 100 million barrels for each week the Strait remains effectively closed.
Saudi Aramco CEO Amin Nasser warned on 10 May 2026 that approximately 1 billion barrels of cumulative supply have been lost, and that recovery could extend into 2027 if shipping remains curtailed beyond a few weeks.
QatarEnergy declared Force Majeure on LNG supply on 4 March 2026, subsequently extending it through mid-June, halting gas liquefaction facilities and compounding the energy supply shock beyond crude oil alone.
Iran’s deployment of at least 16 Ghadir-class midget submarines created a deterrent presence that reshaped the economics of Strait transit. War-risk insurance premiums surged to 3% to 7.5% of vessel value, according to The Guardian and Business Insurance reporting from March 2026. For tankers valued at $200 to $300 million, that translates to per-transit costs of approximately $6 to $9 million.
Even after the 8 April ceasefire announcement, premiums have not meaningfully corrected. Insurers price on actual risk conditions, not diplomatic announcements, and the submarines remain deployed.
The gap between diplomatic signalling and physical reality defines this phase of the crisis. On paper, a ceasefire exists. On the water, nothing has changed.
Consider the divergence:
Iran described US peace terms as completely unacceptable. CNBC reporting attributed to Trump a characterisation of the ceasefire as having approximately a 1% chance of survival, though this claim has not been independently verified.
The triple lock on Hormuz transit, combining US naval blockade operations, Iranian toll enforcement on non-US and non-Israeli vessels, and the near-total withdrawal of commercial war-risk insurance, explains why a ceasefire announcement alone cannot reopen the waterway: each mechanism requires a separate resolution before commercial shipping can resume.
According to CNBC reporting, Trump characterised the ceasefire as having approximately a “1% chance of survival.” This claim should be treated with caution given verification limitations.
For investors pricing a recovery scenario, the signal is in the shipping data, not the diplomatic calendar. The Strait’s reopening is the precondition for oil price normalisation, and that precondition has not been met.
The transmission chain from a closed strait to a higher grocery bill runs through a specific sequence, and understanding it in order clarifies why the April CPI print is expected to accelerate sharply.
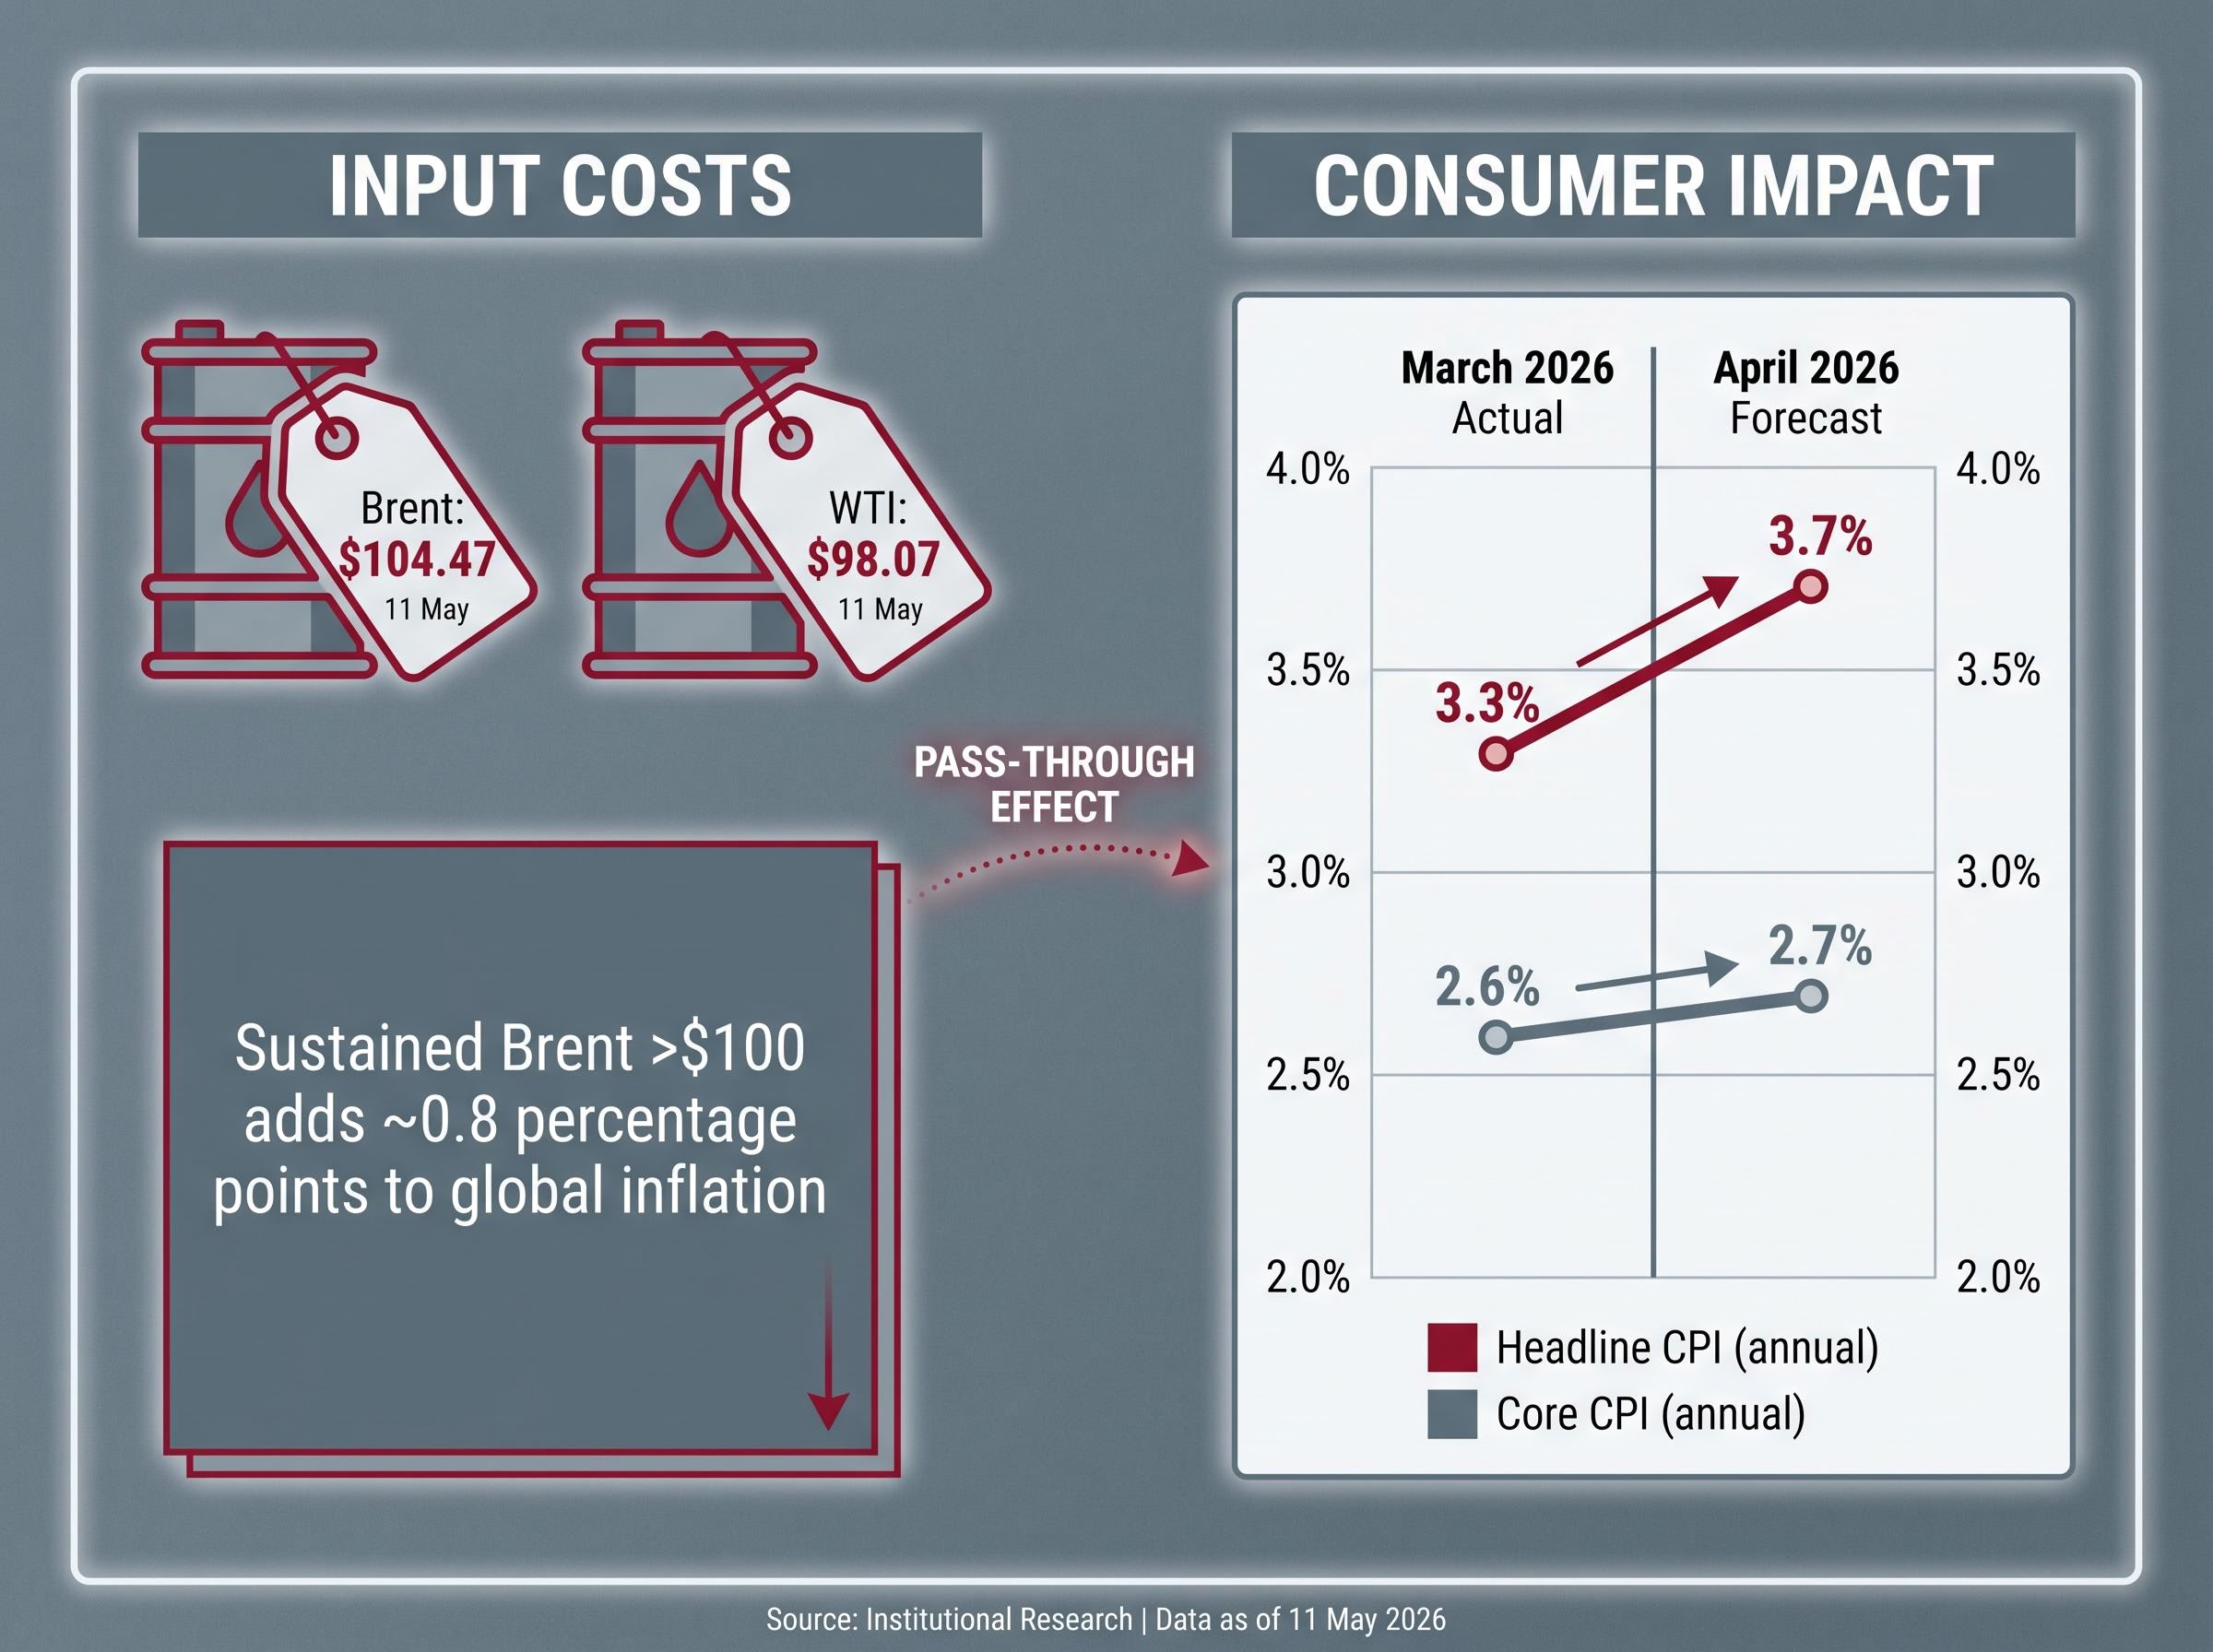
It starts at the refinery. Crude oil at $104.47 per barrel (Brent, 11 May) and $98.07 (WTI) feeds into refinery input costs, which set the price of gasoline, diesel, and jet fuel. Those fuel costs then cascade into freight surcharges on every truck, ship, and aircraft moving goods across the US economy. Gasoline prices hit consumers directly at the pump. Jet fuel lifts airfares. Diesel raises the delivered cost of food, manufactured goods, and materials.
Analysts estimate that Brent crude sustained above $100 per barrel adds approximately 0.8 percentage points to global inflation. The consensus forecast for April 2026 US CPI reflects this pass-through: 0.6% month-on-month, lifting the annual rate to 3.7% from 3.3% in March. Core CPI (which excludes food and energy) is projected at 0.3% month-on-month, pushing the annual core figure to 2.7% from 2.6%.
The mechanism by which inflation erodes purchasing power is not linear: a 3.7% annual headline rate compresses real returns on fixed income, raises the cost of borrowing, and reduces household discretionary spending simultaneously, creating compounding pressure that outlasts the energy shock that triggered it.
Gasoline has been identified as the primary driver of the April acceleration. Airfares represent an upside risk, with the International Air Transport Association (IATA) warning that jet fuel supply recovery could take months even after the Strait reopens.
| CPI Component | March 2026 Actual | April 2026 Forecast | Key Driver |
|---|---|---|---|
| Headline CPI (annual) | 3.3% | 3.7% | Energy, gasoline |
| Core CPI (annual) | 2.6% | 2.7% | Services, shelter |
| Energy | Elevated | Sharp acceleration | Crude oil pass-through |
| Food | Moderate | Rising | Fertiliser costs, freight |
| Shelter | Sticky | Stable | Lagged rent measures |
| Airfare | Moderate | Upside risk | Jet fuel surge |
QatarEnergy’s Force Majeure on LNG, active from 4 March through mid-June 2026, has disrupted ammonia and urea production inputs. These chemicals are foundational to fertiliser manufacturing, meaning the Gulf closure reaches agricultural commodity prices through a second, slower-moving channel.
Panic buying in urea and fertiliser markets has been documented as a downstream consequence of the disruption. This secondary inflationary pressure adds persistence to food price inflation beyond the direct gasoline shock, and it will take longer to unwind even once energy supply begins to normalise.
The policy response has been substantial in absolute terms. In relative terms, it was designed for a different type of crisis.
In March 2026, the International Energy Agency (IEA) coordinated an emergency release totalling 400 million barrels across member nations, including 172 million barrels from the US Strategic Petroleum Reserve (SPR). Saudi Arabia activated its east-west Petroline at approximately 7 to 8 million barrels per day. The White House has reportedly considered suspending the federal gasoline tax as a demand-side measure, according to Goldman Sachs reporting, though no implementation had been confirmed as of 11 May.
The structural mismatch is straightforward. The Strait closure burns through approximately 100 million barrels per week of supply deficit. The entire 400-million-barrel IEA release covers roughly four weeks.
The IEA coordinated emergency release of 400 million barrels, described by the agency as responding to the largest supply disruption in the history of the global oil market, was calibrated against a disruption scale that existing strategic reserve frameworks had never been designed to absorb at full duration.
The IEA characterised the Hormuz disruption as “the largest supply disruption in the history of the global oil market.”
SPR releases are engineered to bridge supply gaps measured in weeks. The Strait of Hormuz has been effectively closed for over two months. The mismatch explains why oil prices remain approximately 30% above pre-crisis levels despite government action.
High oil prices are simultaneously generating windfall revenue potential and destroying profitability across different segments of the energy complex. The paradox is visible in the Q1 2026 earnings season.
ExxonMobil reported Q1 2026 profit of approximately $4.2 billion, a decline despite elevated benchmark prices. The issue: disrupted shipments reduced actual volumes reaching market, meaning that the price on screen did not translate to revenue in hand. Chevron reported similar profit declines. Both companies projected Q2 gains if prices remain elevated and logistics partially normalise, but that projection is conditional on Strait conditions, not guaranteed.
ExxonMobil’s CEO signalled “more to come” on price spikes, per CNBC and Bloomberg reporting from 1 May 2026.
Standard oil-price-to-earnings models assume that higher benchmark prices lift upstream revenue proportionally. The Hormuz crisis breaks that assumption. Disrupted shipment volumes suppress realised production revenue even as Brent sits above $100. The volume-price divergence is the defining feature of this earnings cycle for integrated oil majors.
The rate environment compounds the pressure across sectors. Goldman Sachs now projects the first Federal Reserve rate cut at December 2026 (25 basis points), one quarter later than prior forecasts. Bank of America has pushed its projection to July 2027, from a prior September 2026 estimate. IATA warned in April 2026 that jet fuel recovery could take months post-reopening due to refining capacity constraints. McDonald’s flagged consumer spending pressure from gasoline costs in recent commentary.
The jet fuel supply crisis building toward June and July 2026 adds a second-order pressure point beyond crude benchmarks: tanker loadings for jet fuel collapsed 50% week on week in early May 2026, and ConocoPhillips warned that import-dependent nations could face critical shortfalls before mid-summer, meaning the airline sector’s cost exposure extends well beyond what elevated Brent prices alone would imply.
| Sector | Q1 2026 Impact | Forward Outlook | Key Risk |
|---|---|---|---|
| Oil Majors (Upstream) | Profit declines despite high prices | Q2 gains if logistics improve | Volume-price divergence persists |
| Airlines | Jet fuel cost surge | Capacity constraints, surcharges | Months-long fuel supply lag |
| Freight Operators | Fuel surcharges, route disruption | Elevated operating costs | Extended rerouting timelines |
| Consumer Discretionary | Gasoline-driven spending pressure | Margin compression | Higher-for-longer rate environment |
Two expert assessments anchor the recovery timeline. Supply chain specialist David Warrick stated on 8 May 2026 that even from an immediate ceasefire, normalisation would take “pretty much the rest of the year.” Saudi Aramco CEO Amin Nasser warned on 10 May that recovery could extend into 2027 if shipping remains curtailed beyond a few weeks.
David Warrick, supply chain expert (8 May 2026): “Even if everything ceases right now, it’s still going to take pretty much the rest of the year to normalise from a supply perspective.”
The summer demand season compounds this timeline. Aramco flagged that gasoline and jet fuel inventories risk falling to critically deficient levels precisely as the peak driving and travel period arrives. Brent at $104.47 and WTI at $98.07 (as of 11 May) sit approximately 7 to 8% below the early-May peak but remain roughly 30% above pre-crisis levels.
The inflation and rate trajectory follows directly. With Goldman Sachs pushing the first Fed cut to December 2026 and Bank of America to July 2027, the higher-for-longer rate environment has been extended by an energy shock that shows no signs of self-correcting. Bloomberg consensus places April CPI at 3.5% annually, with the report due 13 May.
For readers wanting to model how the oil shock has rewired rate expectations across the Fed, ECB, and Bank of England simultaneously, our full explainer on the 54% oil surge and central bank repricing walks through Morningstar’s three fixed income scenarios and identifies the single variable — duration of the Hormuz disruption — that determines which outcome materialises for bond portfolios through 2027.
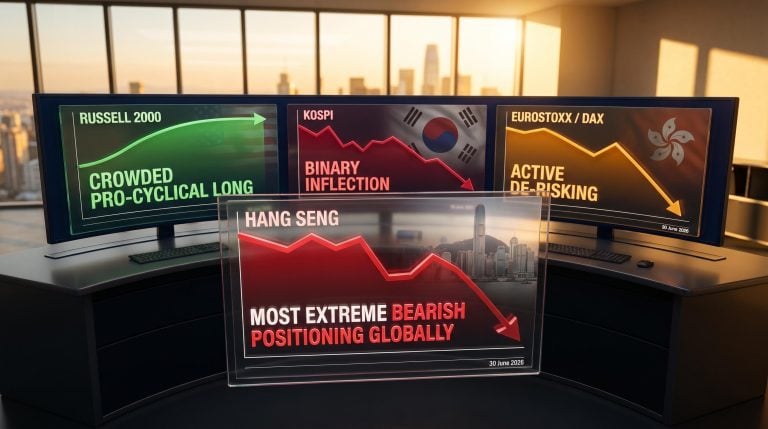
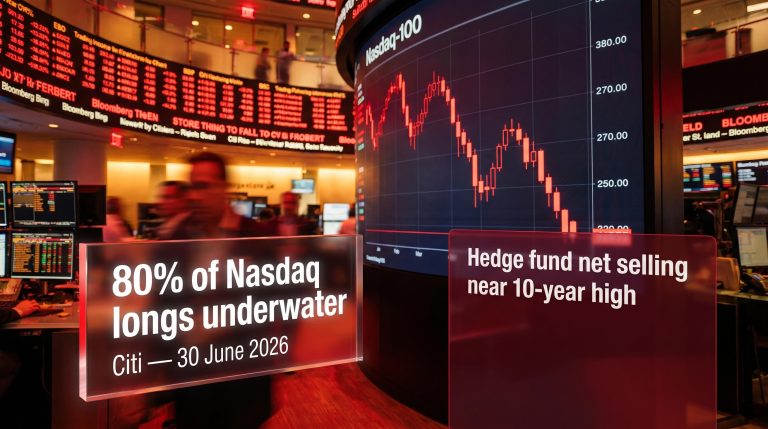
Three portfolio-relevant implications follow from this extended timeline:
The analytical chain from this crisis runs in a single direction: physical chokepoint closure, to insurance-driven shipping paralysis, to inflation transmission through gasoline and fertiliser channels, to corporate earnings distortion, to an extended Fed tightening timeline. Each link reinforces the next, and none has broken.
Readers monitoring for genuine de-escalation should watch three operational signals rather than waiting for diplomatic announcements:
The 880 million net barrels already lost cannot be recovered. The question is whether the weekly deficit of 100 million barrels continues compounding through the summer. The April CPI print on 13 May will confirm the inflation pass-through already visible in futures markets. Mid-June, when the QatarEnergy Force Majeure expires and Aramco’s warning threshold is reached, represents the next structural inflection point.
This article is for informational purposes only and should not be considered financial advice. Investors should conduct their own research and consult with financial professionals before making investment decisions. Past performance does not guarantee future results. Financial projections are subject to market conditions and various risk factors.
The Strait of Hormuz oil supply crisis refers to the near-total collapse of tanker traffic through the world's most critical oil shipping lane, where daily transits fell from approximately 130 ships to just 2 to 5, removing an estimated 880 million net barrels from global supply as of May 2026.
A ceasefire announcement alone cannot reopen the Strait because three separate mechanisms, including US naval blockade operations, Iranian toll enforcement, and the near-total withdrawal of commercial war-risk insurance, each require independent resolution before commercial shipping can safely resume.
Crude oil above $100 per barrel drives up gasoline, diesel, and jet fuel prices, which cascade into freight surcharges across the entire economy; analysts estimate Brent sustained above $100 adds approximately 0.8 percentage points to global inflation, with April 2026 US CPI consensus forecast at 3.7% annually.
Investors should monitor three operational indicators: Strait transit volumes returning toward 30 to 40 ships per day, war-risk insurance premiums declining toward pre-crisis levels, and the lifting of QatarEnergy's Force Majeure on LNG supply, which currently extends through mid-June 2026.
The energy-driven inflation surge has pushed rate cut timelines later, with Goldman Sachs now projecting the first Fed cut at December 2026 and Bank of America extending its projection to July 2027, extending the higher-for-longer rate environment for rate-sensitive sectors.