TSMC Posts Record US$39.6B Quarter Ahead of 16 July Earnings
1 hr ago

Copper breached US$14,000/tonne on the London Metal Exchange on 13 May 2026, the same day BHP told investors it would grow copper production by roughly 5% annually to reach 2 million tonnes by 2035. The two events arrived independently, one from a trading floor, the other from a podium at the Bank of America Global Metals, Mining and Steel Conference, yet they pointed in the same direction: copper’s structural demand story is accelerating, and major capital is moving to meet it. The metal has gained approximately 13% year-to-date despite sharp early-year declines tied to the Iran conflict, and it now trades within reach of its all-time LME high above US$14,500/tonne set in January 2026. What follows explains what is driving the price surge, what BHP’s strategic bet reveals about where institutional capital is flowing, and what the combined signal means for investors weighing copper-linked equity exposure.
LME copper rose 1.2% intraday to US$14,106.50/tonne on 13 May, before settling up 0.6% at US$14,021/tonne. Across the Atlantic, Comex copper futures printed a record of US$6.6455/lb during the same session.
The key price reference points:
Copper has gained approximately 13% year-to-date in 2026, a figure that arrived despite the sharpest early-year selloff the metal had experienced in over a decade, driven by the Iran conflict and its disruption to global shipping lanes.
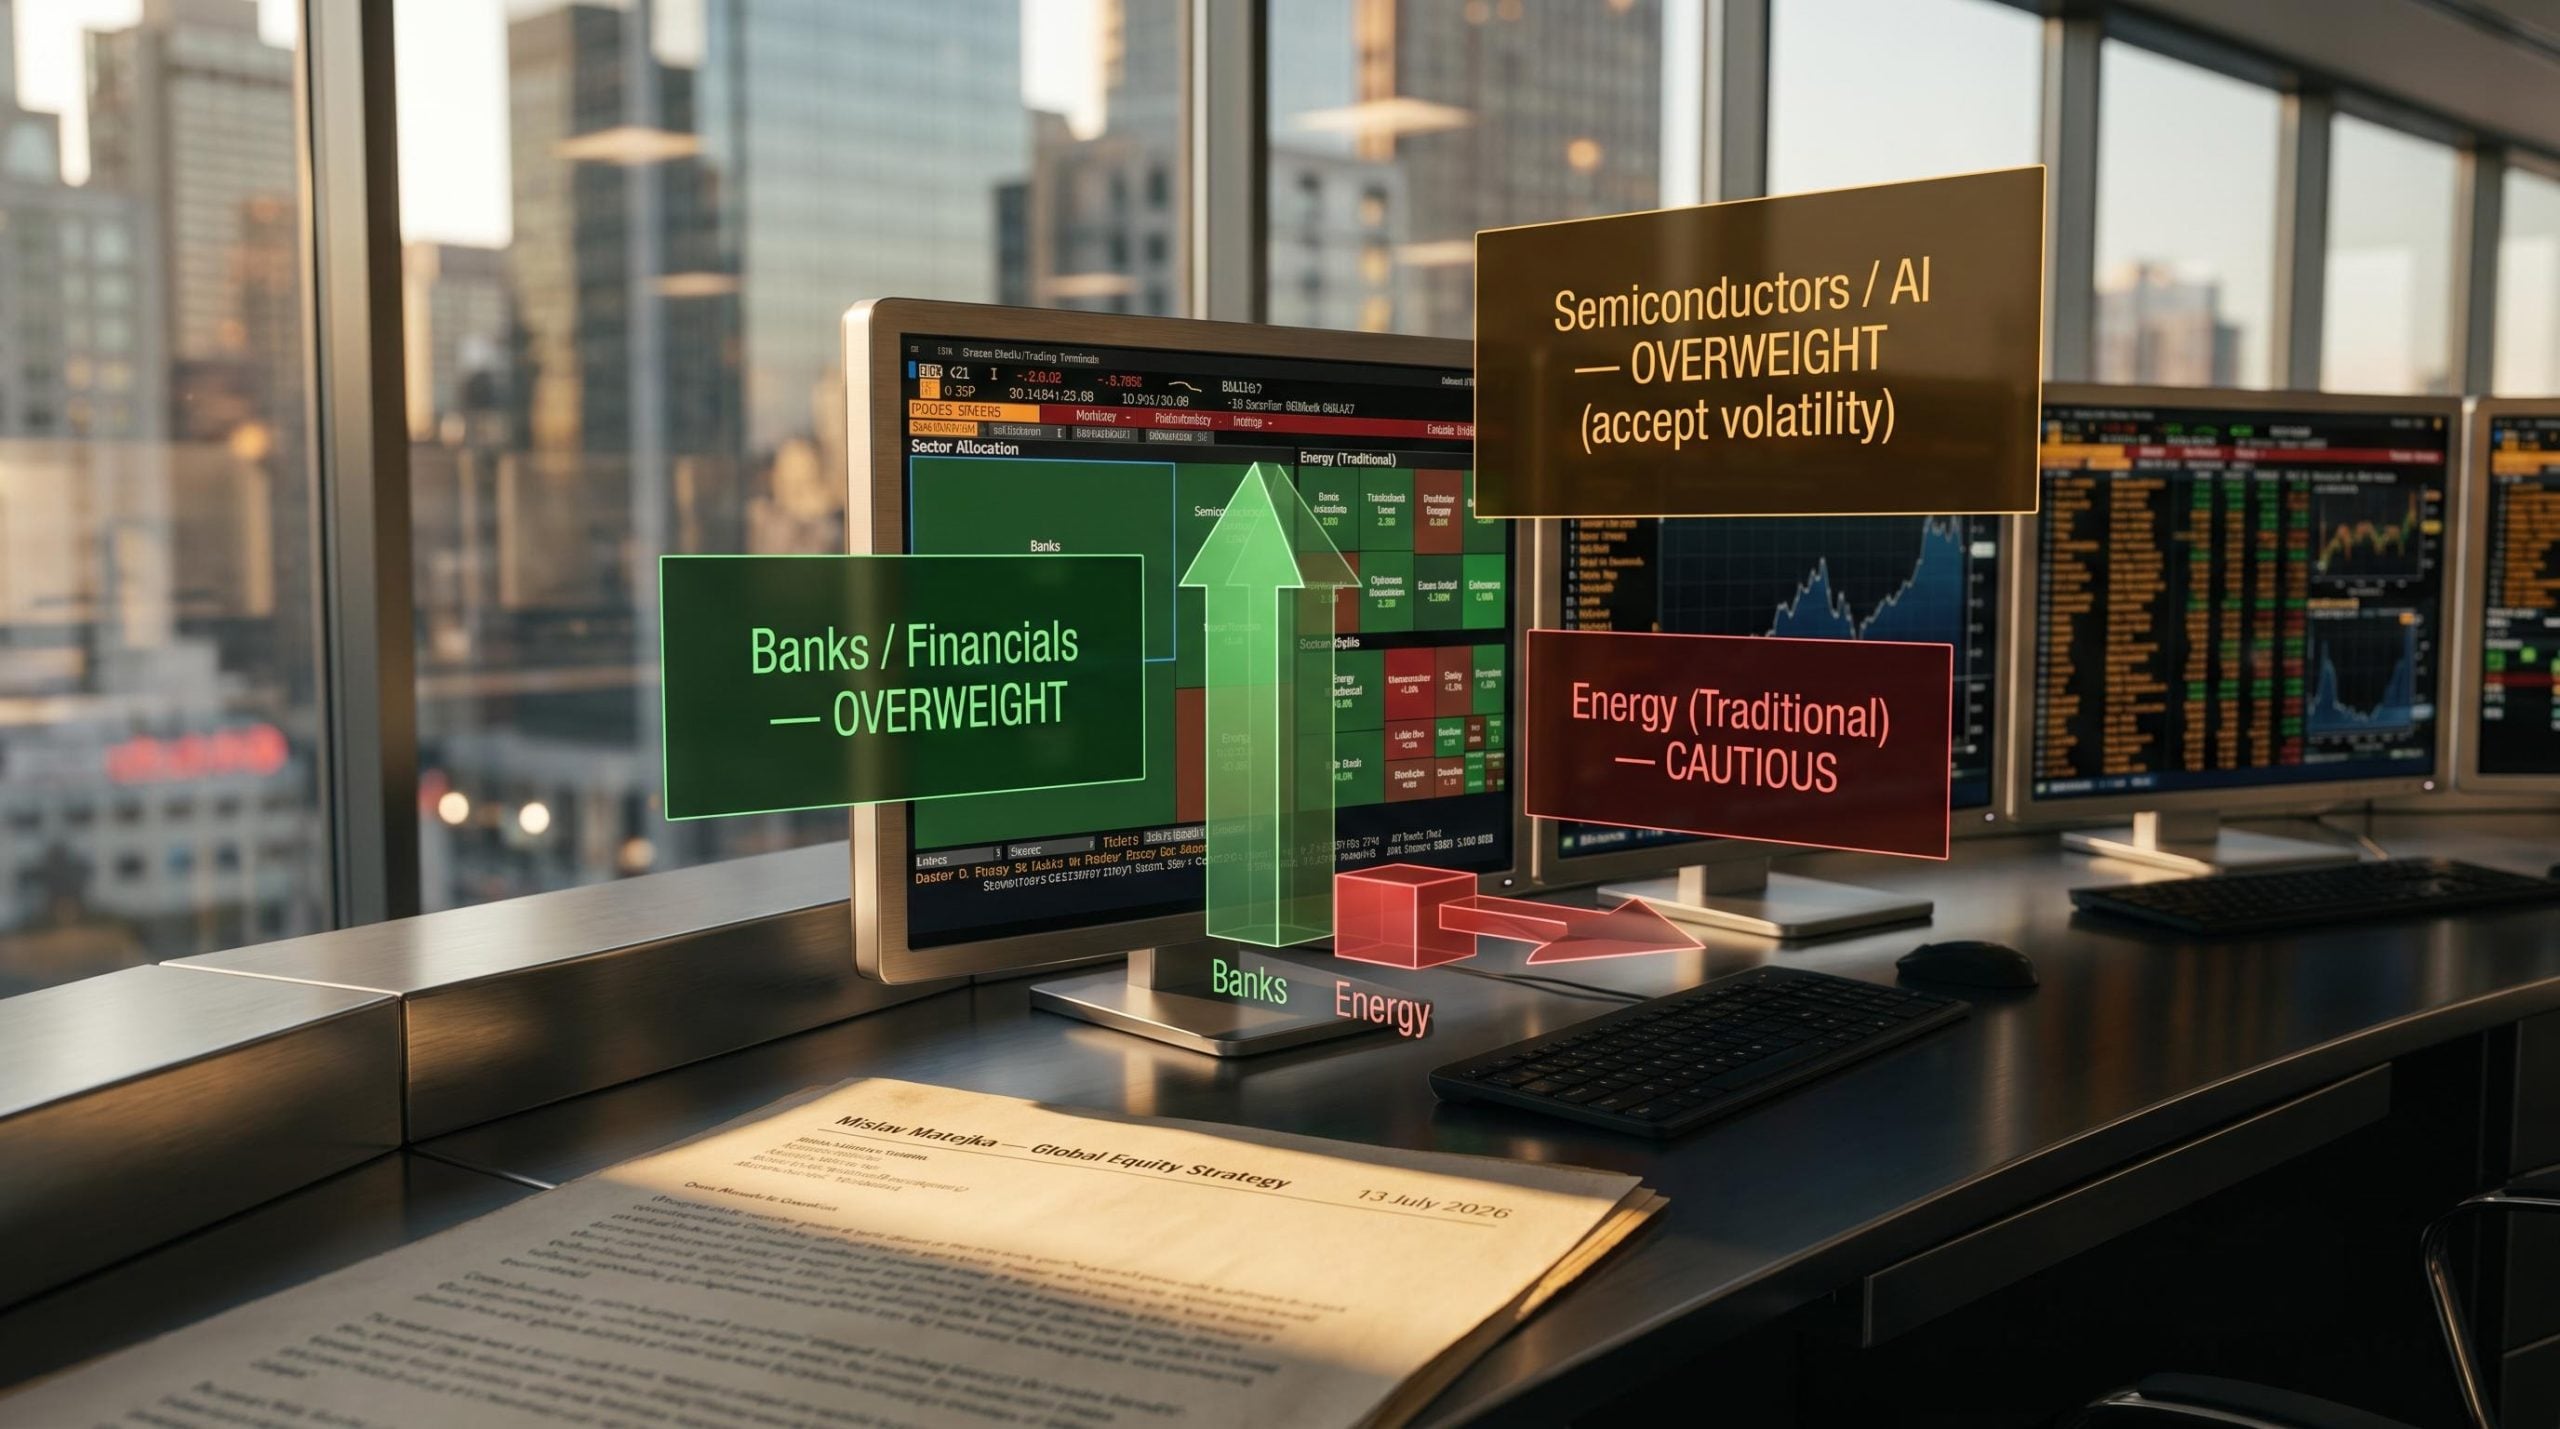
The year-to-date performance reframes what initially appeared to be a volatile, conflict-damaged market into one that has quietly delivered double-digit returns. A growing correlation between copper and US equity markets, particularly AI-related stocks, has reinforced the metal’s relevance beyond traditional industrial demand. Copper’s role as the foundational conductor in electrical wiring and data centre infrastructure has tied its price trajectory to the same capital flows powering technology equities.
The copper-AI linkage also sits at the centre of a broader thesis around materials sector positioning: Bank of America’s Michael Hartnett has argued the sector, at roughly 2% of S&P 500 market capitalisation, represents a structural under-ownership opportunity precisely because the same AI infrastructure spending driving data centre copper demand has been flowing primarily into technology equities rather than the commodity producers that supply the underlying infrastructure.
What the record price does not resolve, however, is the inventory question: global exchange inventories exceeded 1 million tonnes in the same period, a 20-year high driven in part by US tariff front-loading, and that stockpile dynamic complicates any reading of the price signal as a straightforward expression of tightness.
The rally is not a single-factor event. It reflects a compression of demand recovery and supply stress arriving at the same moment, each amplifying the other.
China’s sustained renewable energy investment programme has been the dominant bullish catalyst. Consumption growth driven by solar, wind, and grid infrastructure spending has outweighed near-term inventory concerns and broader macroeconomic uncertainty. Market commentary from the session noted explicitly that the Iran conflict’s drag on global growth expectations was being outweighed by the demand-supply dynamic.
On the supply side, multiple constraints have tightened simultaneously. A squeeze on Middle Eastern sulfur availability has affected copper processing circuits, while mine disruptions in Africa and Indonesia have compounded the pressure.
Codelco, the world’s largest copper producer, reported full-year 2025 production of 1.332 million tonnes. Its March 2026 monthly output of 91,000 tonnes represented the fourth-lowest monthly figure on record, undermining earlier narratives of a sustained production recovery.
The combination of rising demand and weakening supply has given the price rally a structural foundation that pure speculative momentum would lack.
Copper is the primary electrical conductor used in renewable energy systems, electric vehicle (EV) wiring and motors, power grid infrastructure, and the rapidly expanding network of AI data centres. Every solar panel, wind turbine, EV charging station, and server rack requires copper wiring to function. As global economies electrify, the volume of copper required per unit of economic output is rising rather than falling.
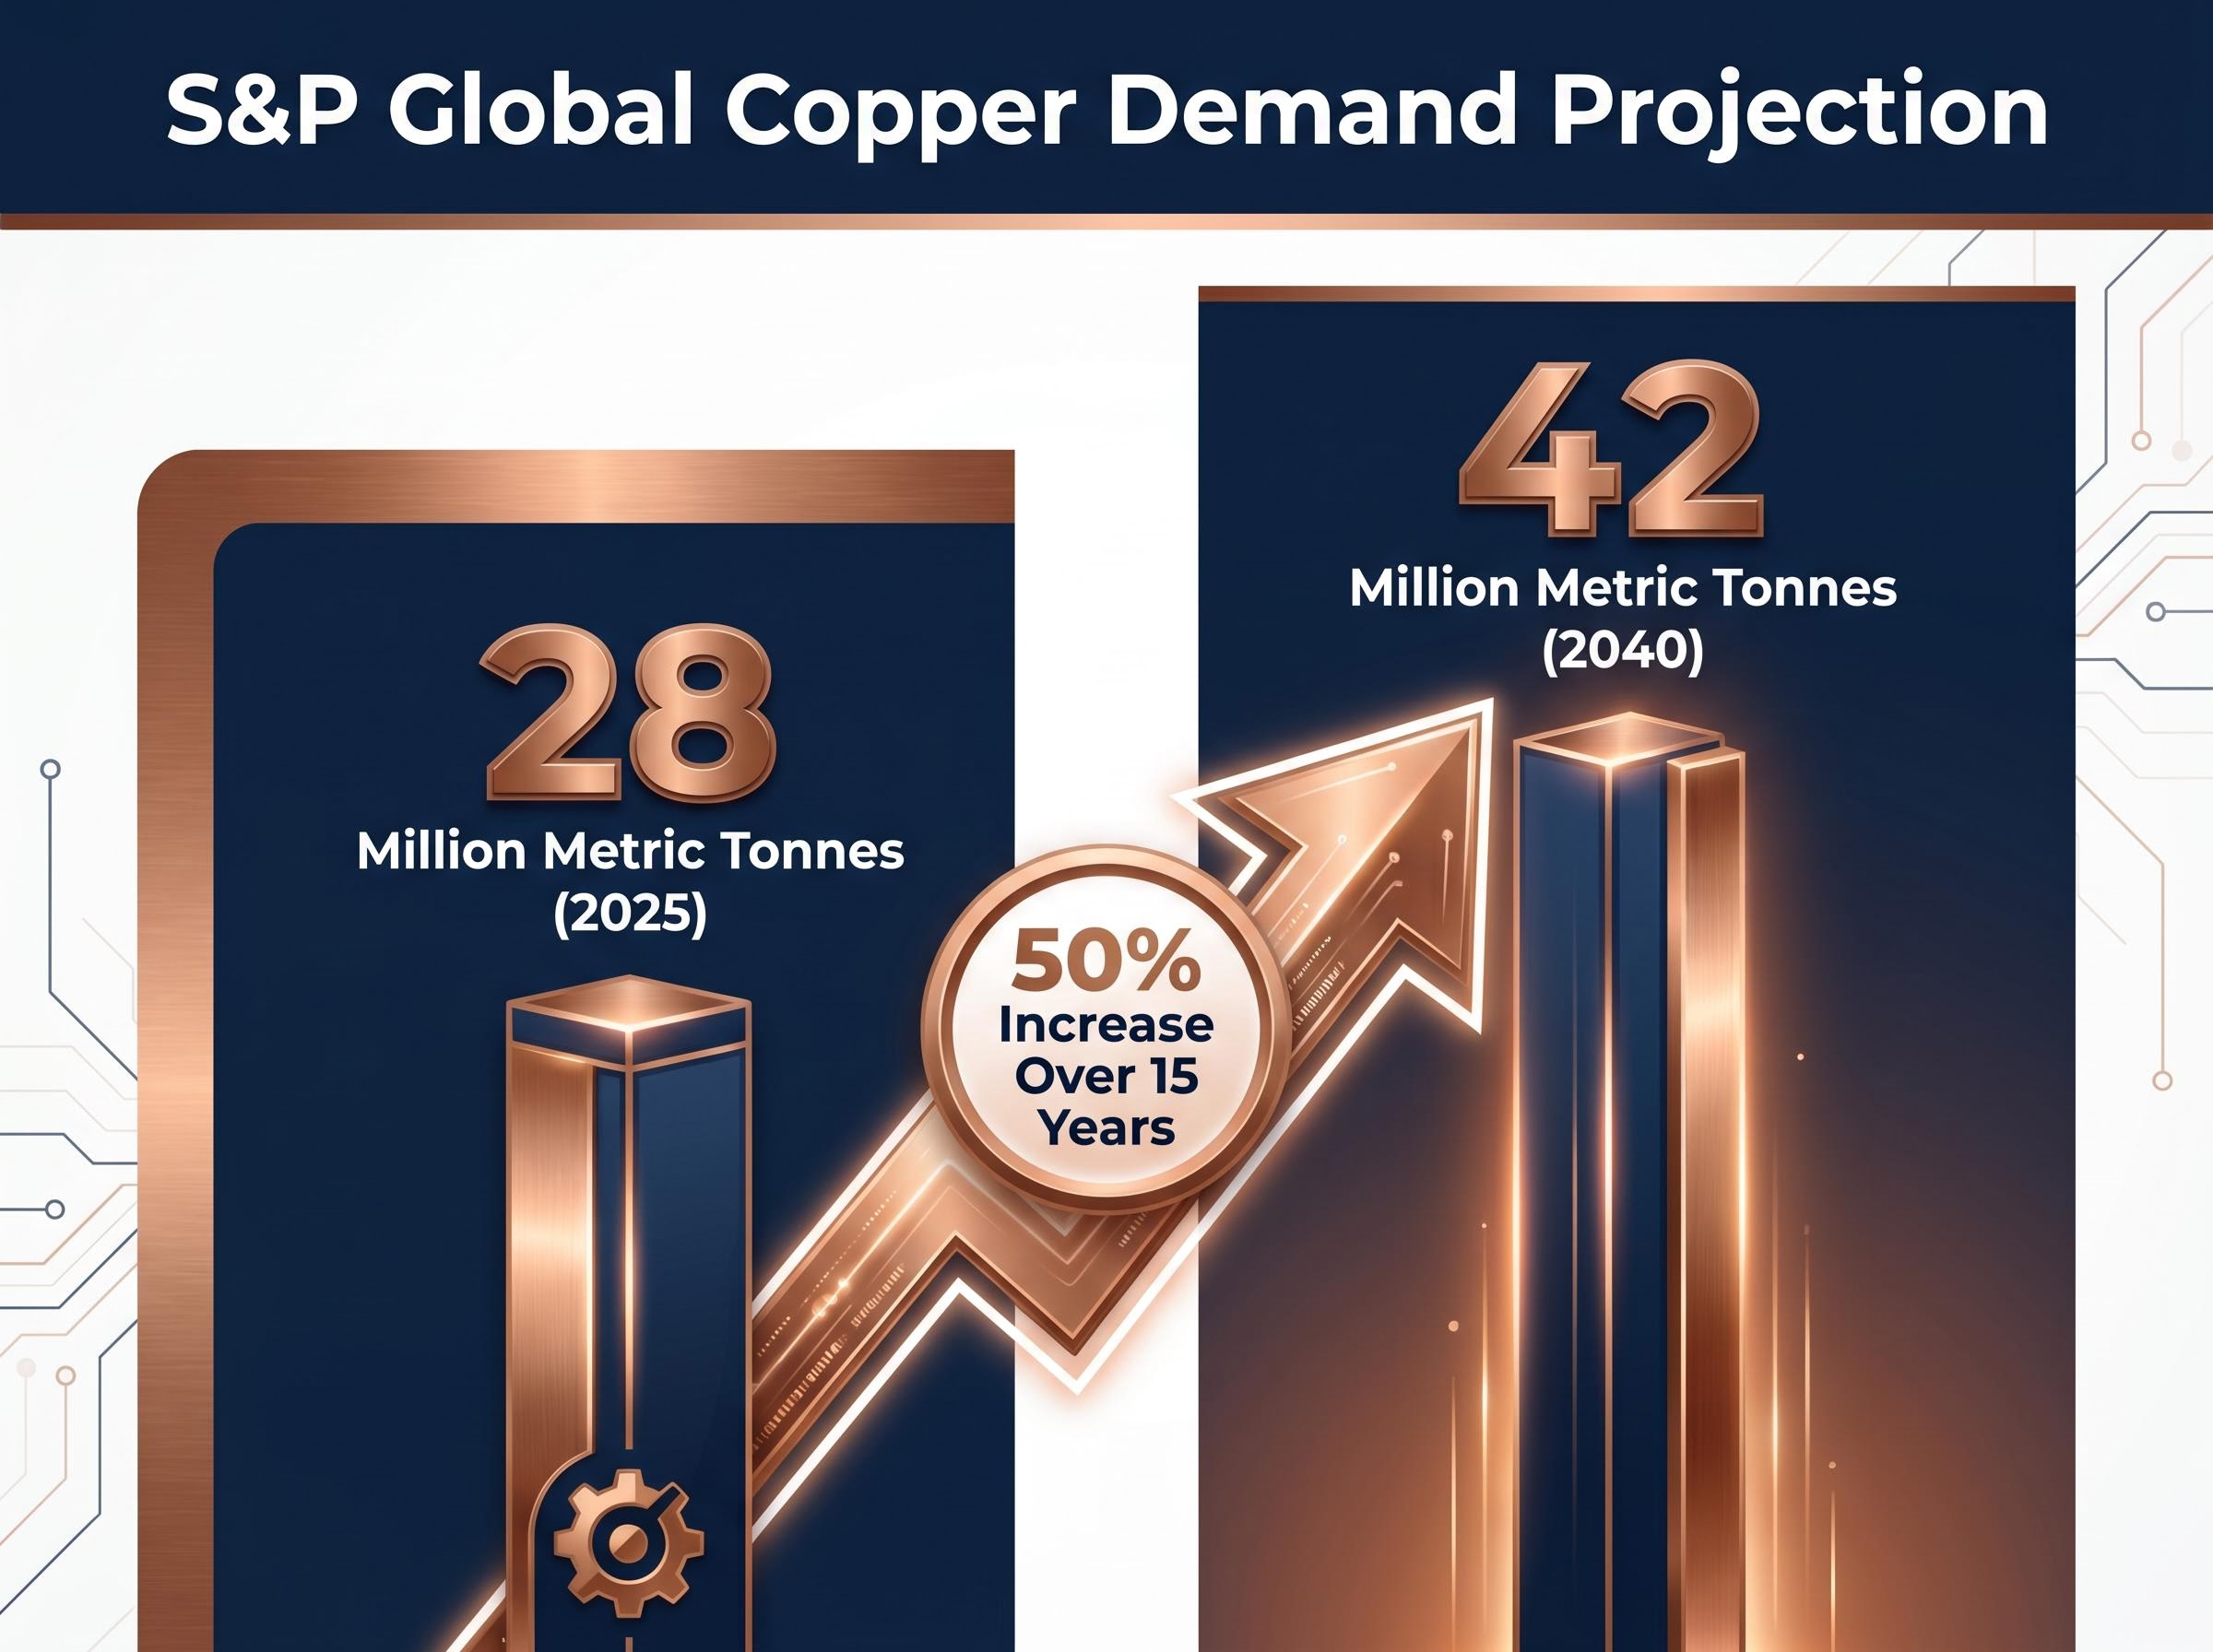
S&P Global projects global copper demand to grow from approximately 28 million metric tonnes in 2025 to 42 million metric tonnes by 2040, a 50% increase over 15 years. That projection sits alongside a supply pipeline that is not expanding at an equivalent pace.
| Demand Driver | Current Role | Growth Trajectory | Key Infrastructure |
|---|---|---|---|
| Renewables | Solar, wind generation systems | Accelerating globally | Panels, turbines, inverters |
| Electric Vehicles | Motors, wiring, charging | Rising with EV adoption rates | Battery packs, chargers, grids |
| AI Data Centres | Power delivery, cooling | Expanding with AI compute demand | Server racks, power systems |
| Grid Electrification | Transmission, distribution | Growing in emerging markets | Cables, transformers, substations |
The International Copper Study Group (ICSG) forecast a copper market surplus of approximately 467,000 tonnes for 2024, providing near-term context. Against the scale of the long-term demand trajectory, that surplus represents a temporary condition rather than a structural feature of the market.
BHP presented its copper strategy at the Bank of America Global Metals, Mining and Steel Conference, framing the metal as the centrepiece of a decade-long capital allocation pivot.
The headline commitments:
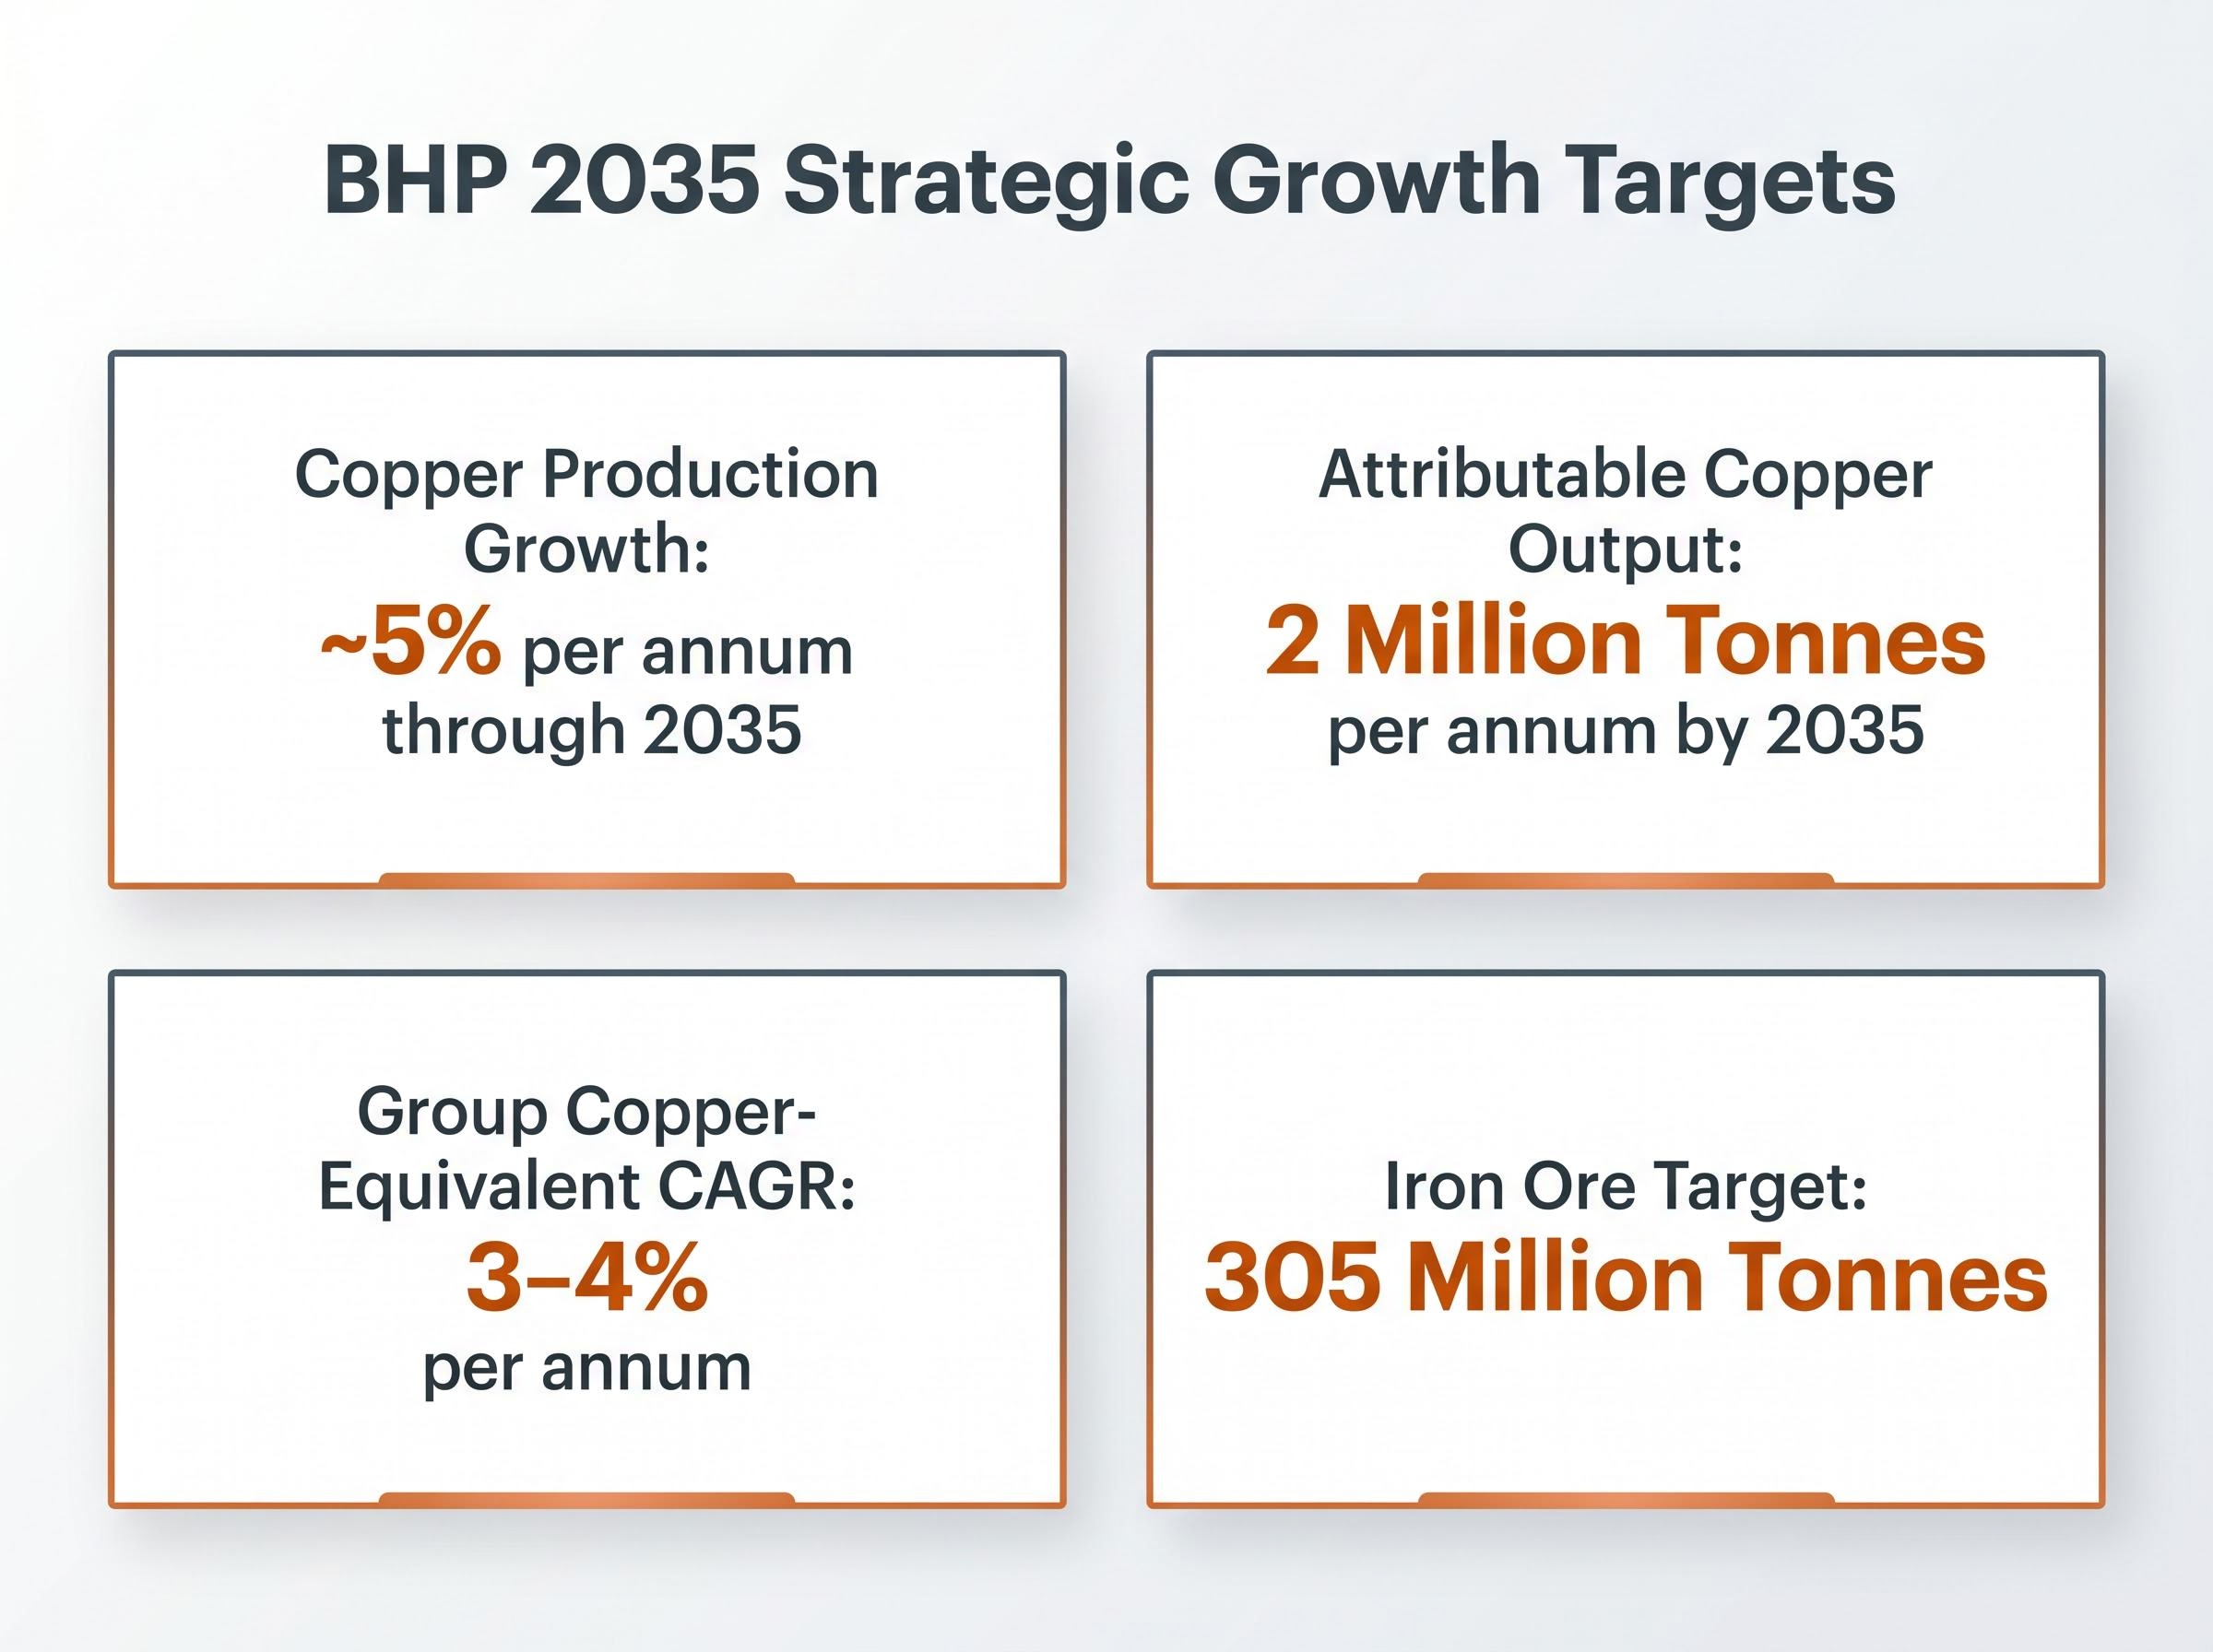
BHP aims to reach attributable copper output of 2 million tonnes per annum by 2035, representing one of the largest single-producer copper growth commitments announced in recent years.
The broader capital allocation picture includes a remaining A$4 billion in non-core infrastructure monetisation (from a total programme of approximately A$10 billion), suggesting a company actively reallocating capital from legacy assets toward copper-weighted growth.
A CEO transition scheduled for 1 July 2026 accompanies the strategy update, with the incoming leadership team emphasising performance acceleration alongside a zero-fatalities ambition. The transition provides governance context for the long-term targets, though the strategic direction itself was presented as a continuation of positioning already underway.
The scale of BHP’s commitment, a decade-long growth trajectory targeting a doubling of copper output, functions as both a corporate strategy signal and a supply-side constraint signal. Capital locked into projects with 2035 delivery horizons will not relieve near-term tightness.
The same day copper cleared US$14,000, US April 2026 Consumer Price Index (CPI) data complicated the bullish narrative. Core CPI came in at 2.8% annualised, above the 2.7% forecast. Headline CPI printed at 3.8% annualised, also above the 3.7% consensus.
Key macro risk factors:
Elevated interest rates are historically a headwind for commodity prices. A stronger US dollar reduces the purchasing power of non-dollar buyers, while tighter financial conditions dampen industrial demand expectations. The tension between the structural copper bull case and the near-term rate environment is real, and it has not been resolved by the price milestone.
The Fed rate path is not the only oil-related pressure on copper’s cost structure: Brent crude at approximately US$106-107 per barrel, sustained by the Hormuz closure removing an estimated 12-13 million barrels per day from global seaborne flows, is transmitting directly into mining input costs through diesel and energy pricing, a channel that compresses margins even as headline copper prices remain elevated.
The convergence of a live price milestone and a major producer’s decade-long strategic commitment does not, by itself, constitute an investment thesis. It does, however, reveal the direction of institutional conviction.
S&P Global’s demand projection, from 28 million to 42 million metric tonnes by 2040, sits alongside BHP’s own 2035 target of 2 million tonnes per annum. The ICSG’s 2024 surplus of approximately 467,000 tonnes suggests near-term oversupply may persist before structural deficit conditions emerge. The timing gap between present conditions and long-term projections is where investment risk and opportunity coexist.
S&P Global copper demand research projects a supply deficit approaching 10 million metric tonnes by 2040, a gap that dwarfs any single producer’s growth commitment and underscores why institutional capital is reweighting toward copper-linked assets ahead of that structural inflection.
Three variables will shape the copper market in the months ahead:
Investors tracking copper-linked equities are better served by monitoring these structural variables than by reacting to any single session’s price action.
For investors weighing whether BHP’s decade-long commitment reflects genuine structural conviction or a crowded institutional trade, our full explainer on the commodity supercycle thesis examines the ETF capital flows, valuation multiples, and credible failure conditions, including China demand risk and technology substitution, that determine whether the current cycle validates or disappoints the bull case.
This article is for informational purposes only and should not be considered financial advice. Investors should conduct their own research and consult with financial professionals before making investment decisions. Past performance does not guarantee future results. Financial projections are subject to market conditions and various risk factors.
The copper market outlook is broadly bullish, driven by accelerating demand from renewable energy, electric vehicles, and AI data centres, with S&P Global projecting demand to grow from 28 million metric tonnes in 2025 to 42 million metric tonnes by 2040. Near-term, a surplus of around 467,000 tonnes exists, but structural deficit conditions are expected to emerge as the decade progresses.
LME copper cleared US$14,000 per tonne on 13 May 2026, supported by strong Chinese renewable energy demand, supply disruptions in Africa and Indonesia, and historically weak output from Codelco, the world's largest copper producer. Comex copper futures also printed a record of US$6.6455 per lb during the same session.
BHP announced a target of 2 million tonnes of attributable copper output per annum by 2035, representing approximately 5% annual production growth, making it one of the largest single-producer copper growth commitments in recent years. This signals strong institutional conviction in the long-term copper demand story and also confirms that new supply capacity will take years to reach the market.
Key risks include persistently high US inflation, with April 2026 CPI above forecasts raising the probability of a Federal Reserve rate hike to around 29.9% by year-end, a stronger US dollar that pressures commodity prices, and elevated oil costs increasing mining input expenses. J.P. Morgan has also modelled a copper downside scenario of US$11,100-11,200 per tonne if bearish macroeconomic conditions materialise.
AI data centres require substantial copper for power delivery, cooling systems, and server rack wiring, creating a direct link between rising AI compute investment and copper consumption. This connection has contributed to a growing correlation between copper prices and AI-related equity markets, expanding the metal's relevance beyond traditional industrial demand.