Iran Walks Out of Swiss Talks, Sending US Stock Futures Lower
47 mins ago
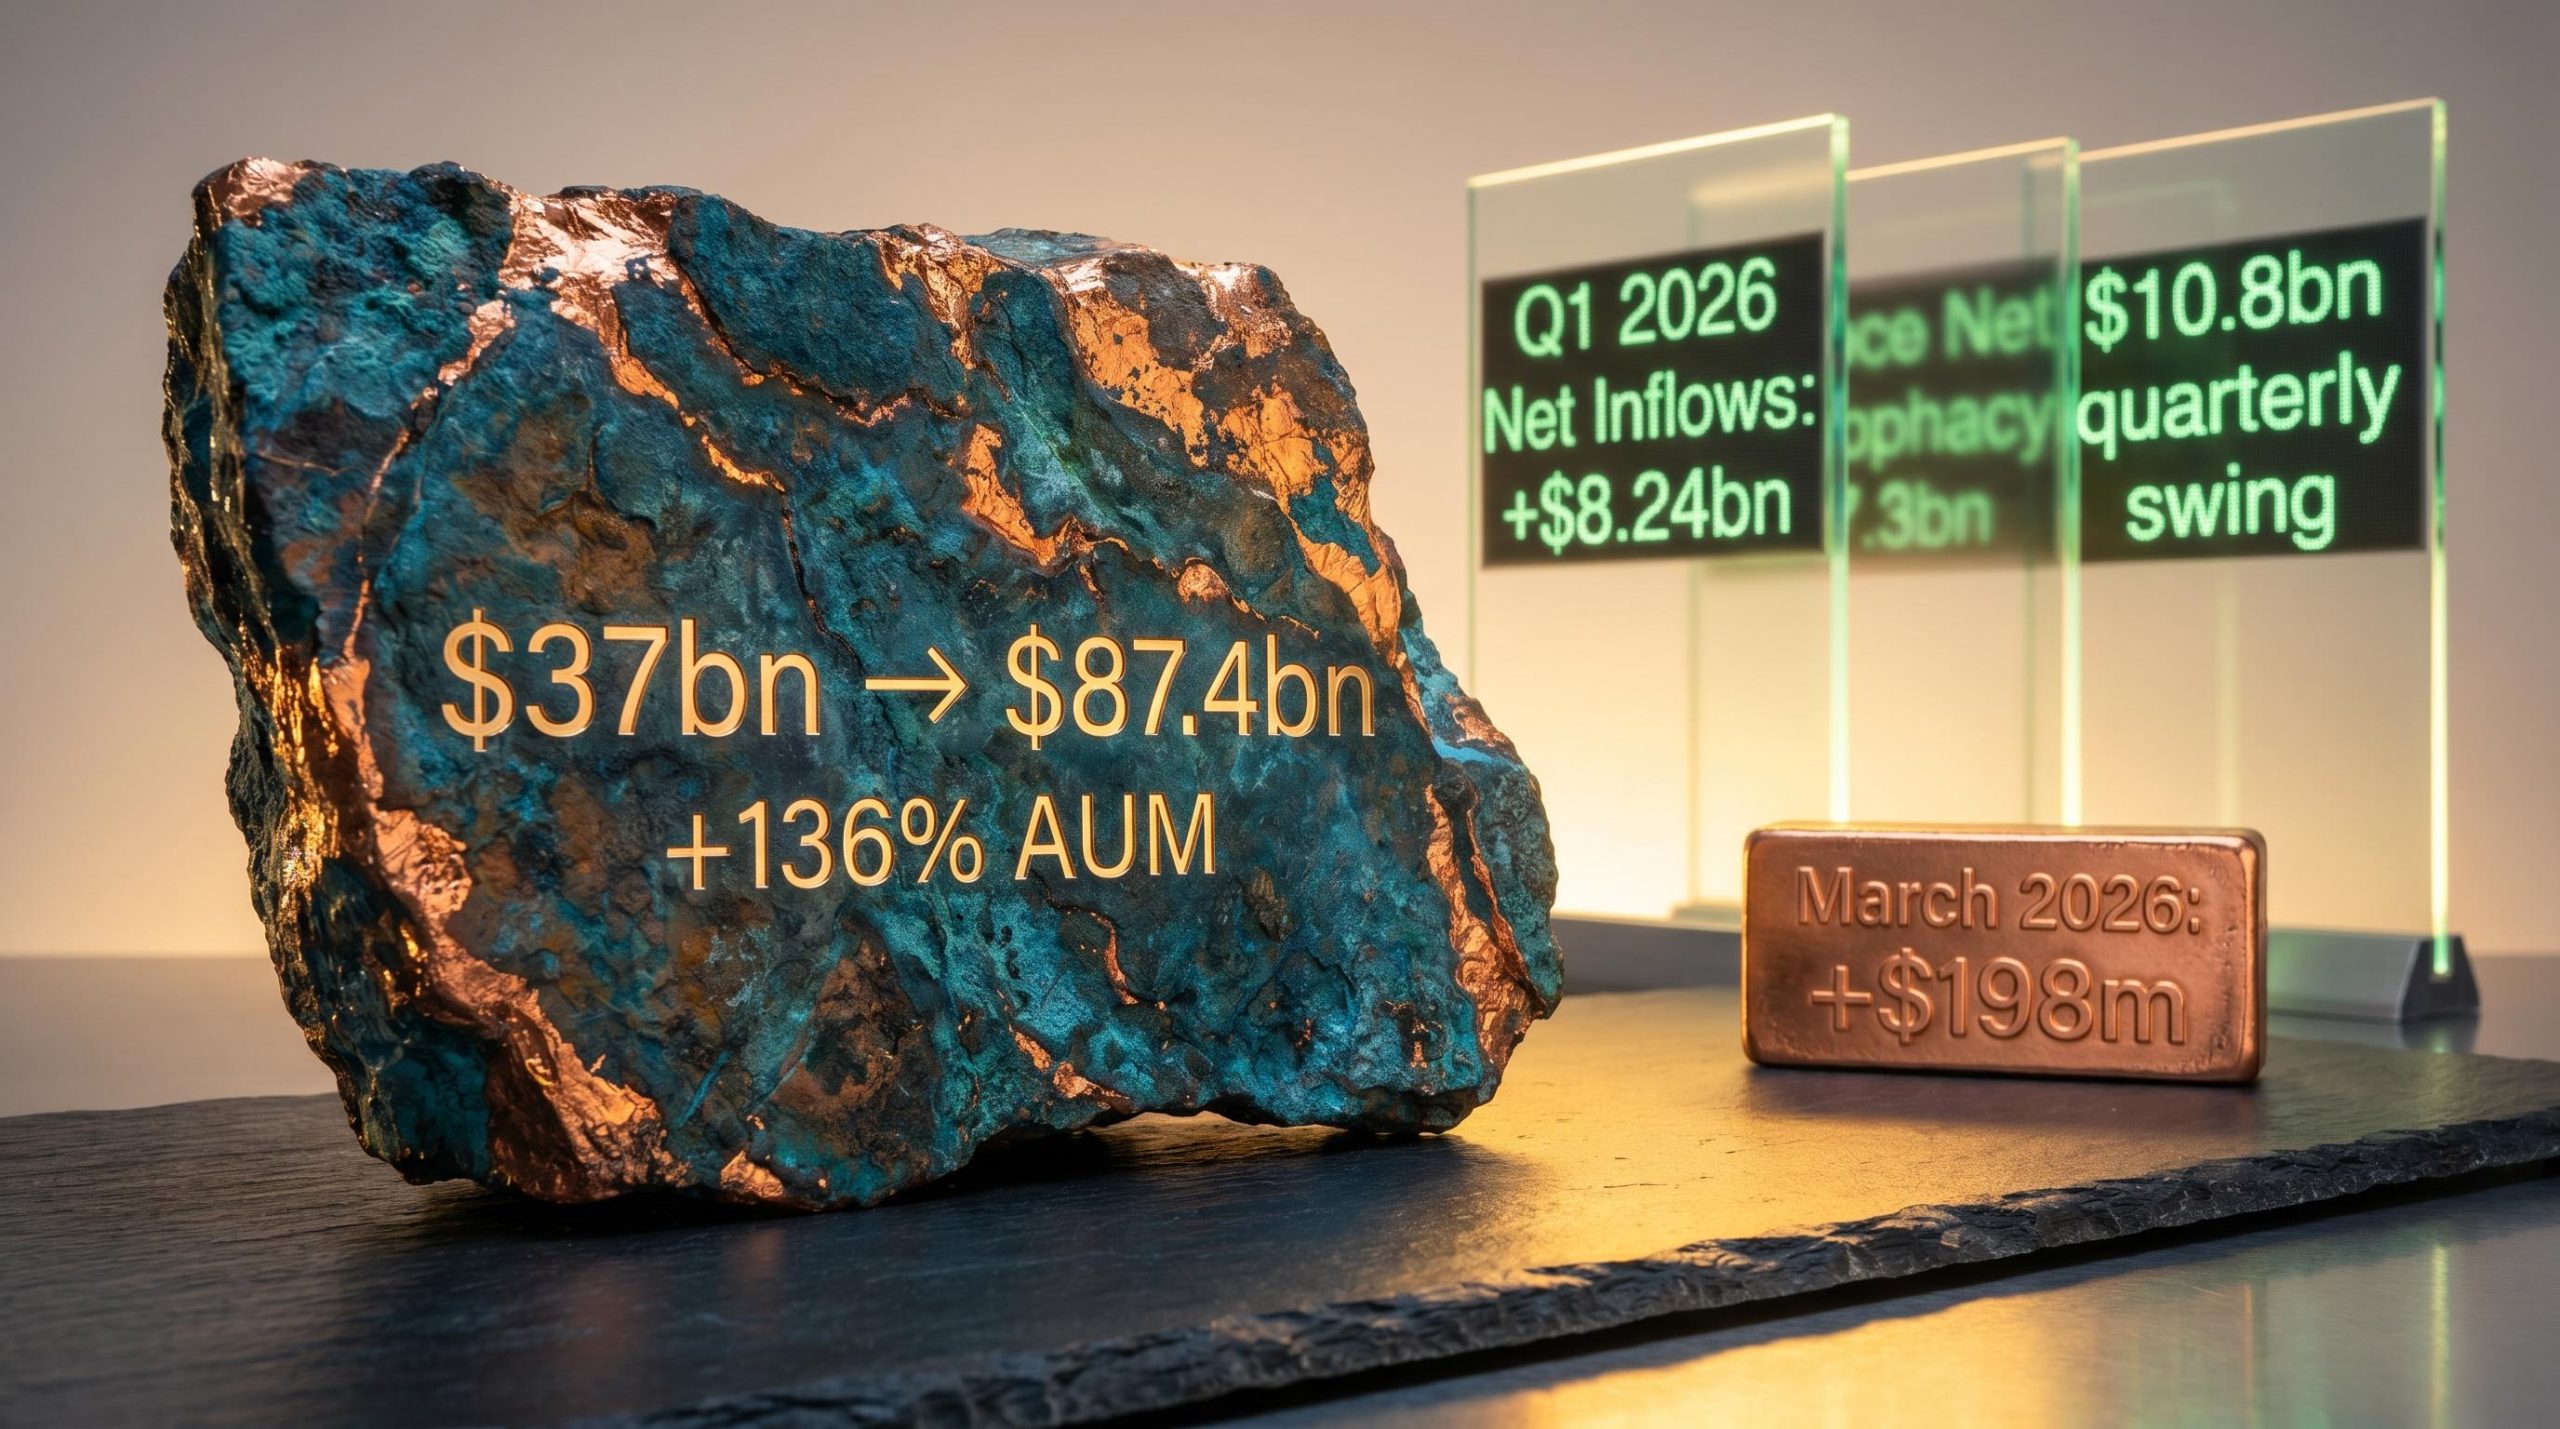
In the twelve months to 31 March 2026, assets under management in mining ETFs more than doubled. The figure rose 136%, from $37 billion to $87.4 billion, according to data from ETFGI. Capital rotations of that magnitude do not happen without institutional conviction, and the timing raises a question that matters more than the headline number: is this the opening of a commodity supercycle, or is it a crowded trade dressed in a structural narrative?
The case for a supercycle has credible advocates. BlackRock’s Evy Hambro has framed current conditions as the beginning of a decade-long commodity upcycle driven by AI infrastructure, grid expansion, electrification, and defence spending. Q1 2026 alone recorded $8.24 billion in net inflows into mining ETFs, a $10.8 billion swing from the same quarter a year earlier, when tariff uncertainty pushed $2.52 billion out the door.
What follows is a structured framework for evaluating whether that thesis is investment-grade. It covers the flow data, the demand architecture, where divergence within mining ETFs sits, what the valuation gap implies, and where the thesis can break down.
The top-line number commands attention. Mining ETF assets under management climbed from $37 billion at the end of March 2025 to $87.4 billion by 31 March 2026, per ETFGI data. That is not a gradual accumulation; it is a repositioning.
The quarterly data sharpens the picture. Q1 2025 saw $2.52 billion in net outflows as investors pulled back following tariff announcements. Twelve months later, Q1 2026 delivered $8.24 billion in net inflows. The same calendar quarter swung $10.8 billion in a single year.
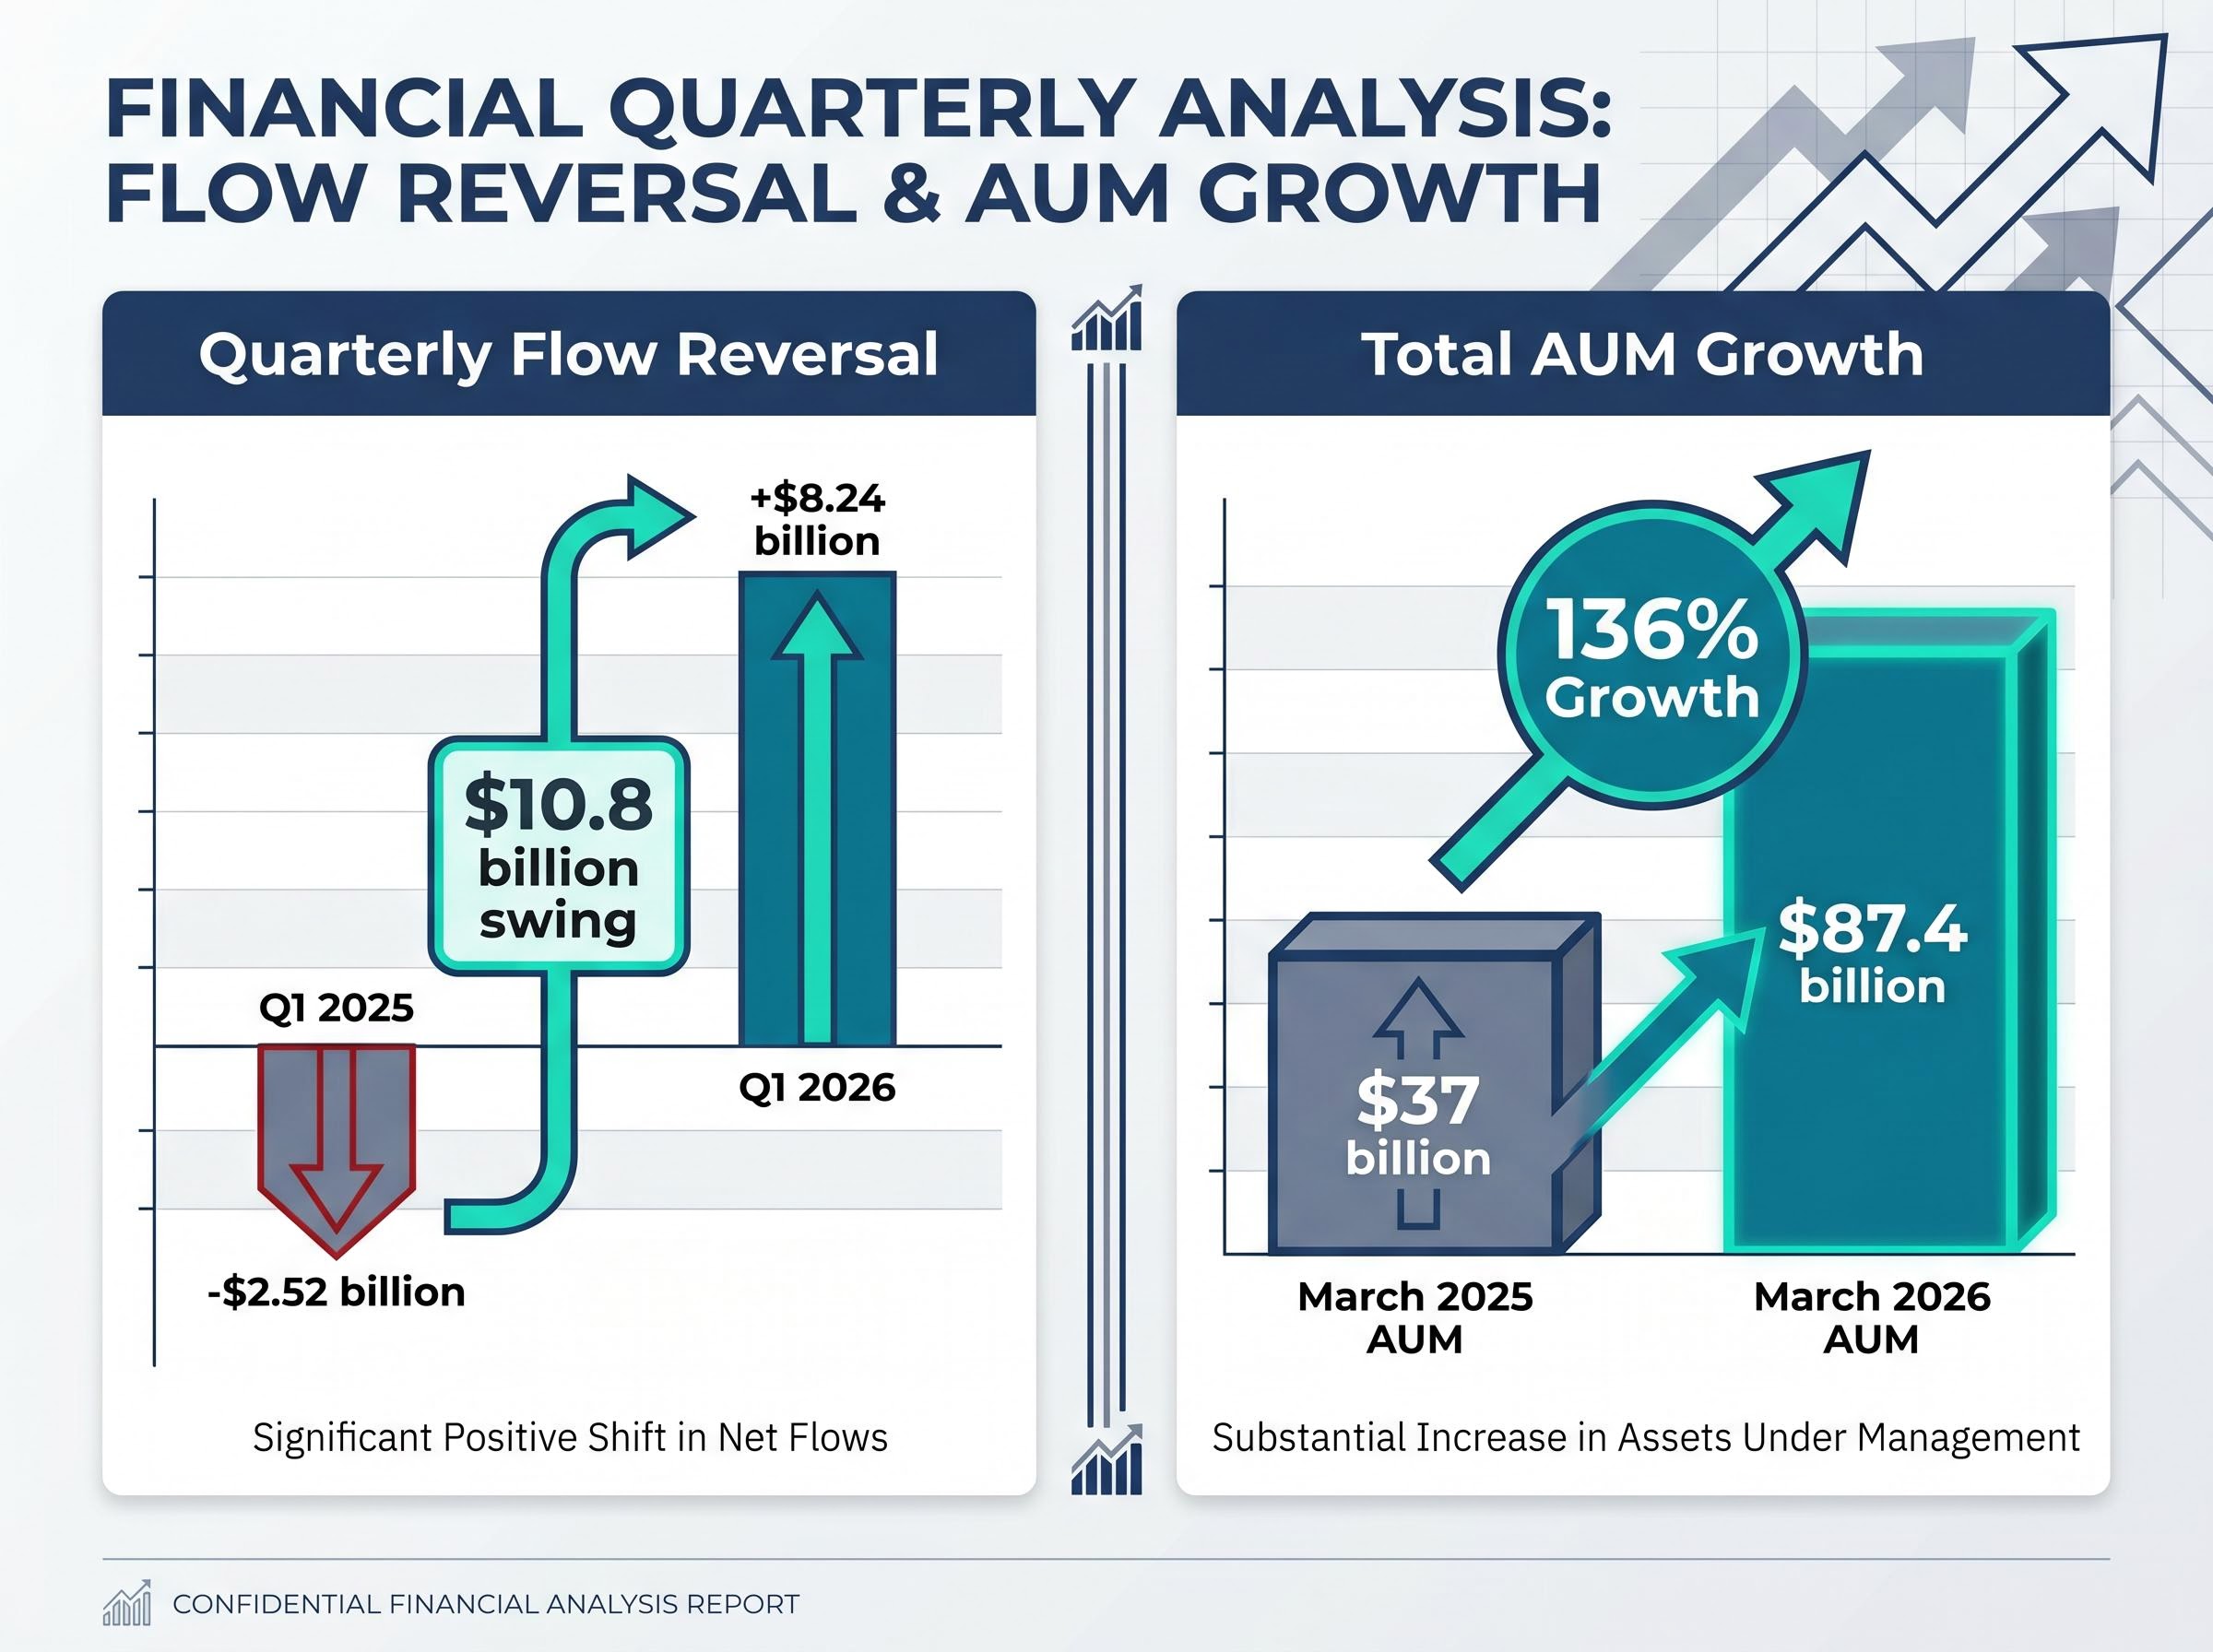
136% AUM growth in twelve months: Mining ETF assets under management rose from $37 billion to $87.4 billion between March 2025 and March 2026, per ETFGI.
That kind of reversal in a single quarter points to institutional re-allocation rather than retail enthusiasm. Copper-focused funds alone attracted $198 million in net inflows during March 2026, a signal that the positioning is becoming material-specific rather than broadly thematic.
| Period | Net flows | AUM at quarter end | Directional signal |
|---|---|---|---|
| Q1 2025 | -$2.52bn | $37bn | Risk-off (tariff uncertainty) |
| Q1 2026 | +$8.24bn | $87.4bn | Institutional re-allocation |
Flow data at this scale is a leading indicator of positioning, not a lagging outcome. For investors evaluating whether to add mining exposure, understanding where institutional capital moved, and how rapidly it moved, is the starting point for any honest assessment.
The supercycle argument rests on a specific claim: that multiple independent demand sources are converging on the same raw materials simultaneously. If only one of these sources were active, the demand story would be cyclical. The bull case depends on their overlap.
Four demand pillars underpin the thesis:
BlackRock’s Evy Hambro has characterised current conditions as “the beginning of a commodity supercycle,” a statement that carries weight given BlackRock’s position as the world’s largest asset manager. The demand drivers Hambro identifies are not speculative; they are already visible in capital expenditure data.
The copper intensity of data centre construction is the most underappreciated demand variable. Power systems, transmission cables, busbar distribution, and backup generation all require copper at volumes that scale linearly with compute capacity.
The copper intensity embedded in AI infrastructure investment is not speculative: Wall Street projects $530 billion to $700 billion in global data centre IT spending for 2026 alone, and each megawatt of compute capacity requires copper for power transmission, cooling loops, and backup generation that scales linearly with facility size.
Caterpillar’s Q1 2026 earnings provided a real-time proxy: the company’s power-generation order backlog stood at more than three times its 2024 level. US business equipment spending rose 17% in Q1 2026, with intellectual property investment up 13% and combined structures and equipment spending up 10.4%. Capital is flowing into the physical infrastructure that these demand pillars require.
The scale of technology capital expenditure provides a useful parallel for evaluating mining sector thesis credibility: the same hyperscaler spending that is driving a semiconductor supercycle in hardware, with the SOX index gaining 38% by mid-April 2026, is simultaneously generating the copper, power, and rare earth demand that underpins the commodity bull case.
A reader who purchases a broadly labelled mining ETF may believe they are positioned for the industrial supercycle. The data suggests they may instead be holding a gold price bet.
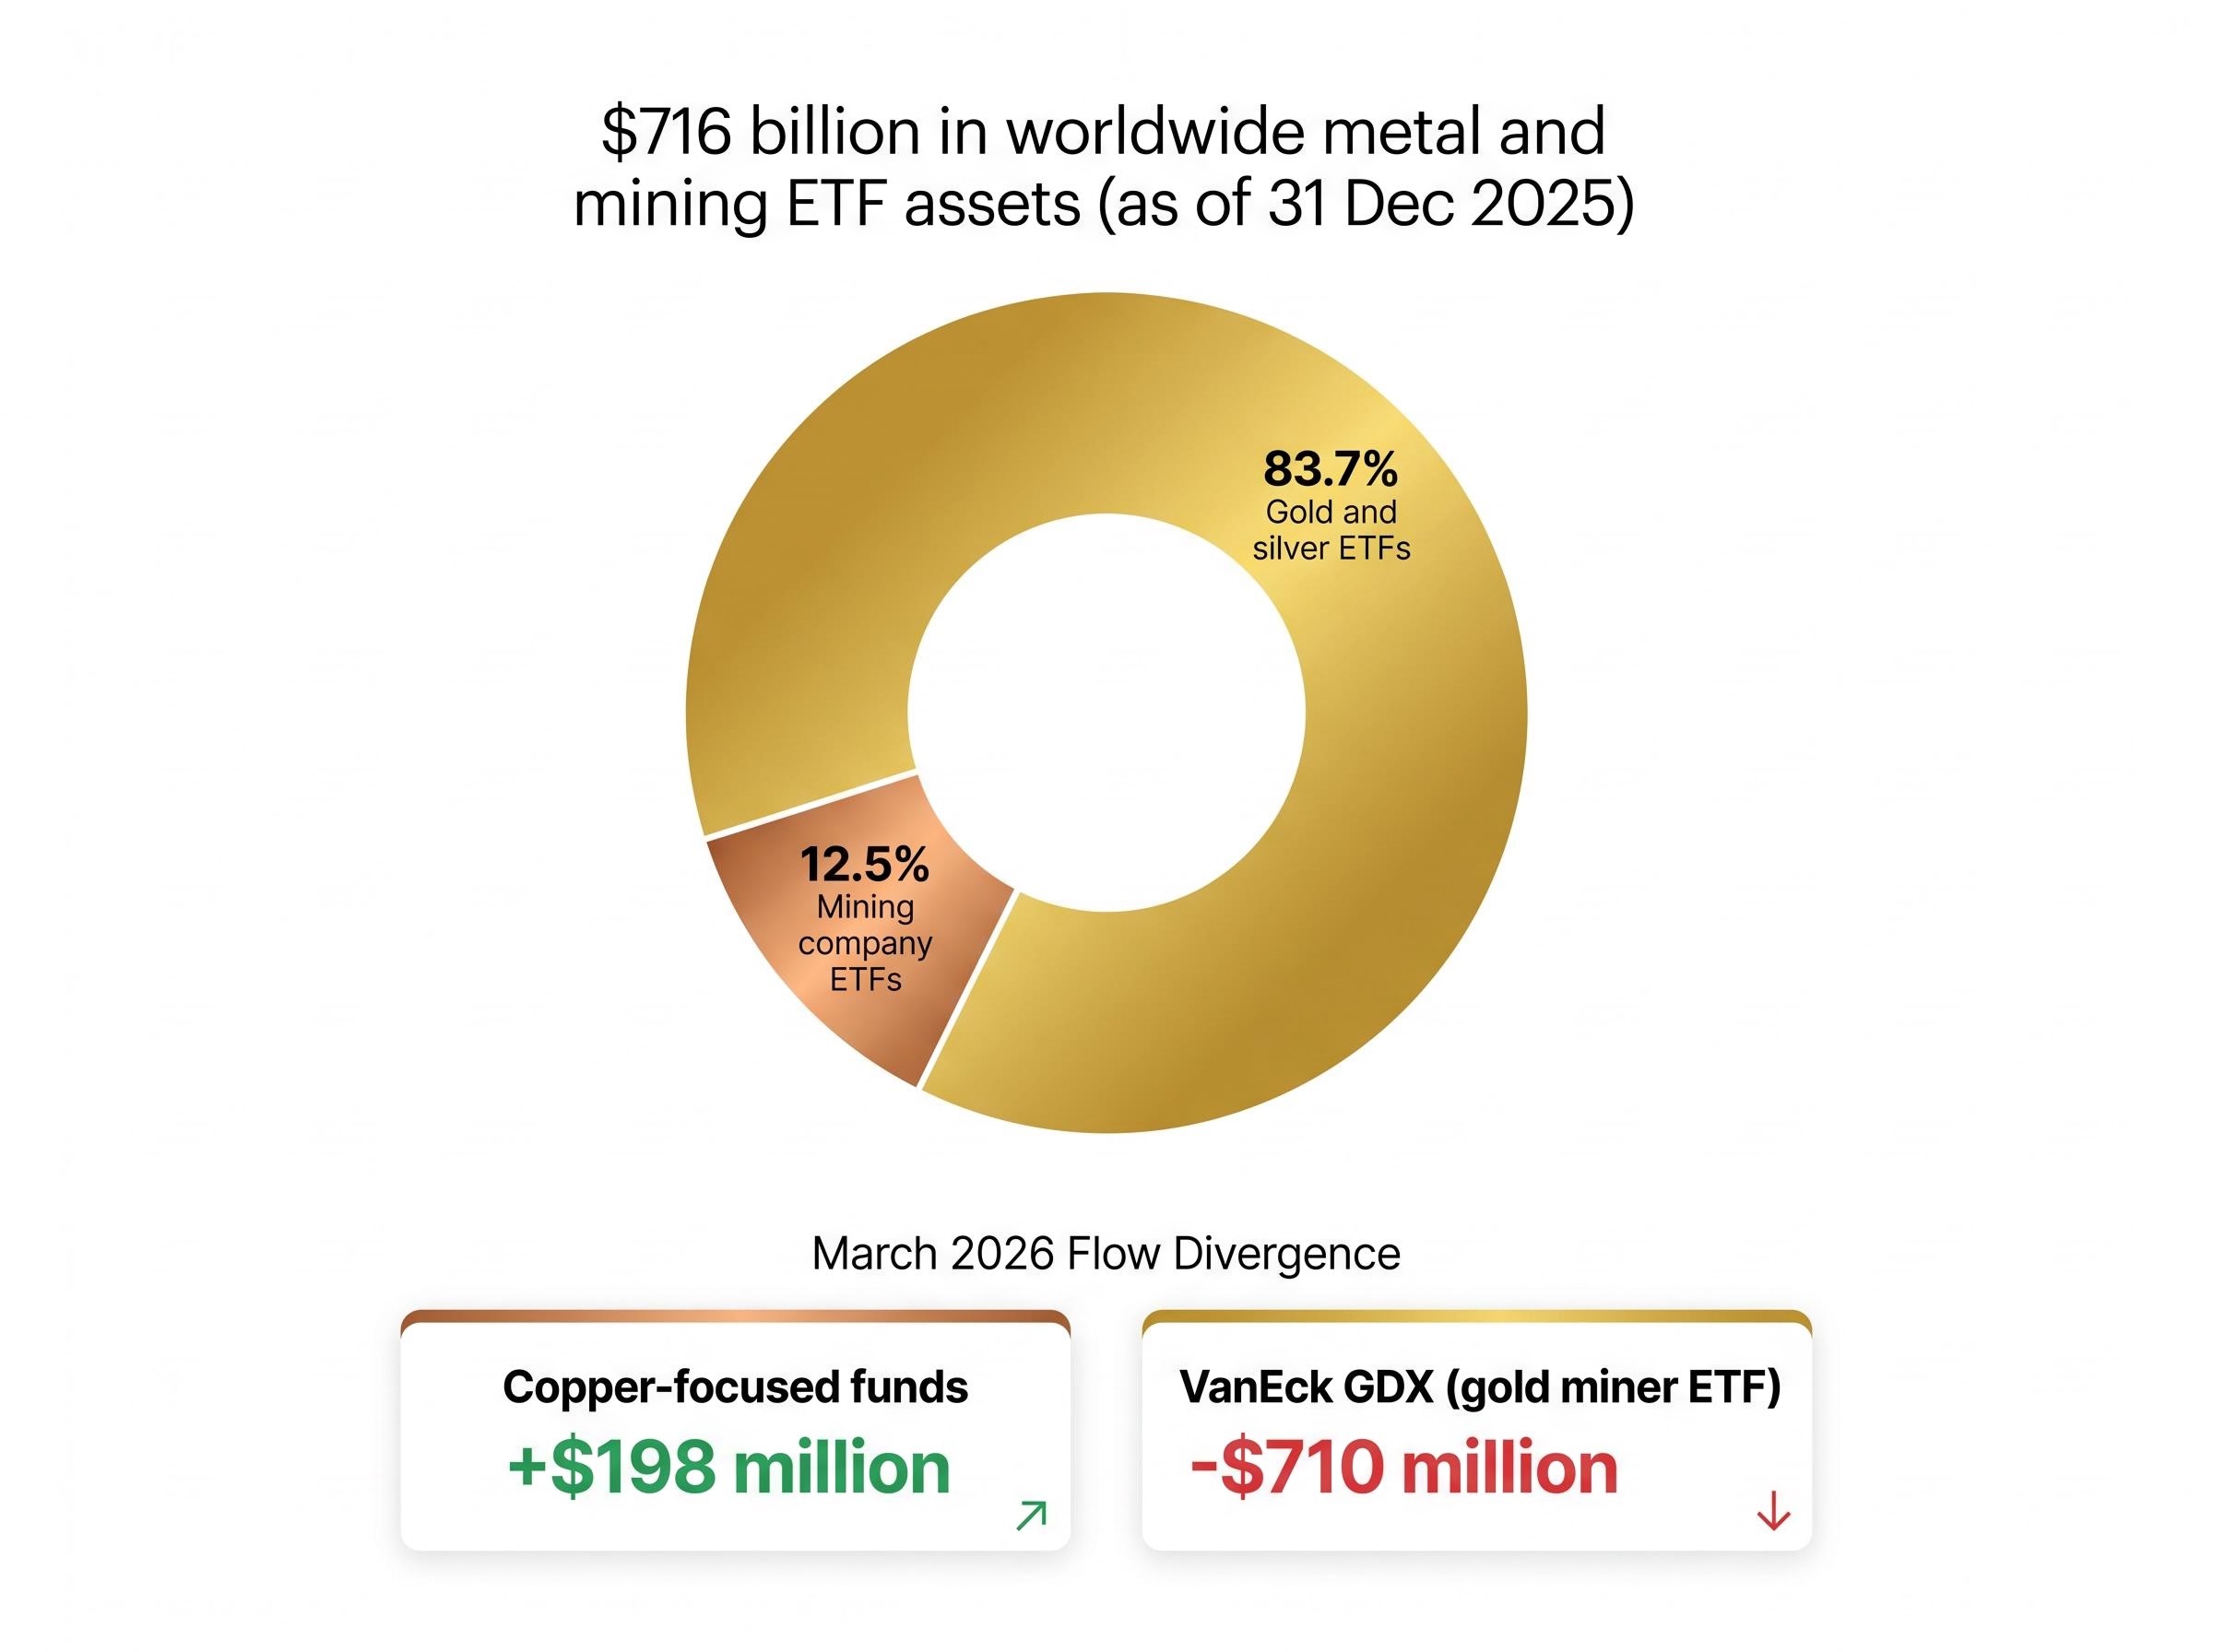
At 31 December 2025, gold and silver ETFs represented 83.7% of the $716 billion in worldwide metal and mining ETF assets. Mining company ETFs accounted for just 12.5%.
83.7% concentration: Gold and silver ETFs dominated worldwide mining ETF assets at year-end 2025, meaning “mining ETF” exposure is overwhelmingly a precious metals position for most investors.
Within Q1 2026 flows, the divergence became sharper. Copper-focused funds attracted $198 million in net inflows during March 2026 alone. By contrast, VanEck’s GDX (the largest gold miner ETF) recorded $710 million in outflows that same month, despite remaining approximately $1 billion positive on a year-to-date basis.
| Category | Share of AUM (year-end 2025) | Q1 2026 flow direction | Primary investment rationale |
|---|---|---|---|
| Gold/silver ETFs | 83.7% | Mixed (GDX saw March outflows) | Monetary hedge, inflation protection |
| Industrial metals ETFs | Smaller share | Positive (copper funds +$198m in March) | Infrastructure and growth bet |
The distinction matters analytically. Gold is a monetary hedge; industrial metals are a growth and infrastructure bet. The two rationales respond to different macro variables, and conflating them produces portfolio confusion. Selecting between gold-heavy and industrial-focused mining ETFs is a more precise decision than choosing between “mining” and “not mining.”
A commodity supercycle is a decade-plus period in which commodity prices remain above their long-term trend, driven by demand that consistently outpaces supply capacity. The concept is not theoretical; it has historical precedent that provides a framework for evaluating the current thesis.
The most recent widely recognised supercycle ran from approximately 2000 to 2010, driven by Chinese urbanisation and industrialisation. During that period, copper prices rose from under $1 per pound to over $4 per pound. The demand was structural: hundreds of millions of people moved into cities, and each city required power grids, transport networks, and housing stock built from raw materials.
Supply response to that demand was slow, and understanding why is central to the supercycle mechanism:
The US State Department’s announcement of the 2026 Critical Minerals Ministerial on 26 February 2026 signals that governments are treating these supply-side constraints as a strategic problem, not merely a market inefficiency.
The U.S. Department of State’s 2026 Critical Minerals Ministerial confirmed that securing diversified supply chains for materials including copper, lithium, and rare earths had moved from economic priority to foreign policy imperative, with high-level government participation from allied nations signalling coordinated institutional intent.
Regal Partners’ Charlie Aitken has suggested that copper prices could “double or triple” over the coming decade, a projection that reflects the supply-demand imbalance at the core of the supercycle thesis.
The term generates both excitement and scepticism for good reason. If the demand sources prove structural and supply remains constrained, the price environment could persist for years. If demand disappoints or supply arrives faster than expected, the “supercycle” label becomes an expensive marketing narrative.
The macro thesis is only half the equation. Valuation is the mechanism that converts a correct view on commodity demand into actual portfolio returns.
Major mining companies currently trade at an enterprise value to EBITDA (EV/EBITDA) multiple of approximately 7-8x. A measure of how expensive a company is relative to its earnings before interest, taxes, depreciation, and amortisation, this multiple compares to approximately 14x during the 2008-2010 commodity boom. The gap implies that if multiples were to revert toward that prior peak, the re-rating potential could be roughly 75-100% from current levels.
| Metric | Current conditions (2026) | 2008-2010 commodity boom |
|---|---|---|
| EV/EBITDA multiple | ~7-8x | ~14x |
| Macro demand driver | AI, electrification, defence | Chinese urbanisation |
| Commodity price environment | Rising, with supply constraints | Sustained elevation |
| Institutional sentiment | Accelerating (136% AUM growth) | Peak conviction |
That gap is likely what institutional buyers such as BlackRock are pricing into their positioning. It is also the market’s scepticism premium: the discount reflects genuine uncertainty about whether current conditions will replicate the earnings trajectory that drove the prior cycle’s re-rating.
Multiples do not expand on narrative alone. EV/EBITDA re-rating requires commodity prices to remain elevated long enough that earnings revisions force the market to reprice the sector’s forward earnings power.
During the 2008-2010 cycle, re-rating happened because earnings revisions were dramatic and sustained. Mining companies posted quarter after quarter of upward earnings surprises, and sell-side analysts progressively raised their forward estimates. The same dynamic would need to replay for the current valuation gap to close. If commodity prices stall or earnings growth disappoints, the gap persists, and the “undervaluation” reading becomes a mispricing of risk rather than an opportunity.
The strongest investment frameworks specify their own failure conditions. Three distinct risks could undermine the thesis.
China’s Q1 2026 GDP signals illustrate exactly why this risk requires close monitoring: headline growth of 5.0% was accompanied by an 11.2% fall in property investment and soft consumer spending, meaning the summary figure flatters an underlying demand picture that is materially weaker than it appears for base metal-intensive sectors.
The current macro backdrop does not uniformly support the demand model. Eurozone Q1 2026 GDP growth came in at 0.1%. US Q1 2026 GDP growth of 2.0% fell below the 2.3% consensus estimate. US core PCE reached 3.2% year-on-year, the highest since November 2023, complicating the rate environment for capital-intensive mining investment.
S&P Global’s mine cost outlook for 2026 identifies inflation and new supply as forces reshaping the mining sector, implying cost-side pressure on margins even if commodity prices rise. And VanEck GDX’s $710 million in March 2026 outflows serve as a reminder that even within the mining ETF category, conviction is far from uniform.
A reader who understands where this thesis breaks down is better positioned to monitor the right variables and adjust exposure before the story changes.
The demand drivers are real. Four independent sources of commodity demand are converging on the same materials, capital expenditure data confirms the infrastructure buildout is underway, and the valuation gap between current mining multiples (7-8x) and prior-cycle peaks (14x) is wide enough to offer meaningful re-rating potential if the thesis holds.
The failure conditions are equally real. China demand risk, substitution, supply response, and a softer global growth backdrop all represent plausible scenarios under which the supercycle narrative does not deliver the returns its advocates project.
The practical question for investors is not whether the supercycle is real. It is how to size and structure exposure given what is known and what is not.
Three evaluation steps provide a starting framework:
For investors wanting to model how persistent energy prices flow through to mining sector cost structures and interest rate trajectories, our full explainer on the inflation and rate environment examines central bank policy divergence, the disinflationary counter-forces from Chinese manufacturing exports and AI productivity gains, and the historical pattern of supply-constrained commodity crises resolving within six to twelve months.
Institutional positioning from firms such as BlackRock and Regal Partners provides a credibility signal but not a guarantee. The 136% AUM growth and $10.8 billion quarterly swing confirm that serious capital is moving into this space. Whether that capital is early or late depends on variables that remain unresolved.
This article is for informational purposes only and should not be considered financial advice. Investors should conduct their own research and consult with financial professionals before making investment decisions. Past performance does not guarantee future results. Financial projections are subject to market conditions and various risk factors.
A commodity supercycle is a decade-plus period where commodity prices remain above their long-term trend because demand consistently outpaces supply capacity. For mining ETF investors, it matters because if current demand drivers like AI infrastructure, electrification, and defence spending prove structural, mining companies could see sustained earnings growth and significant multiple re-rating from current levels.
Mining ETF assets under management rose 136%, from $37 billion to $87.4 billion, between March 2025 and March 2026 according to ETFGI data. Net inflows in Q1 2026 alone reached $8.24 billion, a $10.8 billion swing from the $2.52 billion in net outflows recorded in Q1 2025.
Most mining ETF exposure is heavily skewed toward precious metals: at year-end 2025, gold and silver ETFs represented 83.7% of worldwide metal and mining ETF assets, with mining company ETFs accounting for just 12.5%. Investors seeking industrial metals exposure, such as copper or lithium, need to select funds specifically targeting those materials rather than broad mining ETFs.
The three main risks are a sustained slowdown in Chinese industrial demand, technology substitution that reduces the amount of raw materials needed per unit of end product, and a faster-than-expected supply response from new mines or recycling capacity. China's Q1 2026 data, which showed an 11.2% fall in property investment alongside 5.0% headline GDP growth, illustrates why China demand risk warrants close monitoring.
Major mining companies currently trade at roughly 7-8x EV/EBITDA, compared to approximately 14x during the 2008-2010 commodity boom, suggesting meaningful re-rating potential if the supercycle thesis holds. Investors should first identify whether a given mining ETF holds primarily gold and silver or industrial metals, then assess the valuation entry point relative to historical multiples, and size the position within their broader portfolio context.