Stock-Bond Correlation Hits 30-Year Extreme, Rattling 60/40 Investors
1 hr ago
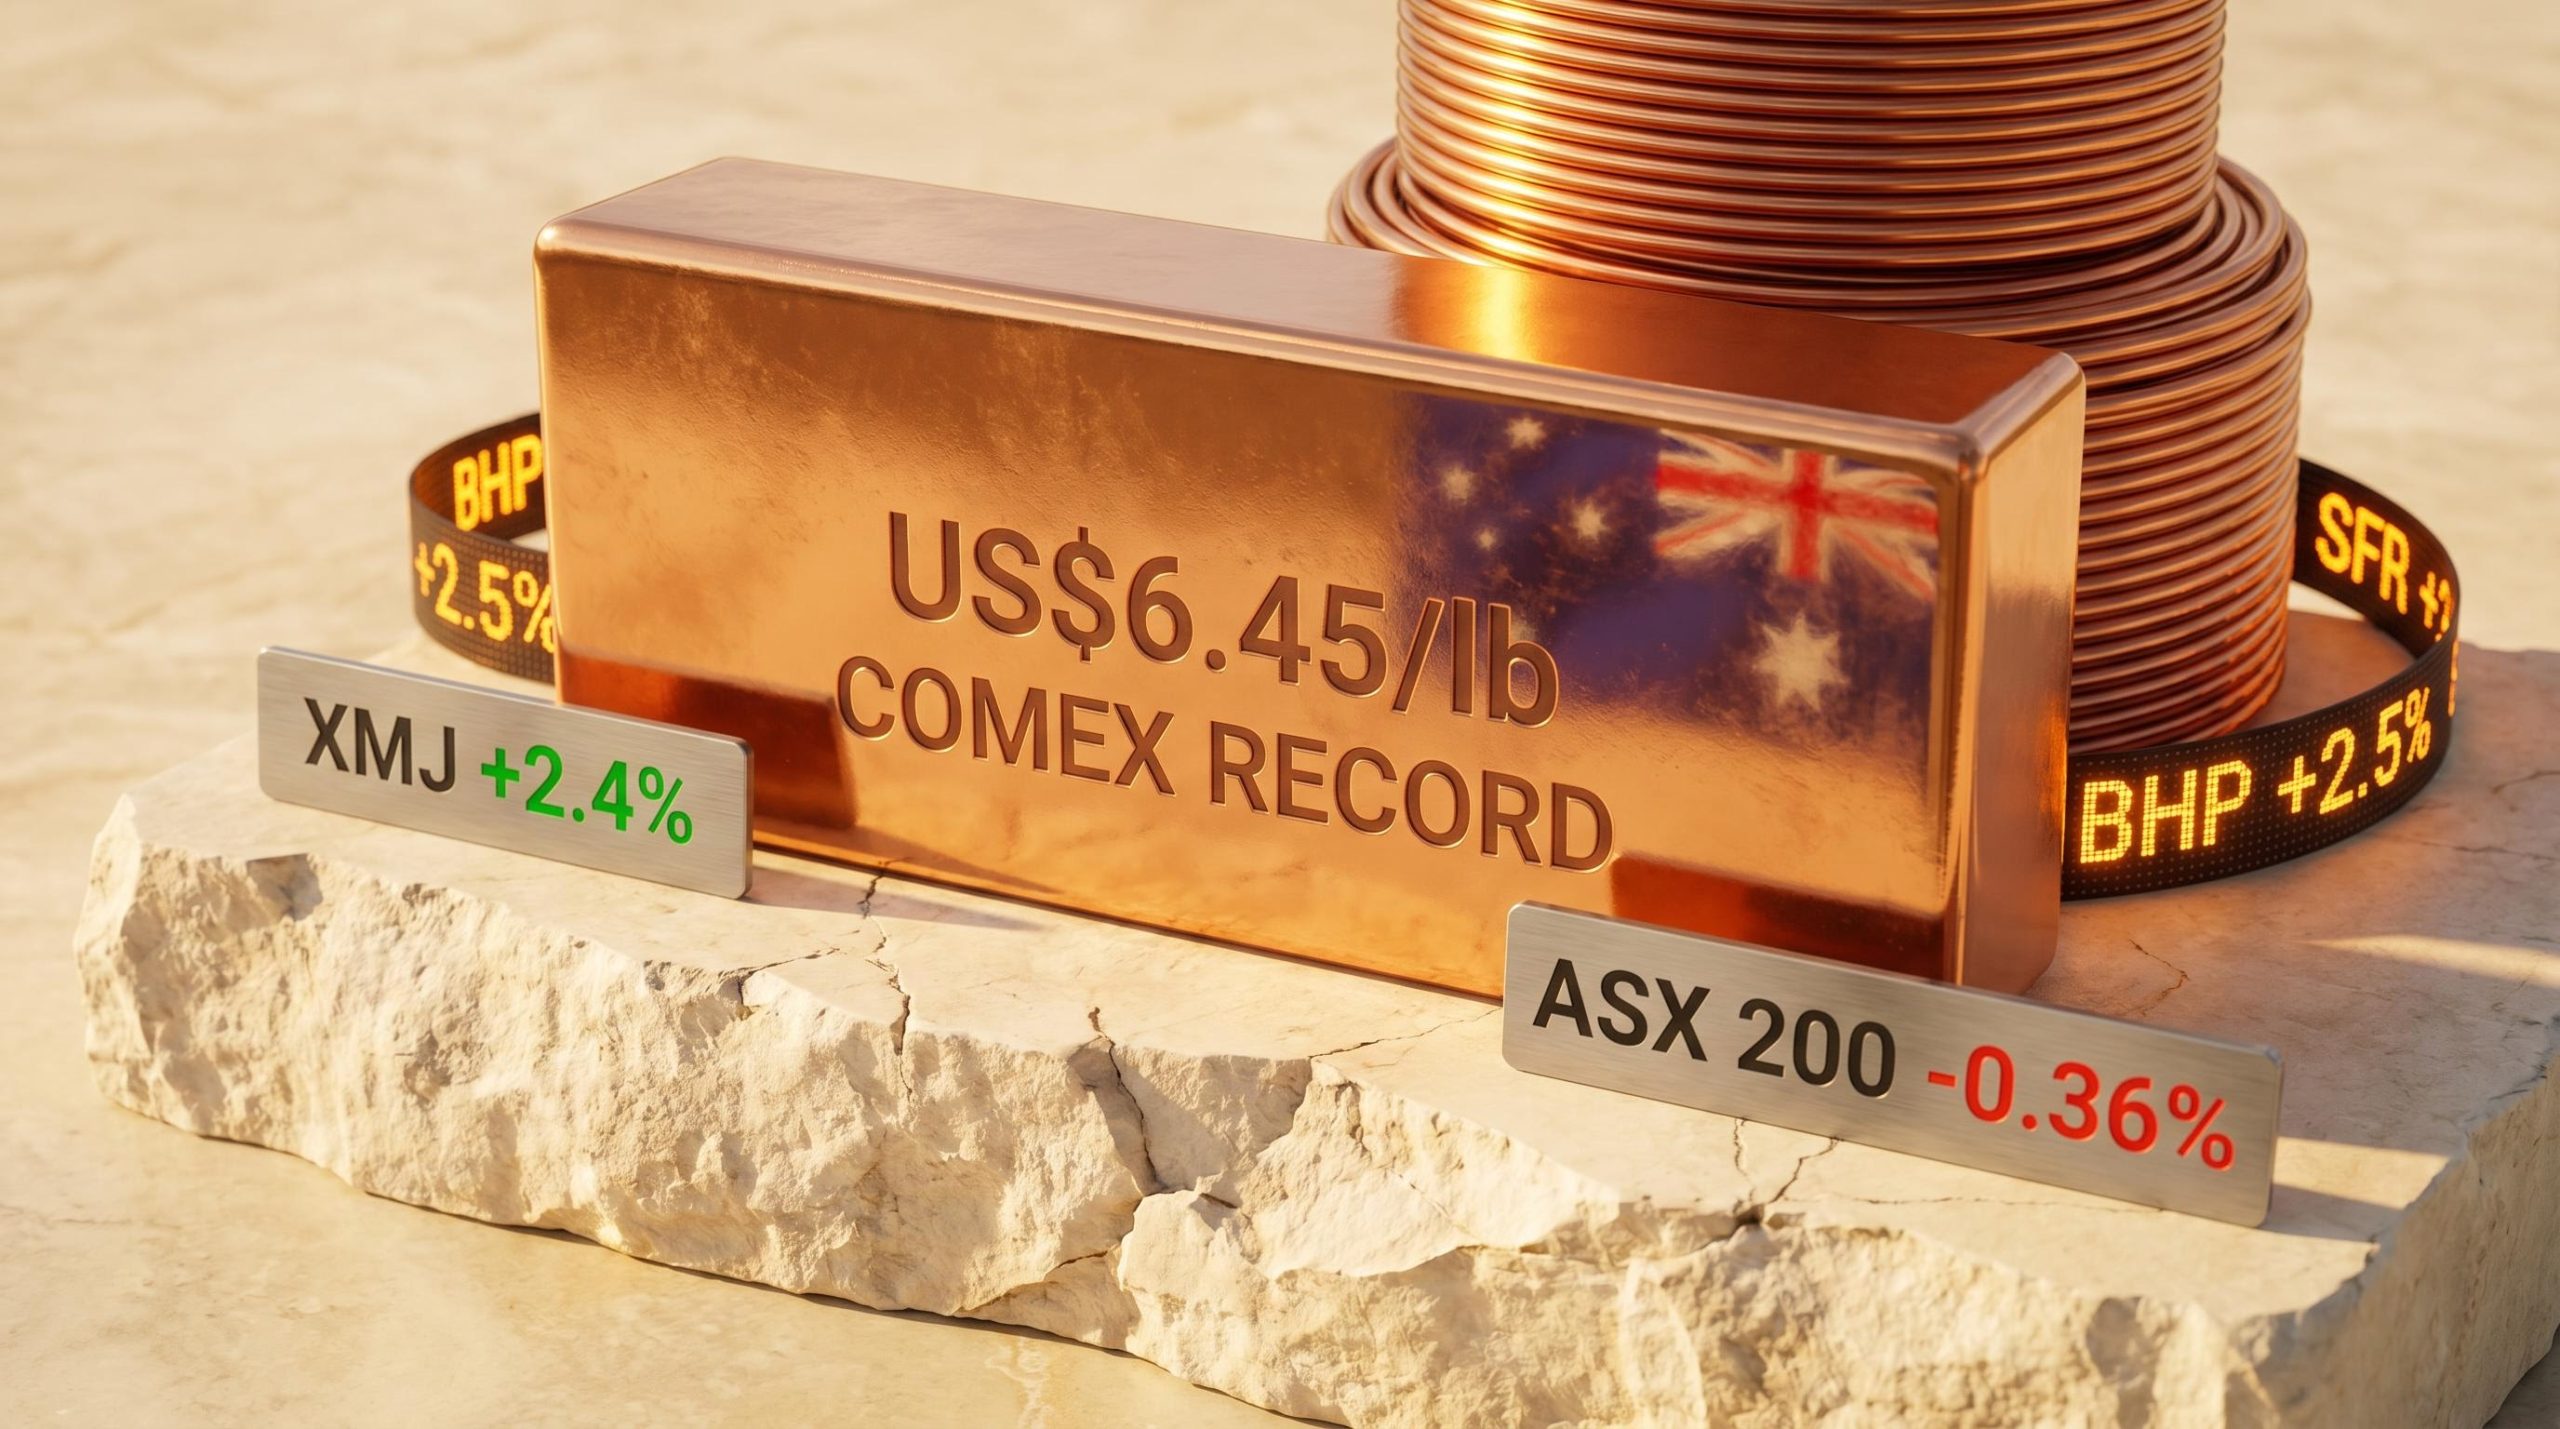
COMEX copper futures surged 2.6% overnight to settle at a record high above US$6.45 per pound, igniting the strongest sector move on the ASX on 12 May 2026. The Materials sector (XMJ) advanced 2.4% while the S&P/ASX 200 fell 0.36%, making resources stocks the standout exception to broad-based selling driven by federal budget anxiety, rising bond yields, and broker downgrades across healthcare and technology. BHP reclaimed its position as Australia’s largest listed company by market capitalisation during the session.
The copper record, however, arrives alongside a 20-year high in global exchange inventories, a detail that complicates the supply-tightness narrative and raises questions about how much of the price reflects structural demand versus trade-policy distortion. What follows is an examination of the forces behind the record, the ASX miners that captured the most upside, the lithium and gold threads running in parallel, and what the session’s unusual divergence signals about the resources cycle.
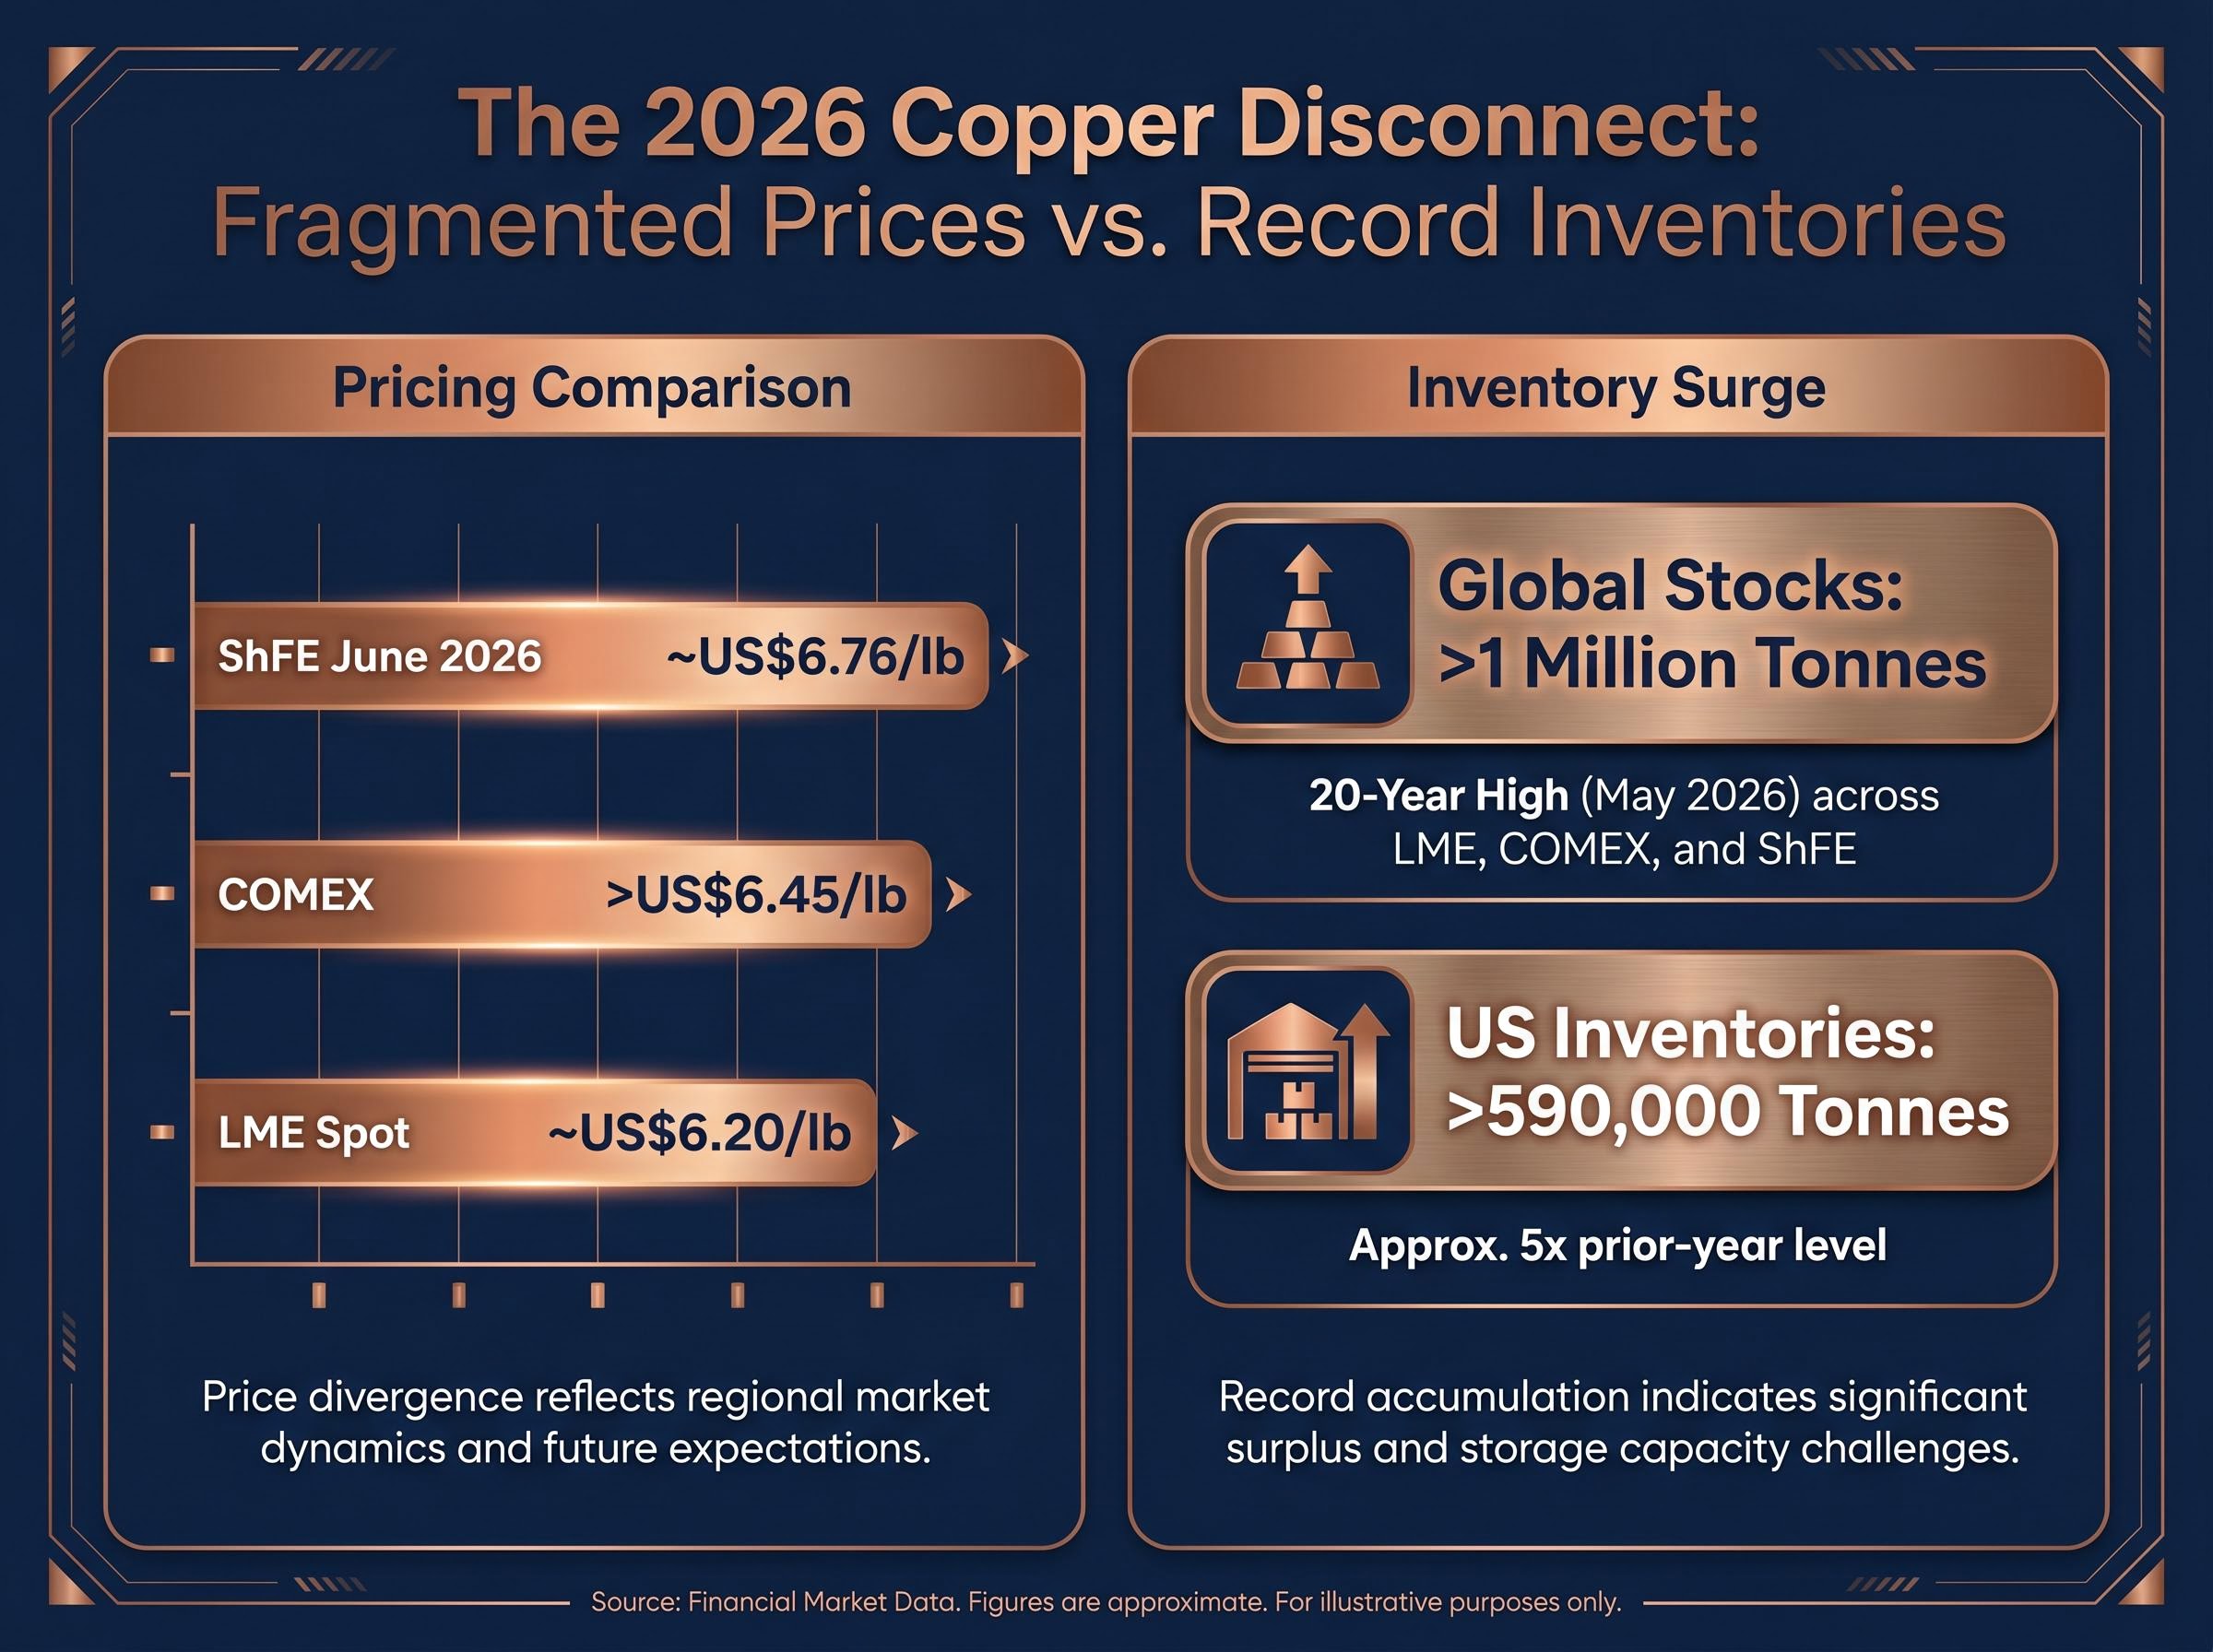
COMEX copper futures rose 2.6% in overnight US trade to settle above US$6.45/lb, a new all-time high. The contract eased 0.1% during Asian hours on 12 May, but the record settlement stood.
The standard explanation for a record copper price would point to supply tightness. The inventory data tells a different story.
The metals rally that fed into the 12 May session had been building across the prior week, with gold, copper, and uranium ETFs surging simultaneously on 7 May 2026 as Brent crude crashed 7.6% and falling Treasury yields combined with dollar weakness to amplify commodity prices in USD terms.
“Global exchange-held copper stocks exceeded 1 million tonnes in May 2026, a 20-year high, even as COMEX futures hit a record above US$6.45 per pound.”
Combined stocks across LME, COMEX, and ShFE sit above 1 million tonnes, per Mining.com. US inventories alone have ballooned past 590,000 tonnes, approximately five times the prior-year level. That buildup reflects US importers front-loading shipments ahead of anticipated tariff escalation, a dynamic that has inflated the COMEX price relative to global benchmarks.
The three major exchanges now show fragmented price discovery:
The gap between COMEX and LME pricing is itself the story: a tariff-driven premium layered on top of a genuine structural demand cycle, producing a record that carries more nuance than the headline suggests.
The copper record rippled across the ASX materials complex on 12 May, lifting diversified majors, pure-play copper names, and even iron ore-linked stocks despite a 1.2% decline in SGX iron ore futures to US$110.20/tonne.
| Company | ASX Code | Session Gain | Primary Exposure |
|---|---|---|---|
| Alcoa | AAI | +3.9% | Aluminium |
| South32 | S32 | +3.6% | Diversified (aluminium, copper, zinc) |
| Rio Tinto | RIO | +3.1% | Diversified (iron ore, copper, aluminium) |
| Sandfire Resources | SFR | +3.1% | Copper |
| BHP | BHP | +2.5% | Diversified (copper, iron ore) |
| Fortescue | FMG | +2.3% | Iron ore |
The breadth of gains across diversified majors, pure-play copper, and iron ore illustrates a sector-wide repricing rather than a single-commodity event, though copper was the catalyst. Fortescue’s advance despite falling iron ore futures underscored the strength of the rotation into materials.
BHP traded in a range of approximately $58.33-$59.78 on the session, with its 2.5% gain enough to reclaim the title of Australia’s largest listed company by market capitalisation. The milestone reflects the relative performance gap between resources and the sectors that sold off hardest: banks and CSL both declined sharply.
As the world’s largest copper producer, BHP is the primary ASX conduit for copper price strength. The market-cap reclaim carries a mechanical consequence for passive investors: index-tracking funds benchmarked to the ASX 200 will see their materials weighting shift upward, creating additional buying pressure in the sector.
Copper’s record price sits at the intersection of three forces that do not all pull in the same direction. Separating them matters for any investor calibrating how long the current price level can hold.
The structural demand case remains the foundation. Investment banks including Goldman Sachs and Macquarie have consistently cited multi-year copper demand growth driven by:
The second force is the tariff distortion itself. US importers accelerated shipments ahead of expected tariff escalation, inflating COMEX stocks to five times prior-year levels and pushing the COMEX-LME spread wider. Goldman Sachs has forecast this premium will compress as US stocks draw down.
The COMEX inventory buildup driven by tariff front-loading saw US copper stocks climb from under 100,000 tonnes to more than 560,000 tonnes across 2025-2026, as importers accelerated shipments ahead of anticipated duties and pushed the COMEX-LME spread to historically wide levels.
“Goldman Sachs forecast copper prices could consolidate toward approximately US$11,400 per tonne as the US tariff front-loading premium compresses through 2026.”
That consolidation target of approximately US$11,400/tonne (roughly US$5.16/lb) implies significant downside from current COMEX levels if the front-loading premium fades.
The third force is Chinese demand, which remains softer than expected. Declining Chinese copper stockpiles have supported price even as global totals hit highs, but the countervailing headwind from weaker-than-anticipated Chinese consumption has not disappeared. Broader USD weakness (the Australian dollar reached approximately 71 US cents in late January 2026, a three-year high) has amplified commodity prices in USD terms, adding another variable.
Investors in ASX copper stocks face different risk profiles depending on whether they are positioned for the near-term tariff premium or the longer electrification cycle. The structural case remains intact; the question is how much of the current price already reflects a policy-driven premium that could compress through 2026.
The commodity supercycle thesis has attracted significant institutional capital, with mining ETF assets under management surging 136% to $87.4 billion in the twelve months to March 2026, yet major mining companies still trade at roughly 7-8x EV/EBITDA compared to approximately 14x during the 2008-2010 boom, a valuation gap that frames the current price records as early-cycle rather than late-stage.
Lithium stocks extended recent upward momentum on 12 May, running in parallel with copper rather than because of it.
Commodity prices offered modest support: GFEX lithium carbonate futures edged 0.1% higher to CNY 205,260/tonne, while Australian spodumene concentrate rose 1.6% to US$2,945/tonne.
Lithium and copper have distinct supply-demand cycles and pricing dynamics. The concurrent gains on 12 May reflected a shared electrification demand narrative rather than a direct price linkage between the two metals. Session data indicated the lithium moves were part of a developing trend rather than a one-day event, suggesting investors were building positions across the electrification supply chain more broadly.
ASX lithium stocks had already reached 52-week highs in the week ending 8 May 2026, with spodumene concentrate prices having quadrupled from US$600 per tonne in mid-2025 to US$2,500 per tonne, meaning the 12 May gains in Liontown, IGO, and Pilbara Minerals extended a trend already in motion rather than marking a new departure.
COMEX gold futures fell 0.5% to US$4,704/oz during Asian trade on 12 May. Silver futures dropped 1.6% to US$84.58/oz. Yet ASX gold sub-index stocks posted some of the strongest individual gains of the day:
The disconnect makes sense when the timeline is separated. Silver had surged 6.3% in overnight US trade before the Asian pullback, and gold equities were pricing off that overnight strength rather than the real-time Asian session decline.
“COMEX gold futures fell 0.5% to US$4,704/oz during Asian trade even as ASX gold sub-index stocks posted gains of up to 6.2%, reflecting the overnight US session’s strength rather than the real-time commodity price.”
This is a practical reminder for resources investors: ASX gold stocks often price off US-session commodity moves rather than contemporaneous Asian futures, creating entry and exit dynamics that differ from base metals names.
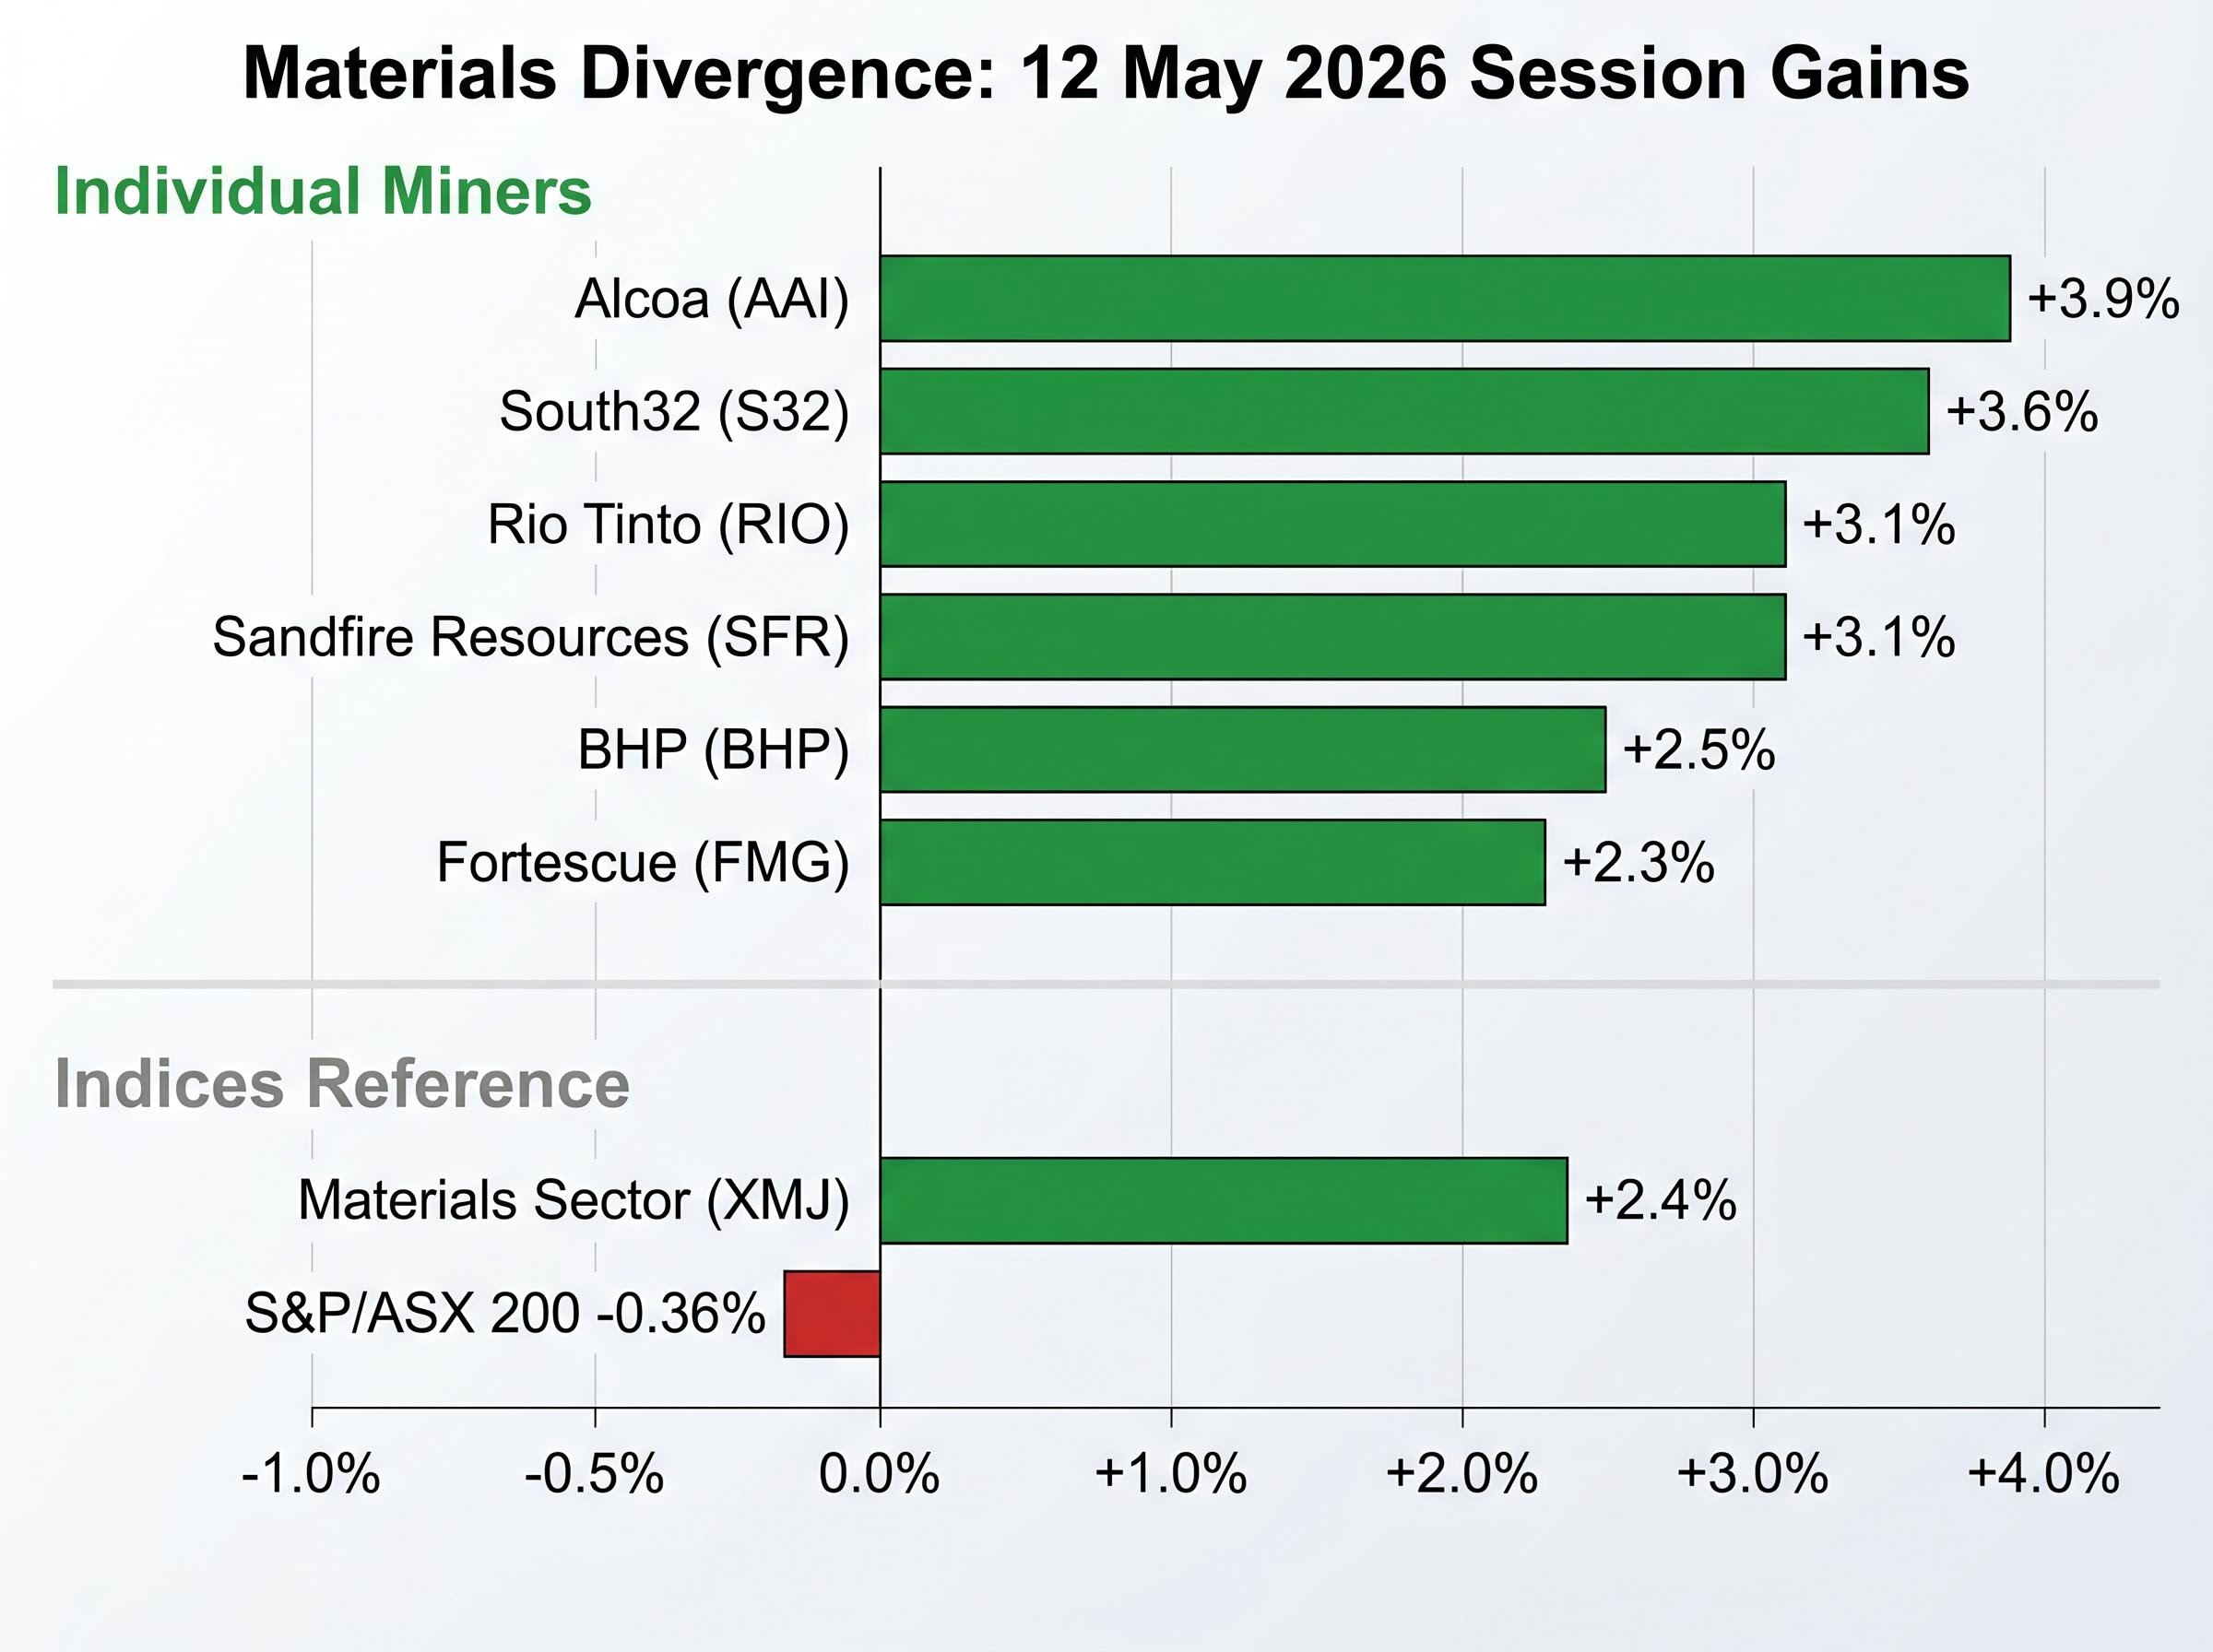
The ASX 200 fell 0.36% on 12 May 2026. The XMJ gained 2.4%. The gap was driven almost entirely by copper’s record settlement and the broad-based repricing of mining stocks that followed.
That divergence captures the structural repositioning underway in Australian equities. Macquarie has described the current environment as a “tectonic” supply shift for ASX copper stocks, with merger and acquisition activity (including the MAC Copper bid) supporting valuations across majors and mid-caps. The characterisation fits a session where resources stocks moved independently of, and in the opposite direction to, the rest of the market.
The materials sector re-rating thesis has gained broader institutional backing beyond any single session catalyst, with Bank of America’s Michael Hartnett citing the sector’s near 30-year low weighting in the S&P 500 alongside four non-correlated demand drivers as the foundation for a structural repositioning that the 12 May divergence fits neatly within.
The copper record, however, rests on overlapping forces that do not all point in the same direction beyond the near term. The Goldman Sachs medium-term consolidation forecast of approximately US$11,400/tonne and the persistent divergence between COMEX and LME pricing are the two signals worth monitoring. If the US tariff front-loading premium compresses, the COMEX-LME spread will narrow, and the question becomes whether structural electrification demand can support prices near current levels without the policy distortion.
The 12 May session gave resources investors two things at once: a genuine record backed by real structural demand, and a premium with policy-driven distortions that could unwind. Recognising both sides is the difference between positioning for the cycle and chasing a headline.
This article is for informational purposes only and should not be considered financial advice. Investors should conduct their own research and consult with financial professionals before making investment decisions. Past performance does not guarantee future results. Financial projections are subject to market conditions and various risk factors.
COMEX copper futures surged 2.6% to settle above US$6.45 per pound due to a combination of structural electrification demand, AI data centre buildout, and US importers front-loading shipments ahead of anticipated tariff escalation, which inflated the COMEX price relative to global benchmarks like the LME.
Combined exchange-held copper stocks across the LME, COMEX, and ShFE exceeded 1 million tonnes in May 2026, with US inventories alone ballooning to roughly 590,000 tonnes, because American importers aggressively front-loaded shipments ahead of expected tariff increases, inflating COMEX inventories to approximately five times prior-year levels rather than reflecting genuine supply tightness.
Alcoa (AAI) led with a 3.9% gain, followed by South32 (S32) at 3.6%, Rio Tinto (RIO) and Sandfire Resources (SFR) both at 3.1%, BHP (BHP) at 2.5%, and Fortescue (FMG) at 2.3%, with BHP also reclaiming its position as Australia's largest listed company by market capitalisation during the session.
Goldman Sachs forecast copper prices could consolidate toward approximately US$11,400 per tonne (roughly US$5.16 per pound) as the US tariff front-loading premium compresses through 2026, implying significant downside from current COMEX record levels if the policy-driven premium unwinds.
ASX gold stocks including Emerald Resources and Genesis Minerals each gained 6.2% because they were pricing off the overnight US session, where silver had surged 6.3% and gold futures were strong, rather than the real-time Asian session decline where COMEX gold fell 0.5% to US$4,704 per ounce.