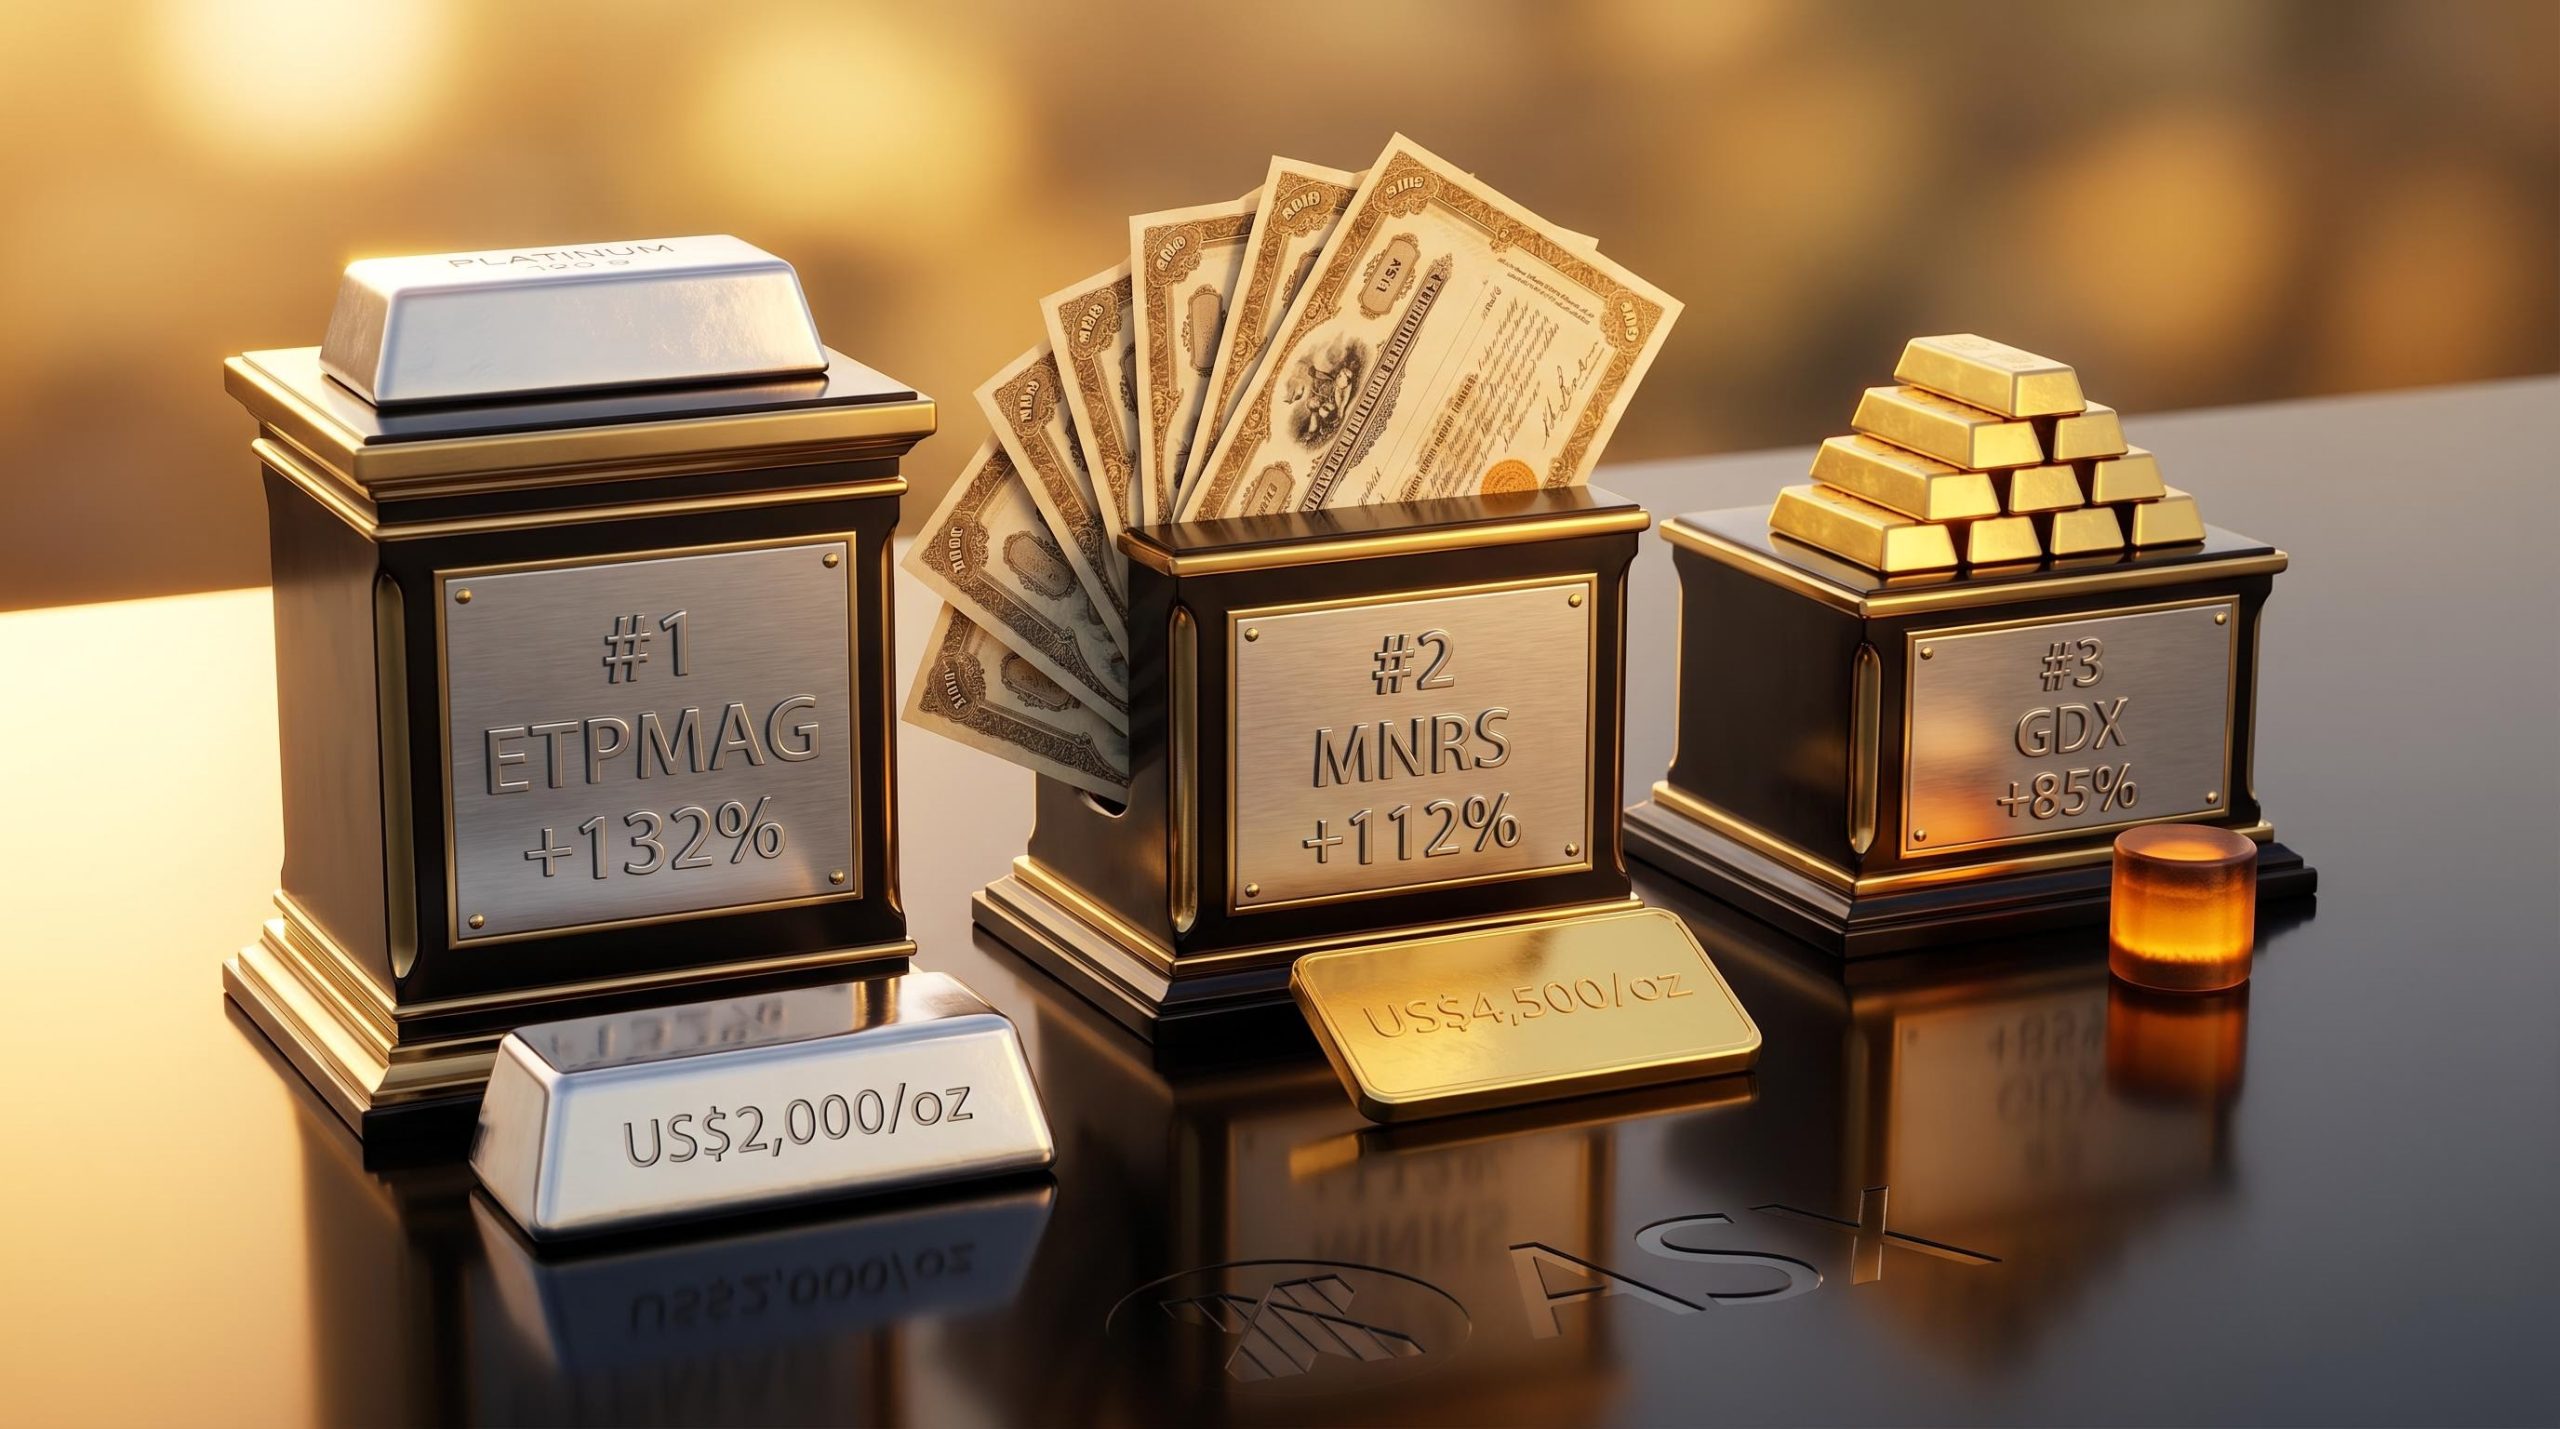
Three ASX commodity ETFs have quietly delivered returns of 85% to 132% over the past 12 months, a period when much of the broader equity market was churning through volatility. Gold has pushed past US$4,500/oz, platinum is trading near US$2,000/oz, and uranium spot prices remain elevated around US$86/lb. Australian investors with commodity ETF exposure have been among the biggest beneficiaries of this convergence. The three funds examined here, ETPMAG, MNRS, and GDX, represent different structural approaches to commodity investing: physical metal, currency-hedged miners, and unhedged global miners, each with its own return profile and risk architecture.
What follows ranks the three best-performing ASX commodity ETFs of the past year, explains what drove each fund’s returns, breaks down fees, structure, and funds under management, and flags the risks finance-savvy Australian investors need to weigh before adding exposure.
What drove commodity ETFs to outperform so decisively in 2025-26
The returns did not appear in isolation. Three macro forces converged across 2025 and into early 2026, and each one fed directly into the commodity classes these ETFs track:
- Persistent inflation eroding confidence in fiat assets. Central banks continued purchasing gold at pace, with the World Gold Council reporting 290 tonnes of net central bank gold purchases in Q1 2026 alone. Gold pushed past US$4,500/oz by early 2026 as investors sought hard-asset alternatives.
- Geopolitical fractures redirecting capital toward hard assets. Ongoing fiscal deficits, currency instability, and trade tensions pushed institutional and retail capital into commodities and resource producers. Capital rotated out of tech-heavy and broad-market equity positions, providing a flow tailwind on top of the underlying commodity price moves.
- AI-driven energy demand pulling uranium and platinum into new demand cycles. Japan’s July 2025 Green Transformation update reaffirmed plans for reactor life extensions and advanced builds. The EU taxonomy’s 2025 review maintained nuclear energy’s classification as sustainable. Hydrogen and fuel-cell applications lifted platinum-group metal demand alongside auto-catalyst recovery.
Sovereign gold demand from central banks has become a structural price floor rather than a cyclical variable, with the World Gold Council forecasting 850 tonnes of central bank purchases in 2026 even as the Federal Reserve maintains elevated real yields that would historically suppress gold’s appeal as a non-yielding asset.
J.P. Morgan Global Research forecast gold pushing toward US$5,000/oz by Q4 2026, citing continued central bank buying and investor diversification away from US dollar assets.
For mining equity ETFs specifically, the dynamic was amplified. Higher commodity prices expand profit margins disproportionately because extraction costs are relatively fixed, a mechanism known as operating leverage. This is why mining equity ETFs like GDX and MNRS can outperform physical commodity ETFs in rising price environments, and why they can fall harder in reverse.
When big ASX news breaks, our subscribers know first
No. 3: GDX gold miners fund (ASX: GDX), up approximately 85% in 12 months
An 85% return in 12 months sounds extraordinary until the mechanics are visible. With gold climbing past US$4,500/oz, the miners holding extraction costs relatively steady saw their margins blow out. That operating leverage flowed directly into GDX’s portfolio of global gold mining equities.
| Fund Name | ASX Code | 12-Month Return | Management Fee | FUM (30 Apr 2026) |
|---|---|---|---|---|
| VanEck Gold Miners ETF | GDX | ~85% | 0.53% p.a. | A$2.10 billion |
| BetaShares Global Gold Miners ETF (Currency Hedged) | MNRS | ~112% | 0.57% p.a. (up to 0.67% total) | A$385 million |
| Global X Physical Platinum | ETPMAG | ~132% | 0.49% p.a. | A$215 million |
GDX is structured as CHESS Depository Interests on the ASX, feeding into VanEck’s global gold miners index. Its February 2026 rebalance shifted weight toward North American mid-tier producers and away from South African names. Key holdings include Newmont Corp (ASX: NEM), and the fund’s geographic breadth across multiple producers and jurisdictions provides diversification, though it also dilutes returns compared to concentrated single-miner exposure.
The fund is unhedged for AUD/USD, which means currency movements add a second variable to returns. At A$2.10 billion in FUM, GDX offers the tightest bid-offer spreads of the three, making it the most accessible entry point for Australian investors new to gold miners.
The Australian Financial Review reported that while gold prices lifted revenue, labour and energy cost inflation in WA and QLD mining operations has compressed some producer margins, a tension embedded within the fund’s holdings.
No. 2: BetaShares Global Gold Miners ETF Currency Hedged (ASX: MNRS), up approximately 112% in 12 months
MNRS holds gold mining equities, not uranium. It tracks the Nasdaq Global ex-Australia Gold Miners Hedged AUD Index. Yet it returned approximately 27 percentage points more than GDX over the same 12 months, despite holding a structurally similar basket of miners.
The difference is the currency hedge.
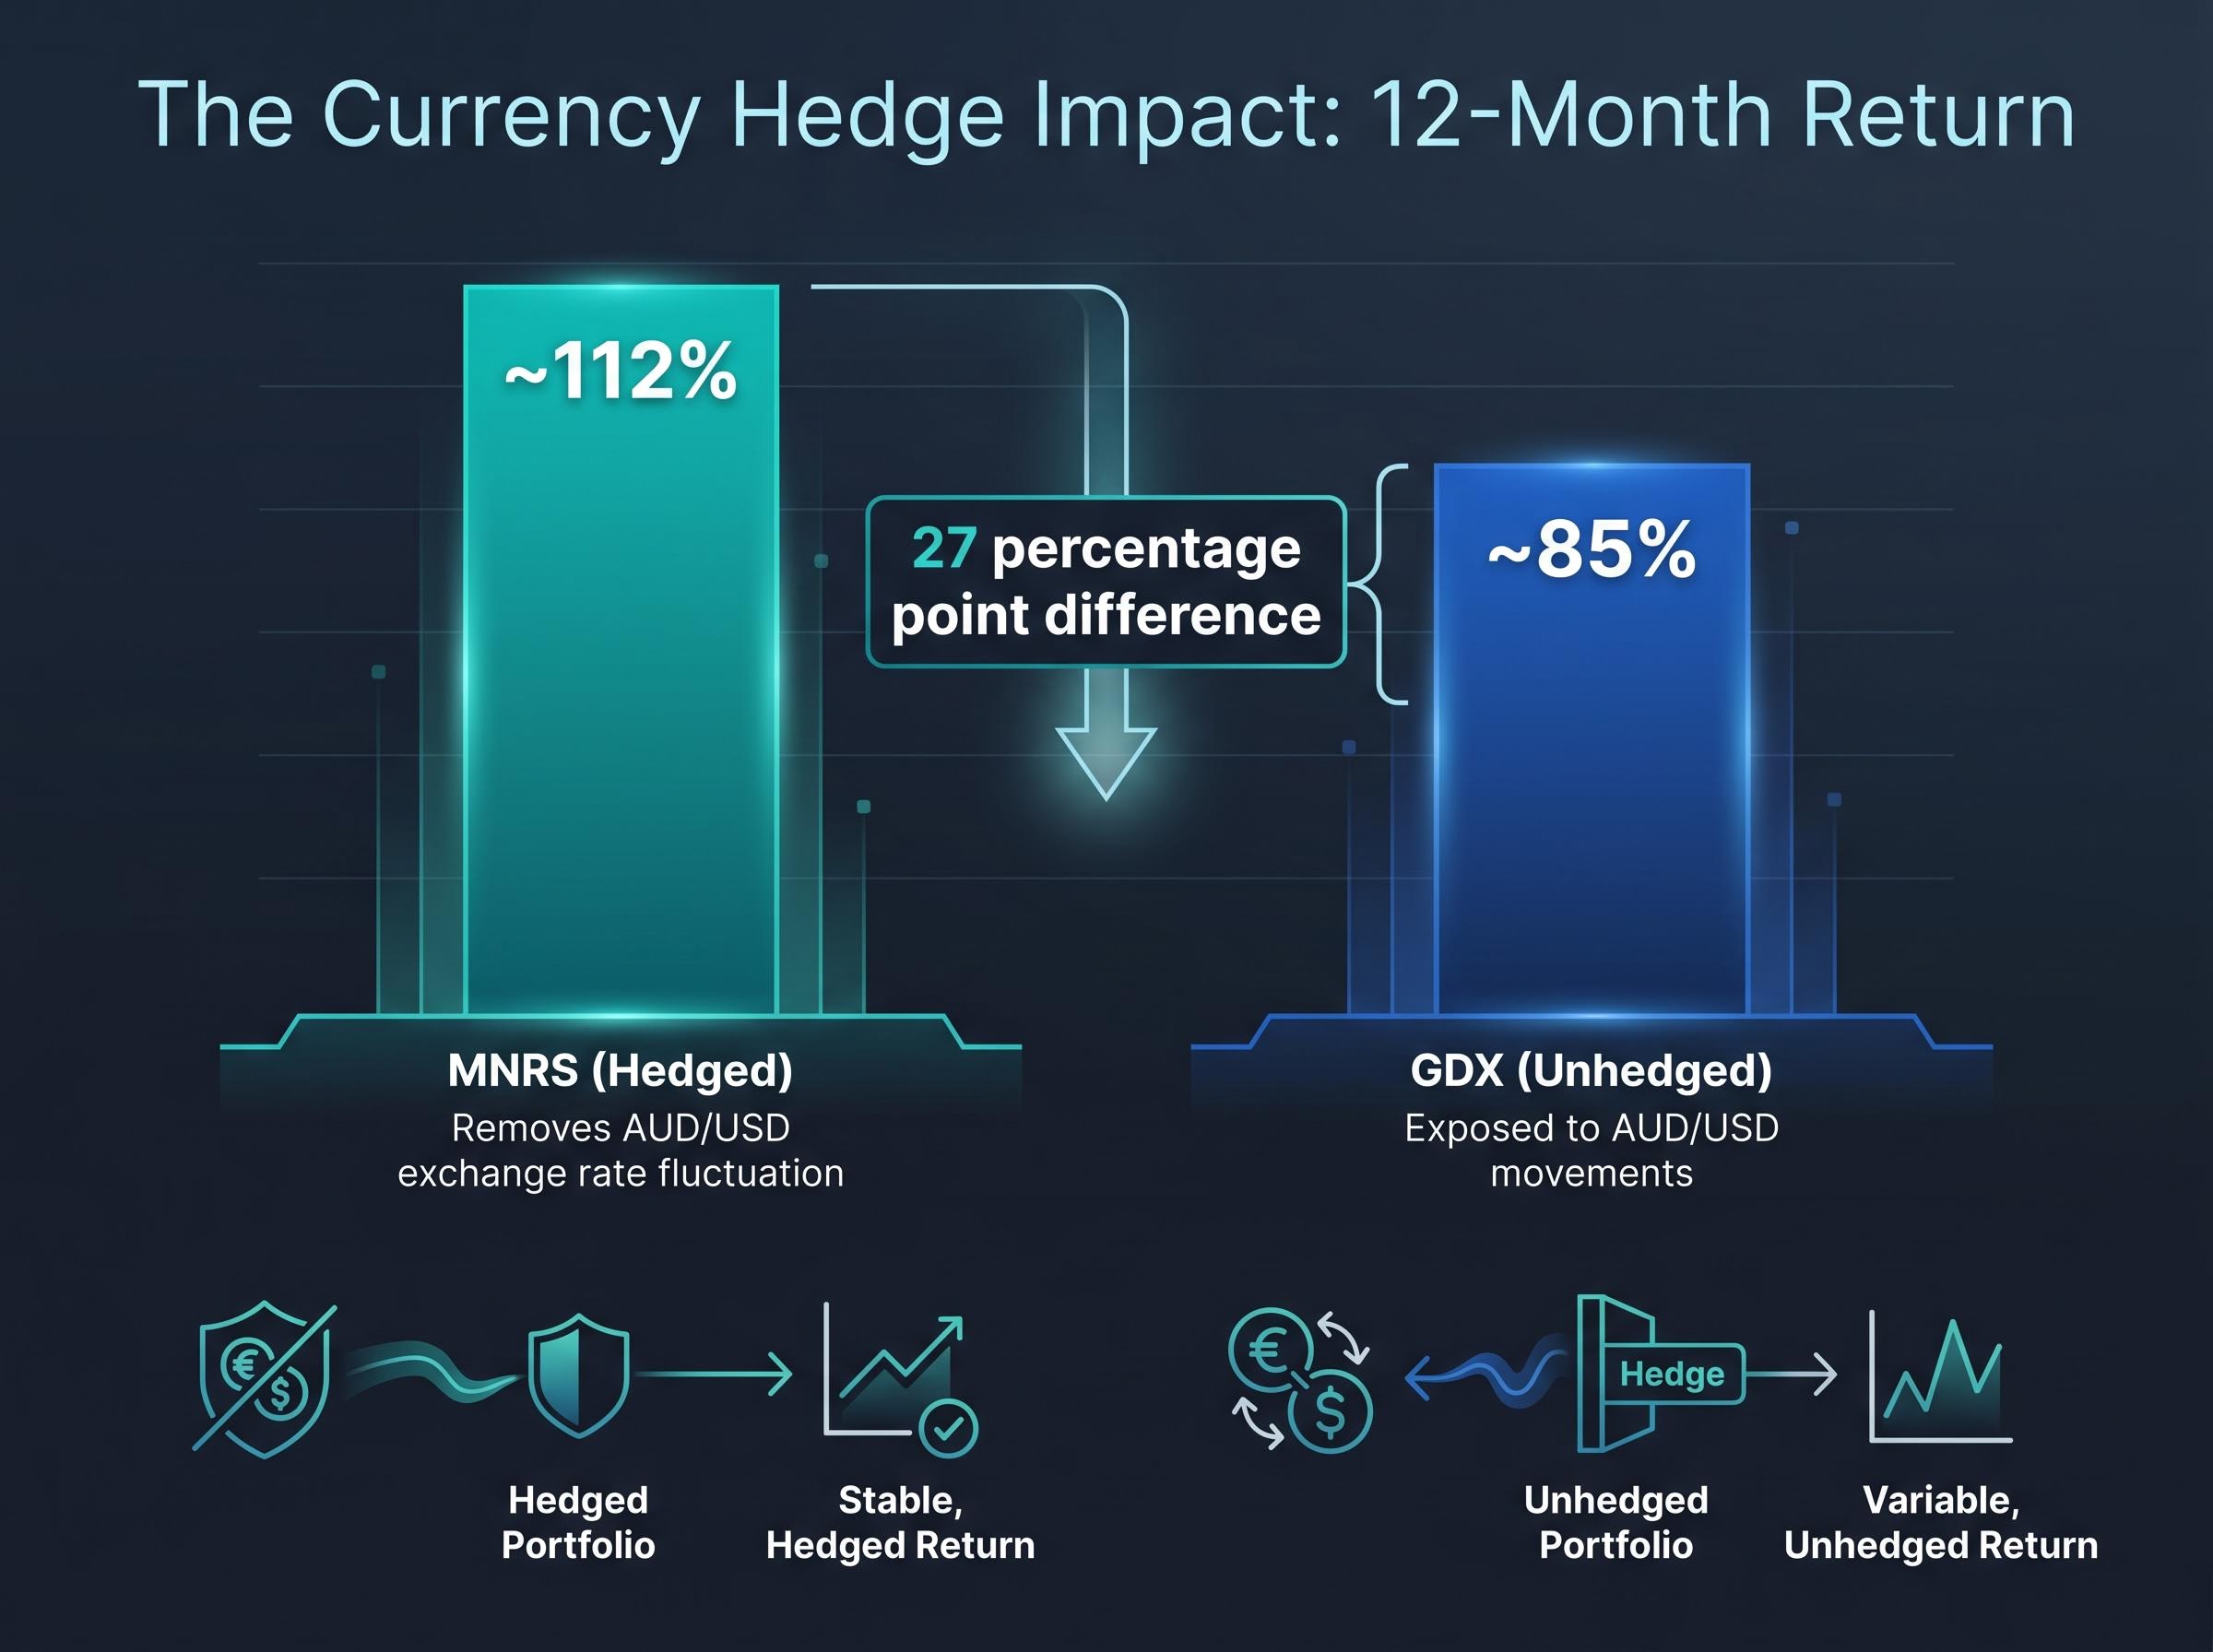
How the currency hedge changes the return profile
The hedge removes AUD/USD exchange rate fluctuation from the return equation. When the Australian dollar weakens against the US dollar (or the USD strengthens), an unhedged investor gets a currency tailwind. But a hedged investor has already locked in the conversion, meaning the return more closely tracks the underlying equity performance in USD terms.
During this period, the AUD/USD dynamic worked in MNRS holders’ favour. The hedging structure amplified returns for Australian investors relative to what an unhedged equivalent delivered. This mechanism also works in reverse: if the AUD strengthens, MNRS holders forgo the currency benefit that unhedged GDX investors would receive.
The performance gap between hedged and unhedged ETF strategies became one of the defining return differentials of early 2026, with the AUD’s appreciation from approximately 0.6777 in January to around 0.7153 by late April creating measurable divergence between funds that locked in the conversion rate and those that left currency exposure open.
Key differences between MNRS and GDX:
- Currency exposure: MNRS is hedged; GDX is unhedged
- Management fee: MNRS charges 0.57% p.a. plus recoverable expenses capped at 0.10% p.a. (total up to 0.67% p.a.); GDX charges 0.53% p.a.
- FUM: MNRS holds A$385 million versus GDX’s A$2.10 billion, meaning wider bid-offer spreads and less liquidity
- Benchmark: MNRS tracks the Nasdaq Global ex-Australia Gold Miners Hedged AUD Index; GDX tracks the VanEck Gold Miners Index
In June 2025, BetaShares updated hedging counterparties and improved derivatives disclosure for MNRS. No structural change was made to the fund’s investment objective or legal structure.
No. 1: Physical platinum bullion ETF (ASX: ETPMAG), up approximately 132% in 12 months
Platinum spent a decade underperforming gold and silver. While gold doubled, tripled, and kept climbing, platinum sat in a range that made it feel forgotten. Industrial metal, not monetary metal. Too niche for the safe-haven flows, too small a market for institutional momentum.
Then three demand drivers arrived at once.
- Auto-catalyst demand recovery in emerging markets. Tightening emissions standards in China and India lifted platinum loadings per vehicle, pulling physical demand higher.
- Hydrogen and fuel-cell applications. The IEA’s Global Hydrogen Review 2025 noted growing platinum-group metal demand in PEM (proton exchange membrane) electrolysers, with multiple project announcements across Europe and Asia reinforcing medium-term demand.
- Jewellery substitution from gold. As gold hit record highs, consumers in India and China shifted toward platinum on relative value grounds. Saxo Bank’s Ole Hansen noted this substitution dynamic in his early-2026 precious metals outlook.
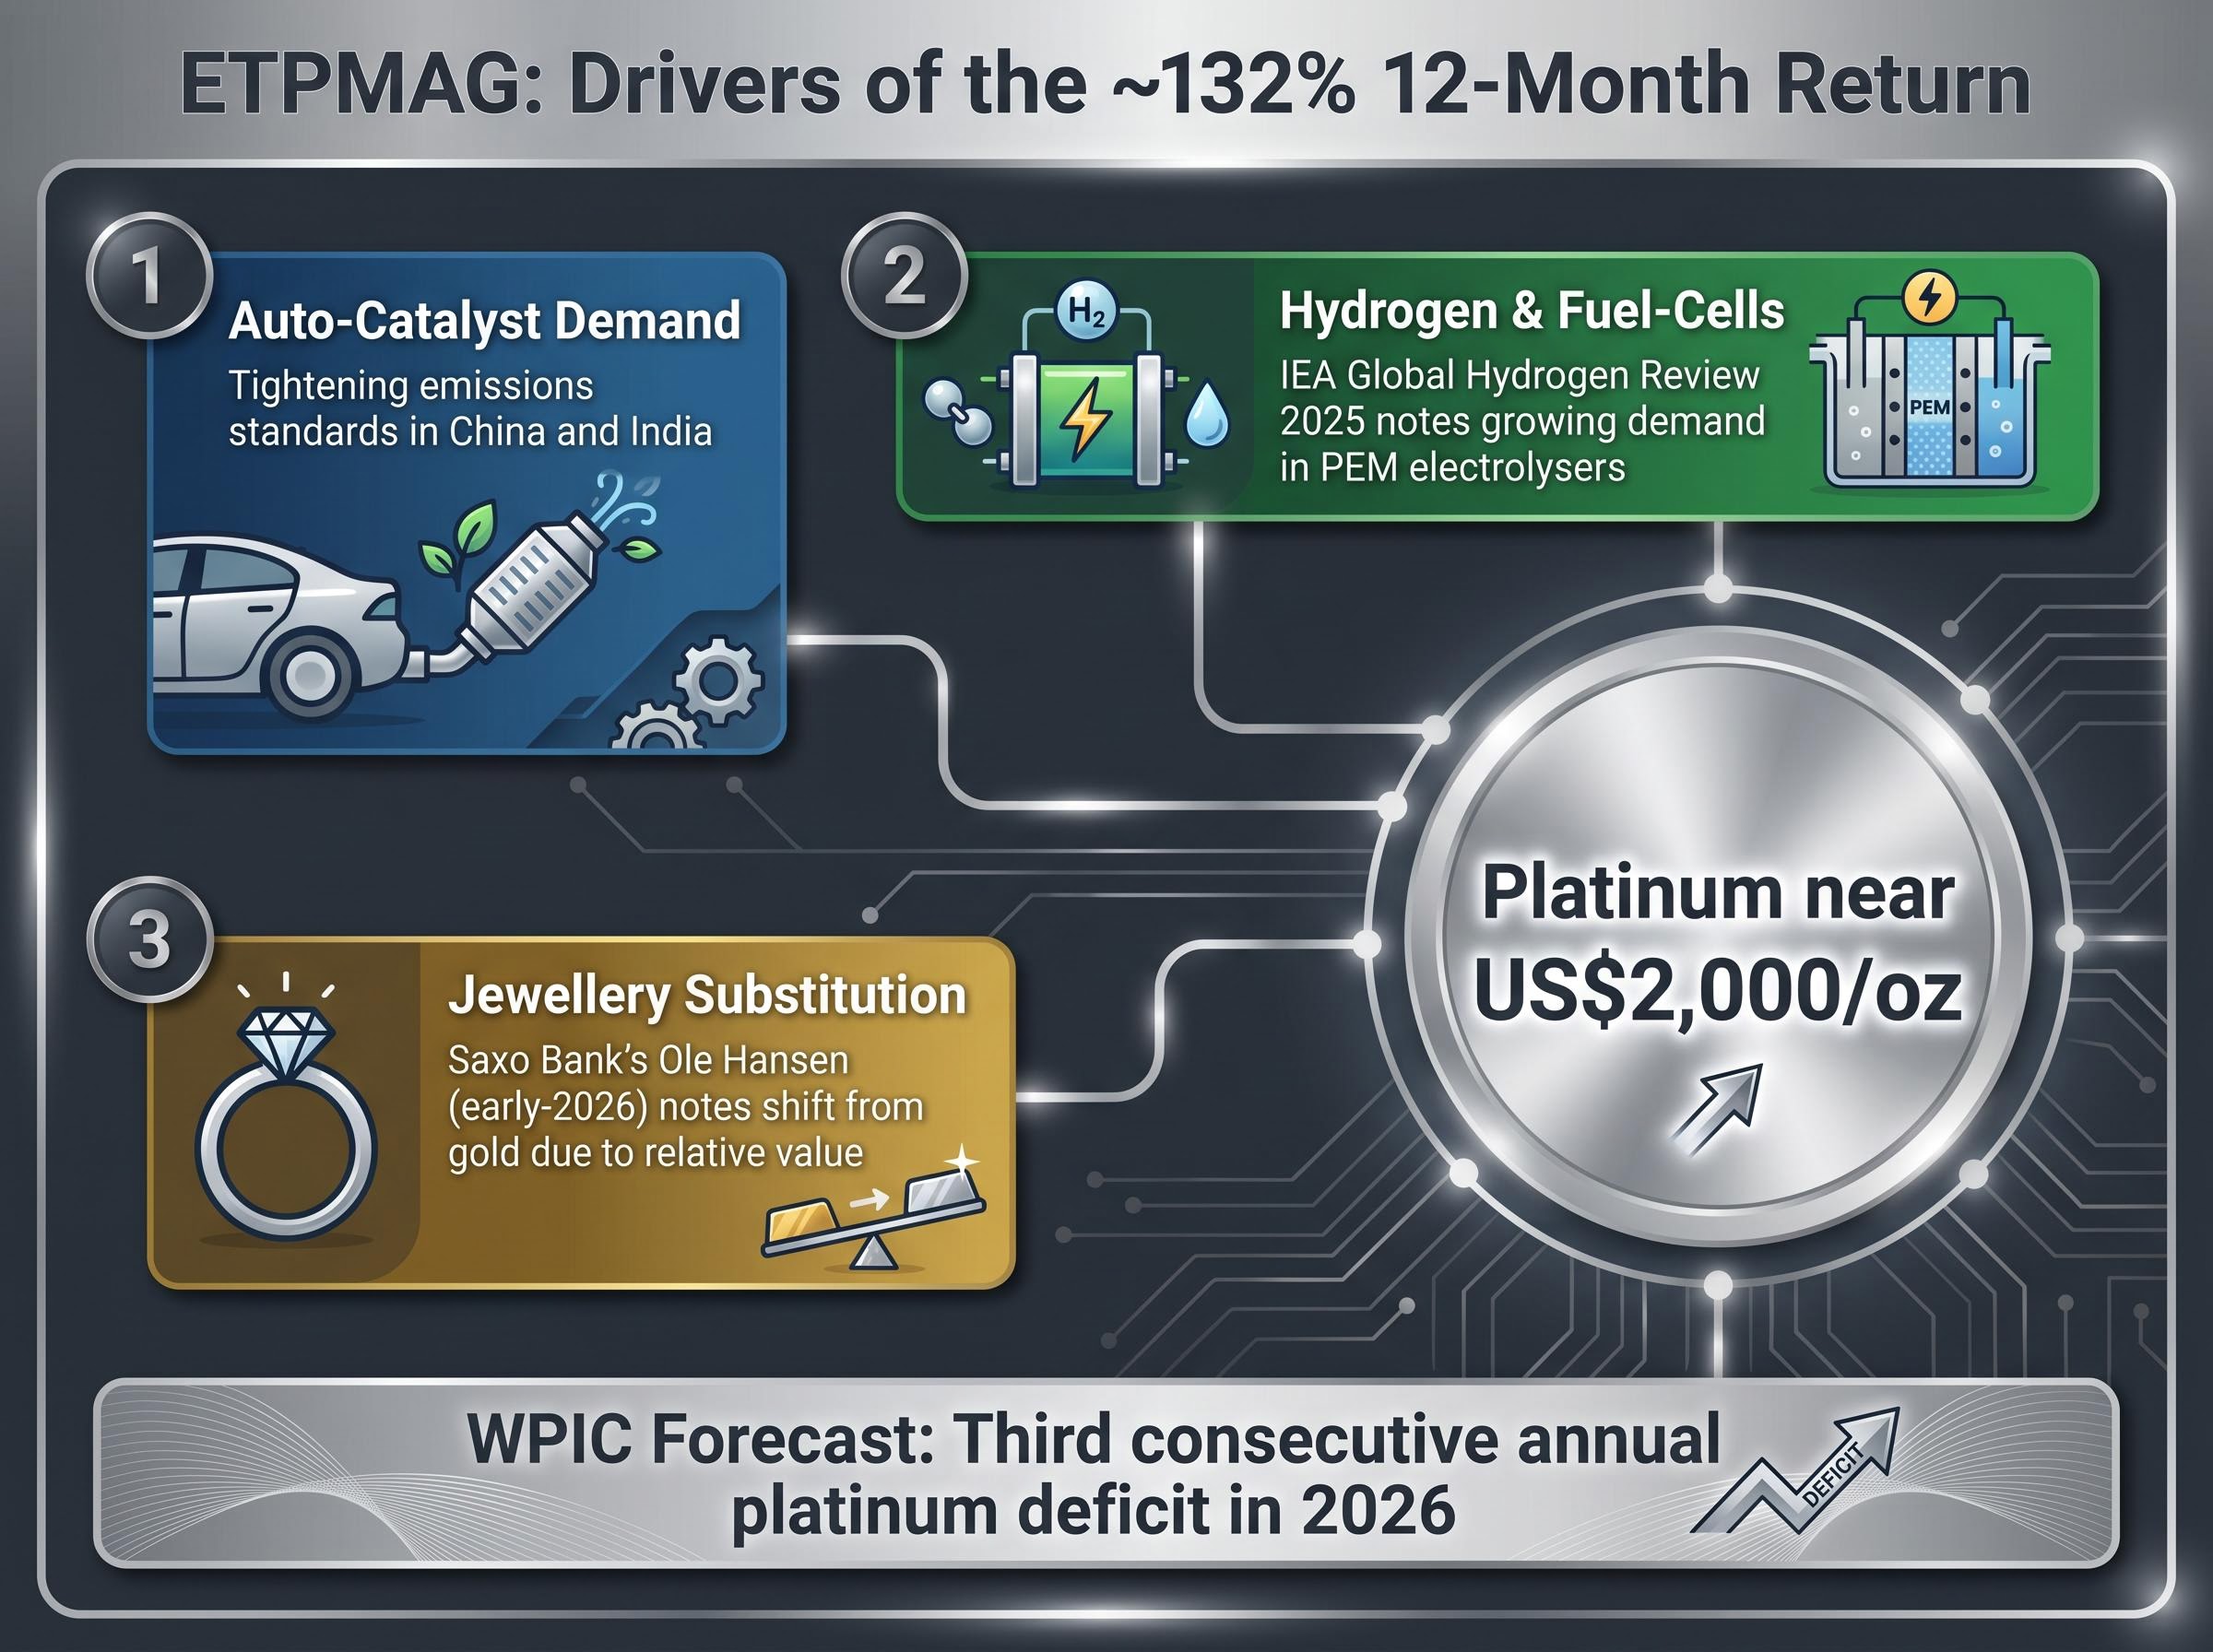
The World Platinum Investment Council forecast a third consecutive annual platinum deficit in 2026, driven by constrained South African supply and strong industrial demand.
The WPIC Platinum Quarterly Q4 2025 revised its 2026 deficit forecast to 240 koz, the fourth consecutive annual shortfall, citing constrained South African mine output and accelerating industrial demand as the primary drivers of the supply gap.
On the supply side, South African platinum mines, which account for the majority of global output, faced persistent power outages and safety issues that capped production growth. The deficit was structural, not temporary.
ETPMAG is a physically backed product holding allocated platinum bars in London vaults via JPMorgan Chase Bank as custodian, meeting LPPM Good Delivery standards. The return tracks spot platinum directly minus the 0.49% p.a. management fee, with no mining company operational risk embedded. At A$215 million in FUM, it is the smallest of the three funds, which carries liquidity implications discussed below.
That purity cuts both ways. There is no operating leverage upside from miner margins expanding, but there is also no mine cost blowout risk. The 132% return was spot platinum’s move, clean and direct.
What Australian investors need to weigh before buying in
Returns of 85% to 132% in 12 months can make any asset look like a must-own. The same structural features that produced those gains are precisely what makes these funds capable of painful reversals.
GDX and MNRS risks:
- Operating leverage works in reverse. If gold prices plateau or fall, cost inflation (labour, energy) compresses margins disproportionately, and mining equity ETFs can fall harder than the underlying commodity.
- Both funds are concentrated in a small number of large miners, creating single-name risk within the basket.
- MNRS carries the additional risk that AUD strength would erode returns relative to an unhedged equivalent.
Mining cost inflation is not confined to individual project mismanagement; Wood Mackenzie estimates that capex overruns of 40-50% are typical across critical minerals projects, a structural pattern that compresses the operating leverage advantage that makes gold mining equities attractive in rising commodity price environments.
ETPMAG risks:
- Platinum demand is more cyclical and industrial than gold, making it more sensitive to economic slowdowns.
- After a parabolic move, mean reversion risk is elevated. CME Group research noted that platinum’s outperformance may not persist once valuations and positioning normalise.
According to ASIC’s MoneySmart guidance (revised 10 October 2025), thematic and commodity ETFs can be more volatile than broad-market funds and may be unsuitable as core holdings for some retail investors. Livewire Markets’ David Thornton warned in March 2026 that drawdowns in narrow commodity ETFs can exceed 60% peak-to-trough and persist for more than a decade.
ASIC MoneySmart guidance on ETF risks identifies currency exposure, concentration in narrow sectors, and liquidity constraints as key considerations for retail investors evaluating thematic and commodity funds, reinforcing why position sizing relative to a total portfolio is the most practical risk management lever available.
Multiple sources, including Global X, Pacific Precious Metals, and Livewire, characterise these products as satellite rather than core holdings. Position sizing relative to total portfolio remains the most actionable risk management tool available.
Liquidity considerations by fund size
FUM serves as a practical proxy for liquidity in ASX-listed ETFs. GDX’s A$2.10 billion meaningfully reduces execution risk relative to MNRS at A$385 million and ETPMAG at A$215 million. During volatile periods, bid-offer spreads on smaller ETFs can widen sharply.
Investors in smaller commodity ETFs should check live bid-offer spreads before transacting, particularly in stressed market conditions, and consider using limit orders rather than market orders.
The performance window is real, but the entry point has changed
The macro conditions underpinning these returns remain in place as of mid-May 2026. Central bank gold buying continues at pace, uranium supply remains tight, and platinum deficits are forecast to persist. But prices have already moved materially, which means the risk-reward calculation looks different for new entrants than it did 12 months ago.
The structural differentiators are clear. ETPMAG offers clean physical platinum exposure with the lowest fee at 0.49% p.a., free of mining operational risk. MNRS provides currency-hedged gold mining equity leverage for investors who want to remove AUD/USD volatility from the equation. GDX is the largest, most liquid gold mining equity vehicle on the ASX, with the tightest spreads and broadest accessibility.
Investors considering these products should have a view on the commodity cycle’s duration and be prepared to hold through significant drawdowns, rather than chasing recent performance as a signal of future returns.
Investors wanting to stress-test the bull case against its failure conditions will find our full explainer on whether this mining ETF surge is a supercycle or a crowded trade, which examines mining company valuations relative to the 2008-2010 boom, institutional positioning data, and the four demand pillars underpinning the optimistic scenario alongside China demand risk and Eurozone growth headwinds.
This article is for informational purposes only and should not be considered financial advice. Investors should conduct their own research and consult with financial professionals before making investment decisions. Past performance does not guarantee future results.