Brent Hits $110 as Hormuz Closure Fuels 10% Inflation Risk
1 hr ago

The US stock market outlook for the week ahead hinges on a collision of forces that, until Friday, the market had managed to absorb. S&P 500 futures opened Sunday evening at 7,413.75, down roughly 0.3%. Nasdaq 100 futures slipped 0.4% to 29,119.75. Dow futures fell 0.4% to 49,436.0. All three pointed toward a cautious Monday open, the first since a seven-week winning streak ran into a wall of $102 oil and 10-year Treasury yields at 4.604%. These are not isolated data points. They are the two inputs that, in combination, most directly threaten the conditions underpinning the rally. What follows connects those macro dots: why triple-digit oil amplifies inflation risk, how that constrains the Federal Reserve’s rate-cut calculus, and what the resulting dual headwind means for the S&P 500’s path through the rest of May.
Seven consecutive weekly gains is a streak that demands respect. Both the S&P 500 and the Nasdaq reached all-time highs during the week ending 16 May 2026, a run built on post-summit trade optimism, AI-fuelled tech momentum, and expectations of eventual Fed easing.
Then Friday happened. The session’s closing declines broke the calm:
Sunday’s futures readings, with all three indexes sliding between 0.3% and 0.4%, offered the market’s first weekend verdict. The question is whether Friday marked a healthy correction within a durable trend, or the opening act of something more sustained.
VIX: 18.43, up 6.78% The CBOE Volatility Index rose nearly 7% on Friday, its sharpest single-session move in weeks. At 18.43, it remains below panic territory, but the direction signals that the complacency underpinning the rally is starting to erode.
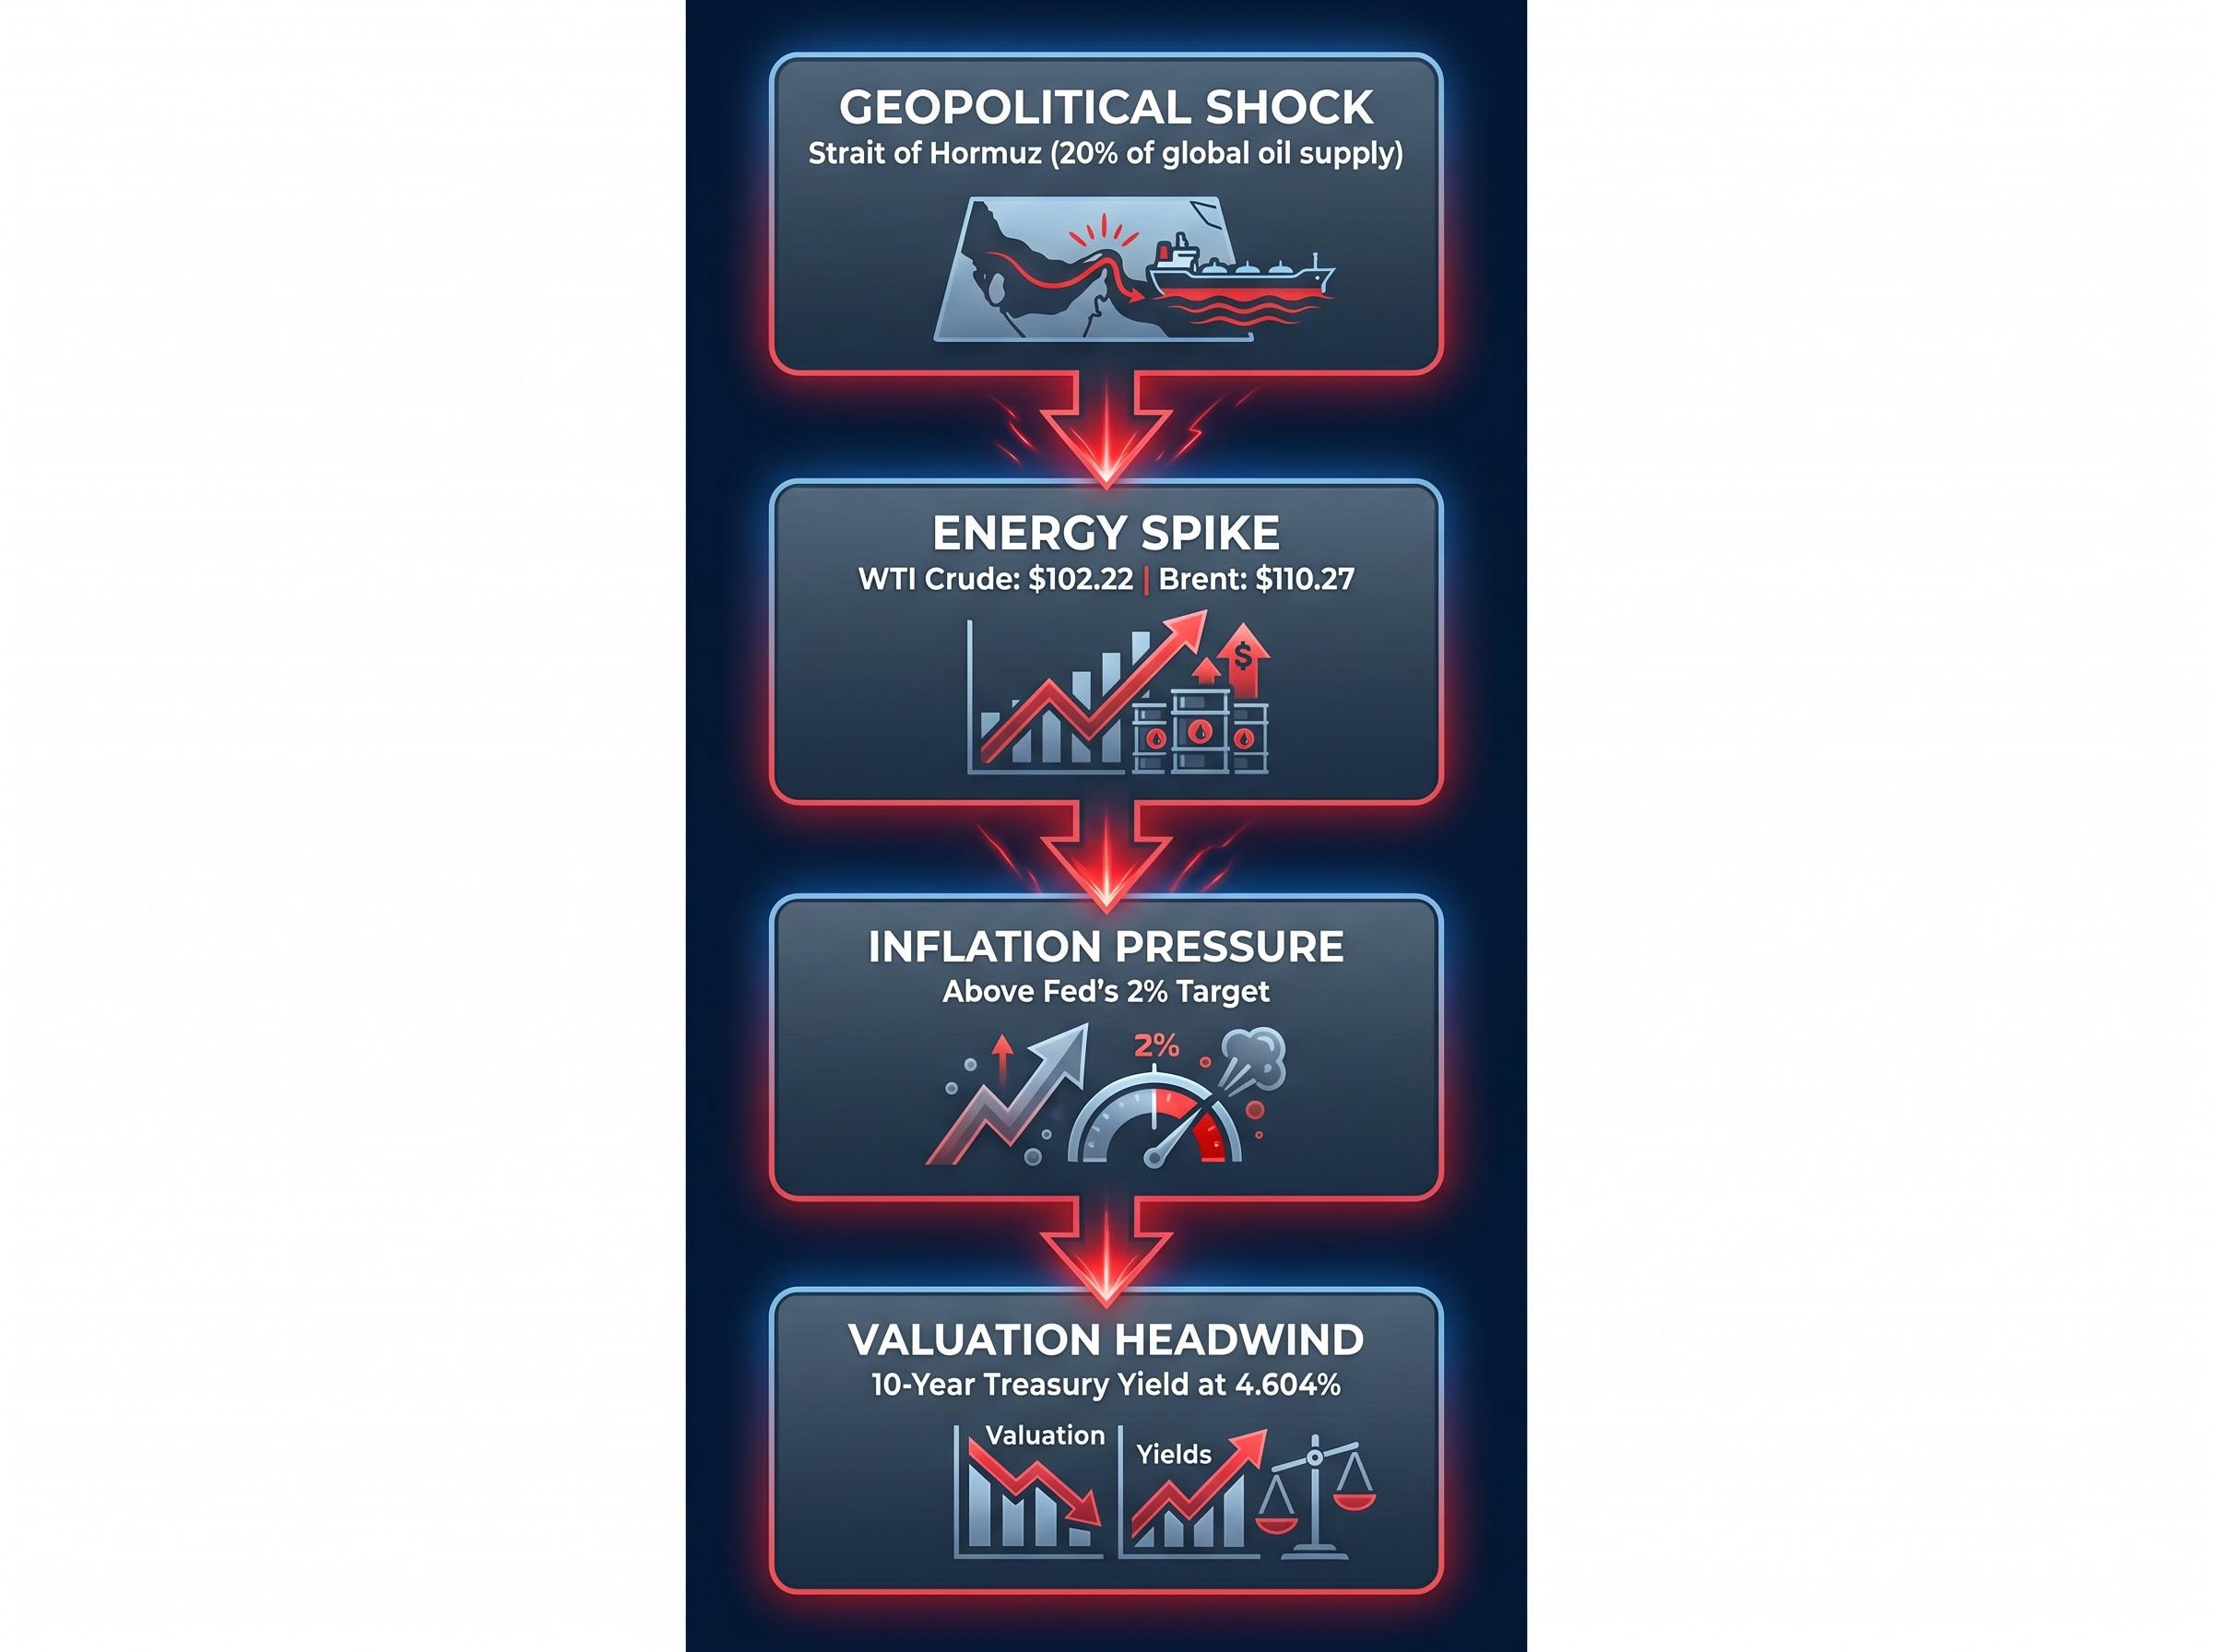
The Strait of Hormuz is not an abstraction. Roughly 20% of global oil supply transits this narrow waterway between Iran and the Arabian Peninsula, making any disruption a direct input into global energy prices rather than a headline confined to geopolitics desks.
On Sunday 17 May, President Trump posted a warning on Truth Social addressing the situation directly. Axios reported that a national security meeting has been scheduled for Tuesday 19 May to assess the administration’s options. Neither development suggests a rapid resolution.
The disruption is more structurally entrenched than a standard geopolitical spike: the Hormuz triple lock, combining US naval blockade operations, Iranian toll enforcement, and the near-total withdrawal of commercial war risk insurance, means commercial tanker traffic cannot simply resume the moment a ceasefire is announced.
Trump’s Truth Social warning on 17 May represented the weekend’s single most market-moving statement, and its tone suggested escalation rather than de-escalation remains the base case for Washington’s posture.
The price of crude at the wellhead does not stay there. WTI futures at $102.22 per barrel (up $1.20, approximately 1.19% as of 18 May) and Brent at $110.27 (up $1.01, approximately 0.92%) feed directly into retail gasoline prices, which raise freight costs, which increase the price of goods sitting on warehouse shelves, which push services costs higher as businesses pass through input inflation.
This transmission is not theoretical. An above-forecast inflation print released during the week ending 16 May confirmed that price pressures were already running hotter than expected before the latest leg of the oil spike extended.
That above-forecast inflation print had already narrowed the Fed’s room to ease before WTI breached $100. The arithmetic is straightforward. Energy prices feed into headline Consumer Price Index readings. Elevated headline inflation lifts inflation expectations among consumers and businesses. Rising expectations make it politically and analytically difficult for the Fed to cut rates without risking a second inflation wave, precisely the outcome the central bank spent 2022-2024 fighting to prevent.
The FOMC dissent at the April rate decision already reflected this tension before the latest leg of the oil spike: PCE running at 3.5% against a 2% target, unemployment rising to 4.3%, and a four-way split on the committee created a dual-mandate conflict that the current rate-setting framework is not designed to resolve cleanly.
The yield curve reflects this logic. Current Treasury yields tell a consistent story:
| Maturity | Yield | Implication |
|---|---|---|
| 5-Year | 4.265% | Markets pricing sustained restrictive policy through the medium term |
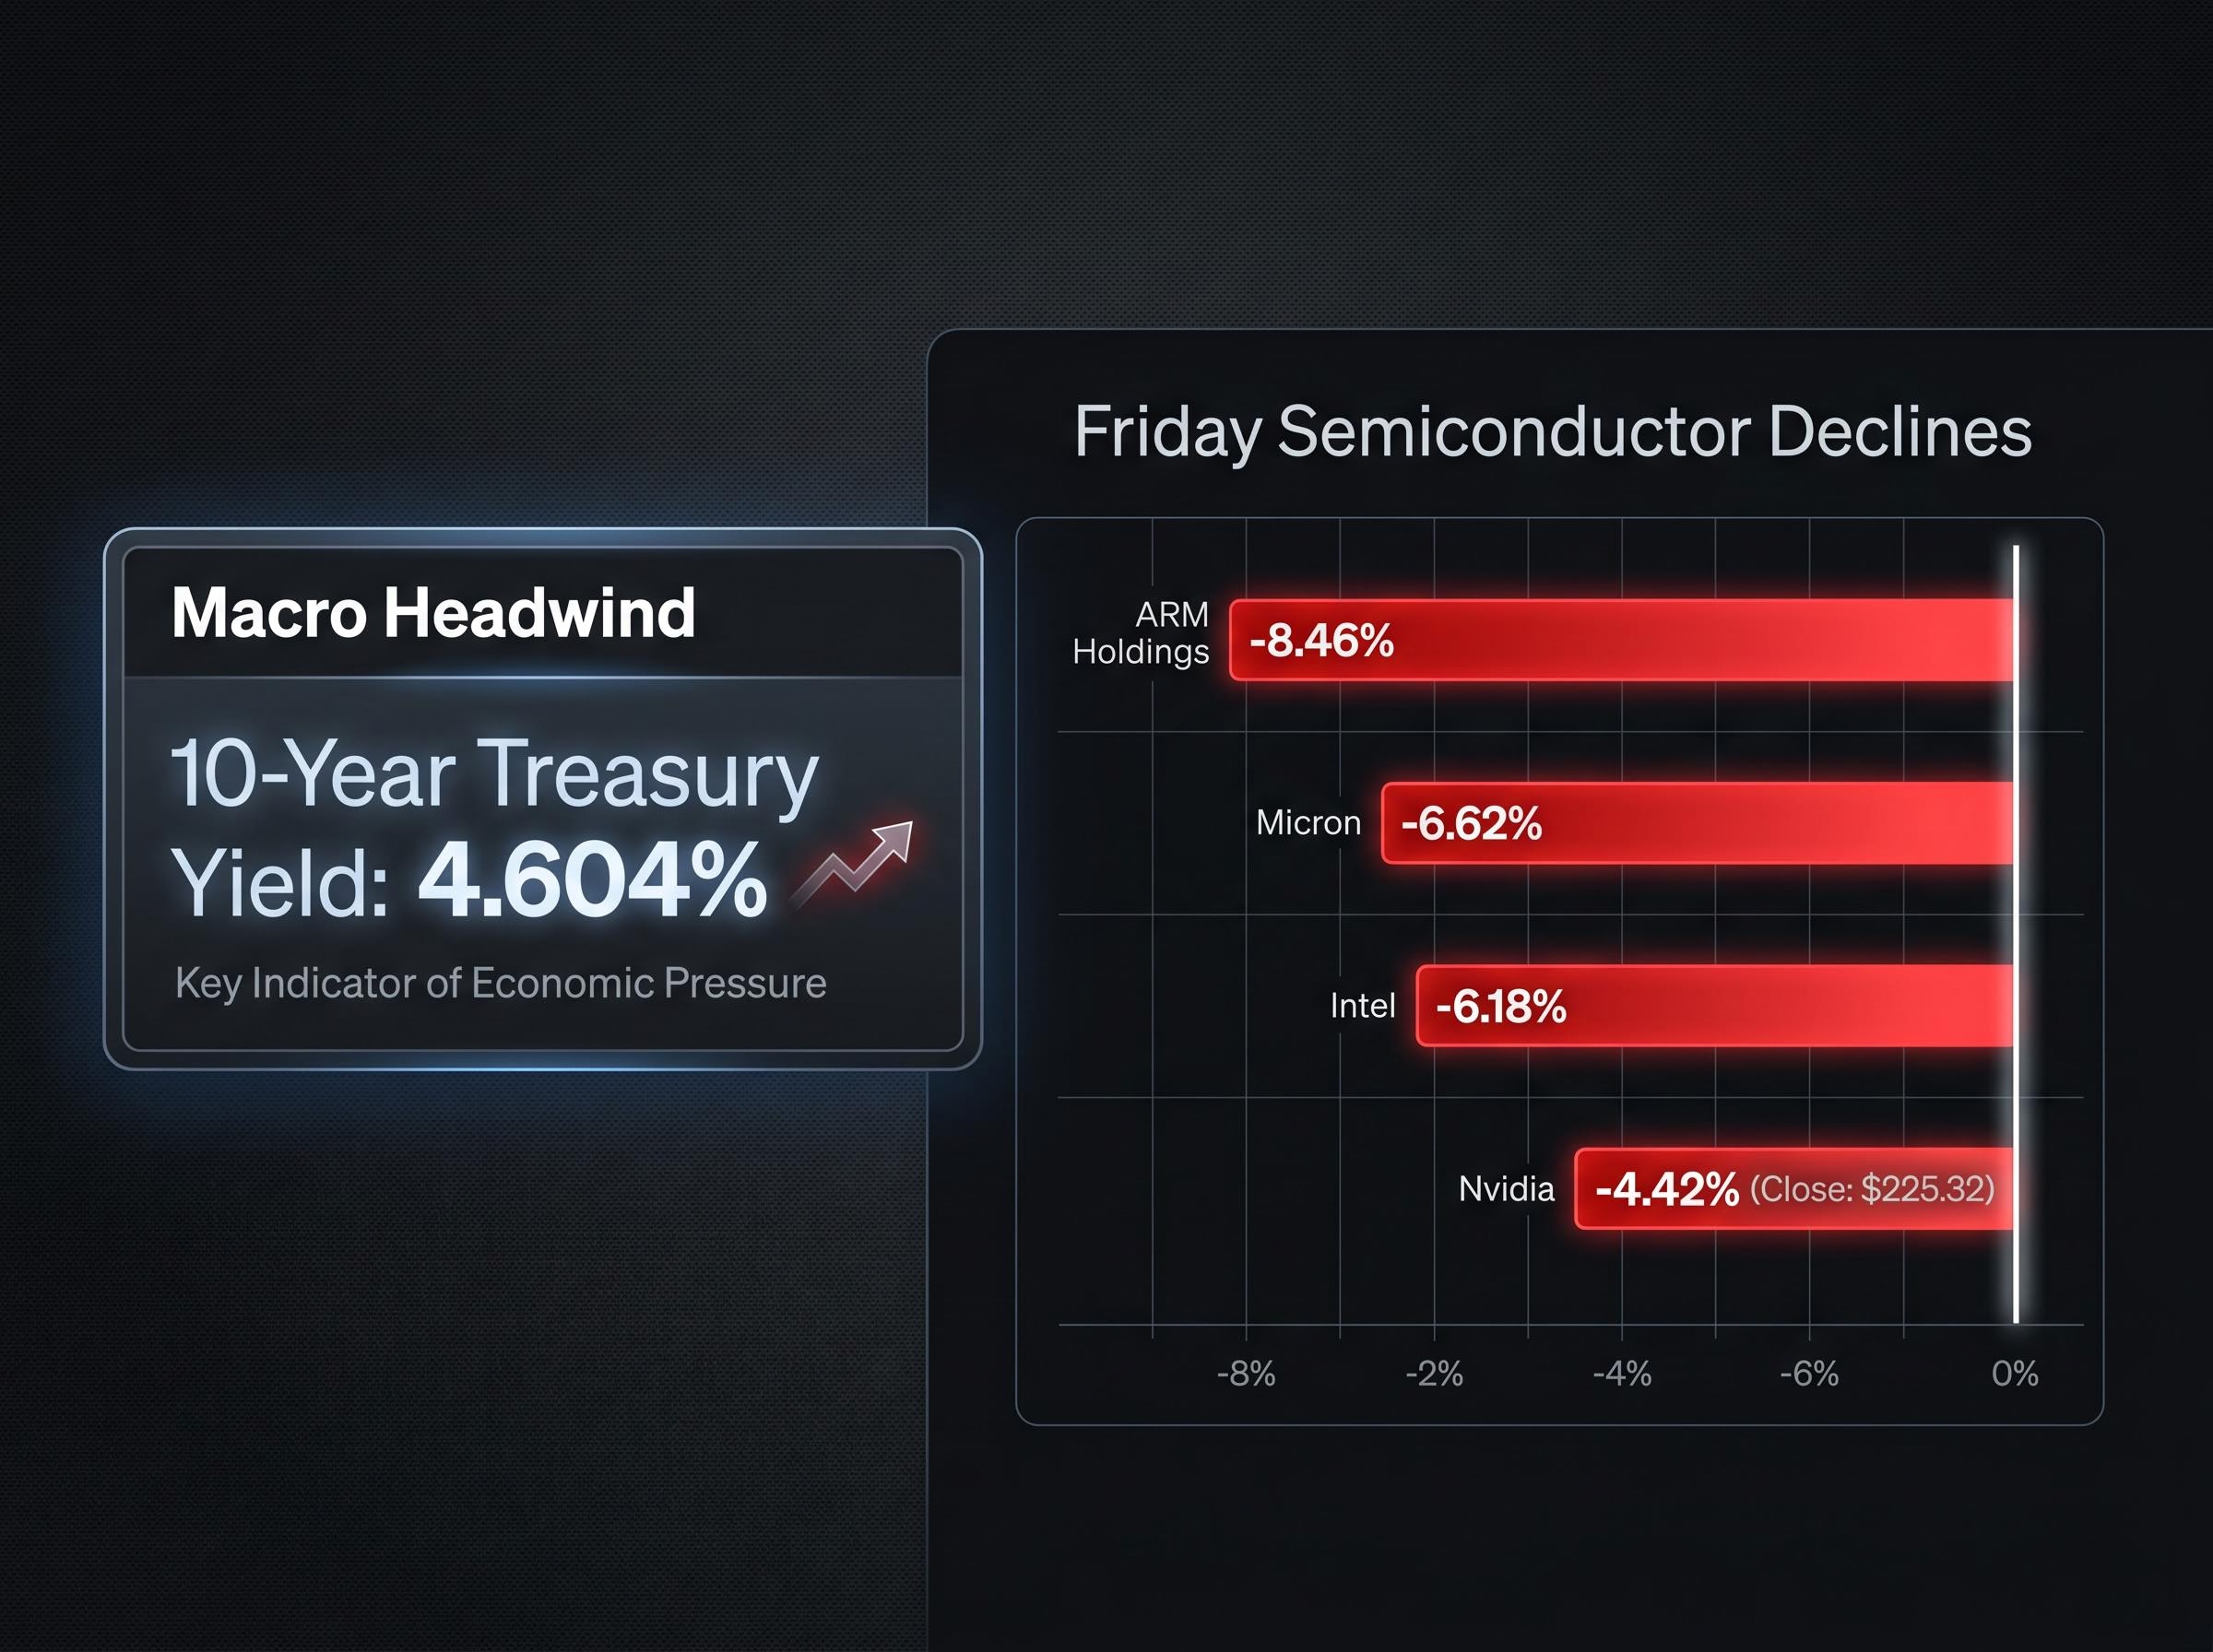
| 10-Year | 4.604% | Reinforces higher-for-longer; constrains equity multiples |
| 30-Year | 5.125% | Long-duration assets face persistent valuation pressure |
At these levels, the bond market is telling a clear story: rate cuts in 2026 are not the base case. The oil shock reinforces that signal rather than introducing it.
Not every oil price increase carries the same weight for equities. The difference in May 2026 is context. This spike is landing on top of inflation that was already running above the Fed’s 2% target, not into a low-inflation environment where the central bank has room to absorb an energy shock without changing course.
That distinction matters because it creates a compounding effect rather than an isolated one. The transmission chain runs in four steps:
This is what “dual headwind” means in practice: rising energy costs suppress consumer spending and corporate margins at the same time that elevated yields increase the hurdle rate for equity valuations. APA and OXY were among the top percentage gainers on 17-18 May, evidence that market participants are already repositioning around this framework, rotating into energy beneficiaries while reducing exposure to rate-sensitive growth names.
Macro analysis provides the framework. Two earnings reports this week will test it against corporate reality.
The Nvidia earnings setup heading into Wednesday is more complex than a simple beat-versus-miss binary: options markets are pricing a plus or minus 5.8% single-session swing, the effective whisper number sits above published consensus following pre-earnings upgrades from Goldman Sachs, Citi, and Wells Fargo, and FOMC minutes releasing the same day introduce a macro variable that could override even a strong result by compressing equity risk premiums for high-multiple growth stocks.
The broader semiconductor sector is already flashing caution. Intel fell 6.18%, ARM Holdings dropped 8.46%, and Micron declined 6.62% during Friday’s session, corroborating the view that tech-sector derating is underway before the week’s earnings even arrive.
The seven-week rally was built on three pillars: trade optimism following the Trump-Xi Beijing summit, AI momentum led by Nvidia and the semiconductor complex, and expectations of eventual Fed easing. All three are now under simultaneous pressure. The summit concluded without significant agreements, removing one of the rally’s recent supportive narratives. Semiconductor names are selling off. And the rate-cut timeline is extending, not compressing.
The VIX at 18.43 (up 6.78%) captures the shift in sentiment but does not yet signal capitulation.
The next five trading days compress three macro forces into a single week. The Sunday futures open, with the S&P 500 down 0.3%, the Nasdaq down 0.4%, and the Dow down 0.4%, reflects the market’s current best-estimate weighting of these risks. It is a starting point, not a prediction.
Four events will shape the outcome:
Can a seven-week rally built on optimism survive a week defined by geopolitical risk, yield pressure, and earnings uncertainty arriving simultaneously? The answer will shape the US stock market outlook for the rest of the quarter.
This article is for informational purposes only and should not be considered financial advice. Investors should conduct their own research and consult with financial professionals before making investment decisions. Past performance does not guarantee future results. Financial projections are subject to market conditions and various risk factors.
The dual headwind refers to two simultaneous pressures: oil prices above $100 per barrel raising inflation and suppressing consumer spending, and elevated Treasury yields (10-year at 4.604%) increasing the discount rate applied to equity valuations, which compresses the multiples investors are willing to pay for future earnings.
Roughly 20% of global oil supply transits the Strait of Hormuz, so any disruption pushes crude prices higher, which feeds into retail gasoline, freight costs, and broader goods and services prices. With inflation already running above the Fed's 2% target, sustained high oil prices make it harder for the Federal Reserve to cut interest rates without risking a second inflation wave.
Four events are critical: a national security meeting on the Strait of Hormuz situation on Tuesday 19 May, Nvidia earnings on Wednesday 21 May which will test AI capital expenditure demand, Walmart earnings on Thursday 22 May as a consumer spending stress test, and the ongoing direction of 10-year Treasury yields throughout the week.
The selloff followed a combination of above-forecast inflation data, oil prices breaching $100 per barrel due to the Strait of Hormuz disruption, and rising Treasury yields, all of which together raised concerns that the Federal Reserve would keep rates higher for longer, compressing equity valuations.
A VIX reading of 18.43, up nearly 7% in a single session, indicates that investor complacency built during the seven-week rally is beginning to erode, though the level remains below the threshold typically associated with panic or capitulation in the broader market.