VAS vs VHY: Why the Lower-Yield ETF Wins in Retirement
3 hrs ago

Gold has been setting record highs for much of 2026. Yet on 17 May 2026, spot gold fell to approximately its lowest point since late March, while silver futures shed more than 4% and platinum slipped below $1,973. The contradiction is sharp: a metal that thrives on uncertainty is falling during an active geopolitical conflict. The explanation lies in two converging forces, rising bond yields and a firming U.S. dollar, whose relationship with gold prices is among the most mechanically predictable in commodity markets. What follows breaks down exactly how those forces work, why silver and platinum are falling harder, and what the current environment signals for investors holding precious metals positions.
Gold sits in a portfolio and does nothing. It pays no interest, no dividend, no coupon. For long stretches of the past decade, that was a minor inconvenience. When the U.S. 10-year Treasury yielded 1.5% or less, the income sacrifice of holding gold instead of bonds was negligible.
That arithmetic has changed. The U.S. 10-year Treasury yield stood at approximately 4.60% as of mid-May 2026, with the 30-year yield reaching 5.145% on 18 May. Every dollar allocated to gold rather than Treasuries now forgoes meaningful, risk-free income; this is the opportunity cost that defines gold’s relationship with interest rates.
When bond yields are low, the cost of holding a non-yielding asset is small. When yields approach 4.60%, the cost becomes difficult for institutional allocators to justify, particularly when positioning in gold futures had already become stretched after the earlier rally to record highs.
The global bond yield surge is not confined to U.S. Treasuries; the UK 10-year gilt hit its highest level since 2008 and Japan’s 30-year JGB reached a record on the same week, meaning the opportunity cost headwind pressing on gold is being reinforced by synchronized sovereign selling across three major markets simultaneously.
This mechanism is the foundational reason behind the mid-May selloff. Spot gold declined 1.3% on 17 May, a move driven not by a single headline but by the steady gravitational pull of high-yielding alternatives.
The institutional consensus during mid-May 2026 was unusually unified. Carsten Menke, Head of Next Generation Research at Julius Baer, framed the dynamic directly:
“High U.S. yields are the key headwind for gold, as higher bond income raises the opportunity costs of holding an asset that does not pay interest.”
TD Securities analysts reinforced the point, noting that “each leg higher in the 10-year yield raises the implied carry investors can earn in cash and bonds, reducing the appeal of holding non-yielding bullion.” UBS flagged an additional vulnerability: positioning had become “stretched” after the earlier rally, making gold particularly susceptible to a yield-driven correction at this moment.
The opportunity cost of holding gold explains why investors might sell it. The dollar explains why international buyers stop showing up to replace them.
Gold is priced in U.S. dollars. When the dollar strengthens, the same ounce of gold costs more in local currency terms for buyers in Europe, Asia, and emerging markets. The effect is mechanical: a stronger dollar suppresses international demand regardless of whether those buyers’ fundamental view of gold has changed.
The U.S. Dollar Index (DXY) traded in the 98.8-99.3 range during mid-May 2026, with a reading of approximately 99.28 confirmed for 15 May. While these levels are below the peaks seen during the 2022-2023 tightening cycle, the directional trend and its effect on non-U.S. buyer purchasing power remain a headwind. Reuters noted on 17 May that a stronger dollar “makes gold more expensive for holders of other currencies” and was “adding to the pressure on bullion and the broader precious metals complex.”
For non-U.S. investors, the result is what Bloomberg described as “a double hit of weaker metal prices and unfavourable FX moves.”
| Investor Location | Exposure |
|---|---|
| U.S.-based investor | Spot price decline only |
| Non-U.S. investor | Spot price decline plus unfavourable currency conversion |
This compounding effect means the dollar adds a structurally separate layer of pressure on top of the opportunity cost mechanism. Both arriving simultaneously is more damaging than either one alone.
Silver and platinum are not simply following gold downward. They are amplifying the move, and the reason is structural.
Both metals carry significant industrial demand components. Silver is used in solar panels and electronics; platinum in automotive catalysts and hydrogen fuel cells. This industrial exposure means silver and platinum are sensitive to economic growth concerns that intensify when yields spike, because rising yields can signal tighter financial conditions ahead.
The result is a higher-beta relationship with gold. Silver and platinum tend to fall further than gold during yield-driven selloffs, and the mid-May data confirmed the pattern. Spot silver fell 1.9% to $74.58 per ounce on 17 May, with silver futures dropping 4.18% to $74.305 on 18 May. Spot platinum declined 0.3% to $1,972.05 on 17 May.
The compounding pressures on these metals stack in three layers:
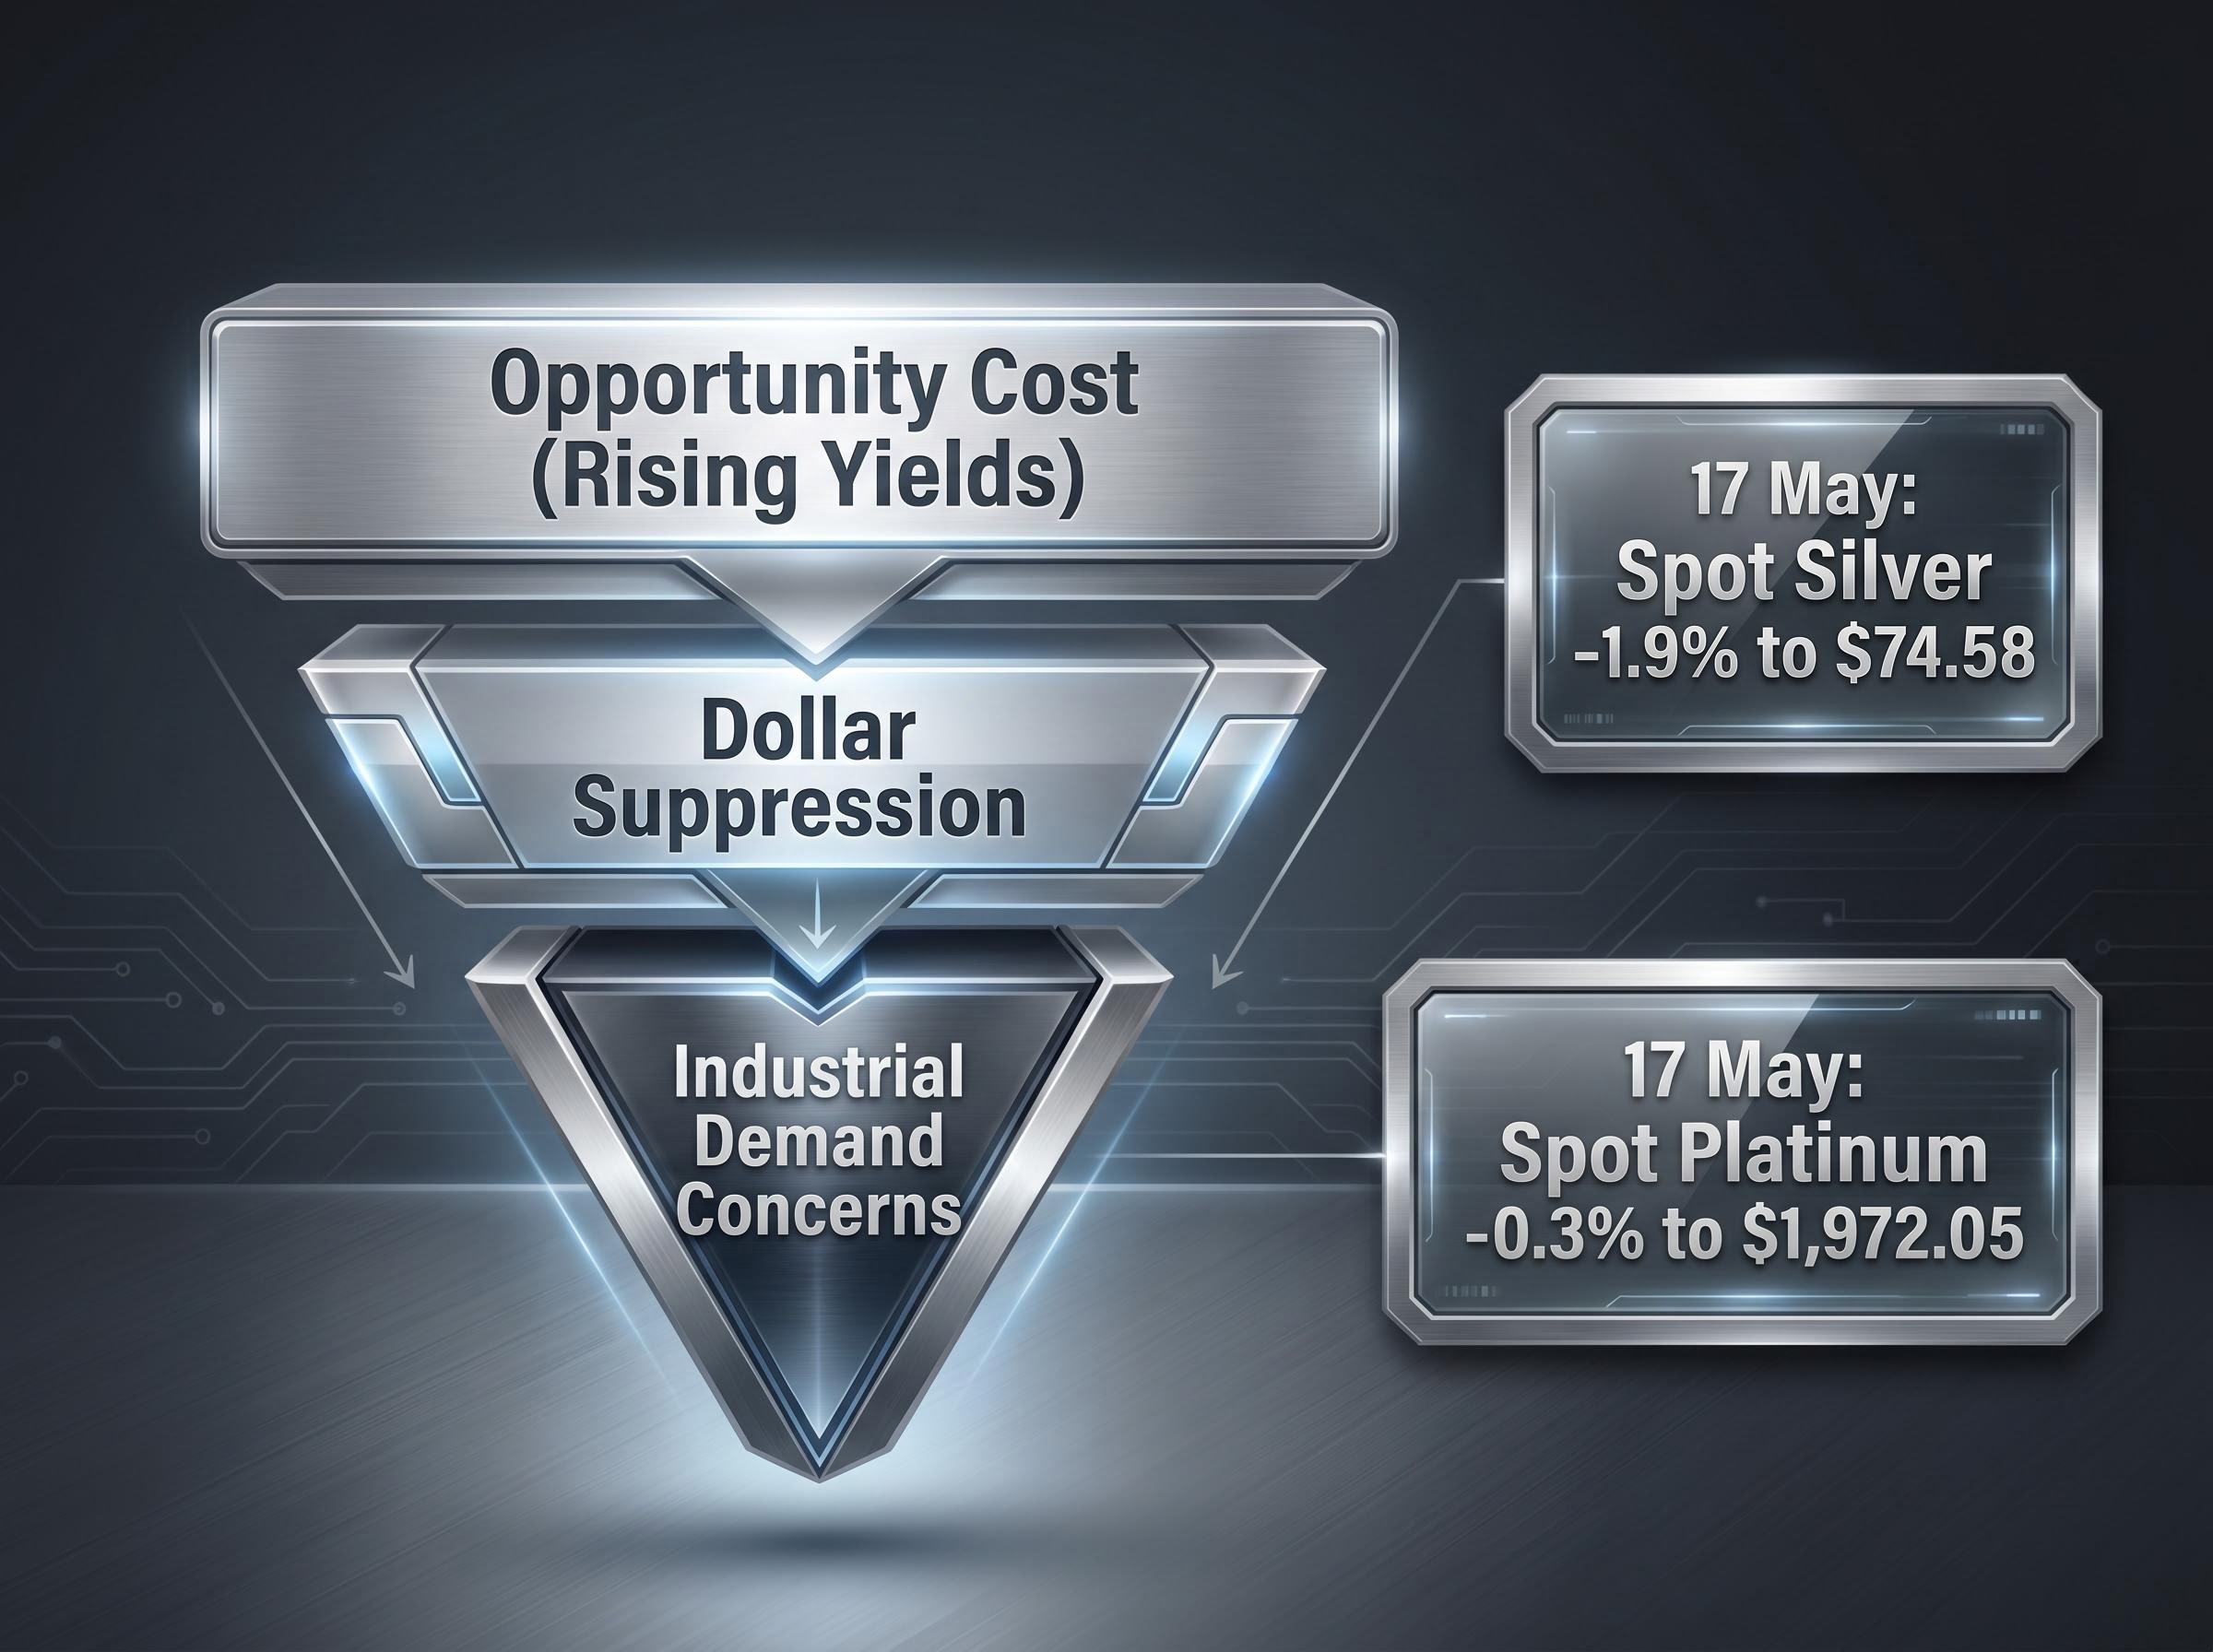
Kitco News reported on 17 May that silver and platinum were “underperforming as industrial-demand concerns re-emerge when the dollar and yields spike together.”
Historical data reinforces the pattern. During the 2013 Taper Tantrum, silver fell more than 35% over the year, according to the Silver Institute, outpacing gold’s approximately 28% decline. Investors who shifted from gold into silver or platinum seeking higher upside should recognise that during yield and dollar pressure episodes, those higher-beta metals tend to deliver larger percentage losses as well.
On the surface, gold should be rising. The Iran-Israel conflict remains active. Broader Middle East tensions persist. Energy prices are elevated, with WTI crude up 3.13% to $104.18 per barrel and Brent crude advancing 2.21% to $111.67 per barrel as of 18 May 2026. These are conditions that have historically driven safe-haven demand for bullion.
Yet gold is falling. The explanation lies in how competing forces interact.
The safe-haven breakdown playing out across gold, government bonds, and the yen simultaneously reflects a structural feature of supply-shock crises: surging oil prices force central banks toward tightening rather than easing, eliminating the monetary tailwind that normally supports defensive assets during periods of elevated geopolitical risk.
Gold’s 2026 rally to record highs was partly built on a geopolitical risk premium, a price component reflecting the market’s assessment of ongoing conflict risk. The World Gold Council noted in April 2026 that “heightened geopolitical risk has clearly played a role in gold’s performance.” By mid-May, that premium was being squeezed.
The forces that should be supporting gold include:
The forces currently overwhelming them include:
Reuters reported on 17 May that “some of that geopolitical premium now appears to be unwinding as investors refocus on higher yields and a stronger dollar.” Kitco News noted that safe-haven flows were “rotating into the U.S. dollar instead of bullion,” a signal that the dollar, not gold, was capturing the risk-off bid.
The energy price dimension adds an ironic twist. Rising crude prices contribute to inflation expectations, which push bond yields higher, which in turn increase the opportunity cost of holding gold. The Iran conflict is, through this indirect channel, adding to the headwinds on gold rather than supporting it.
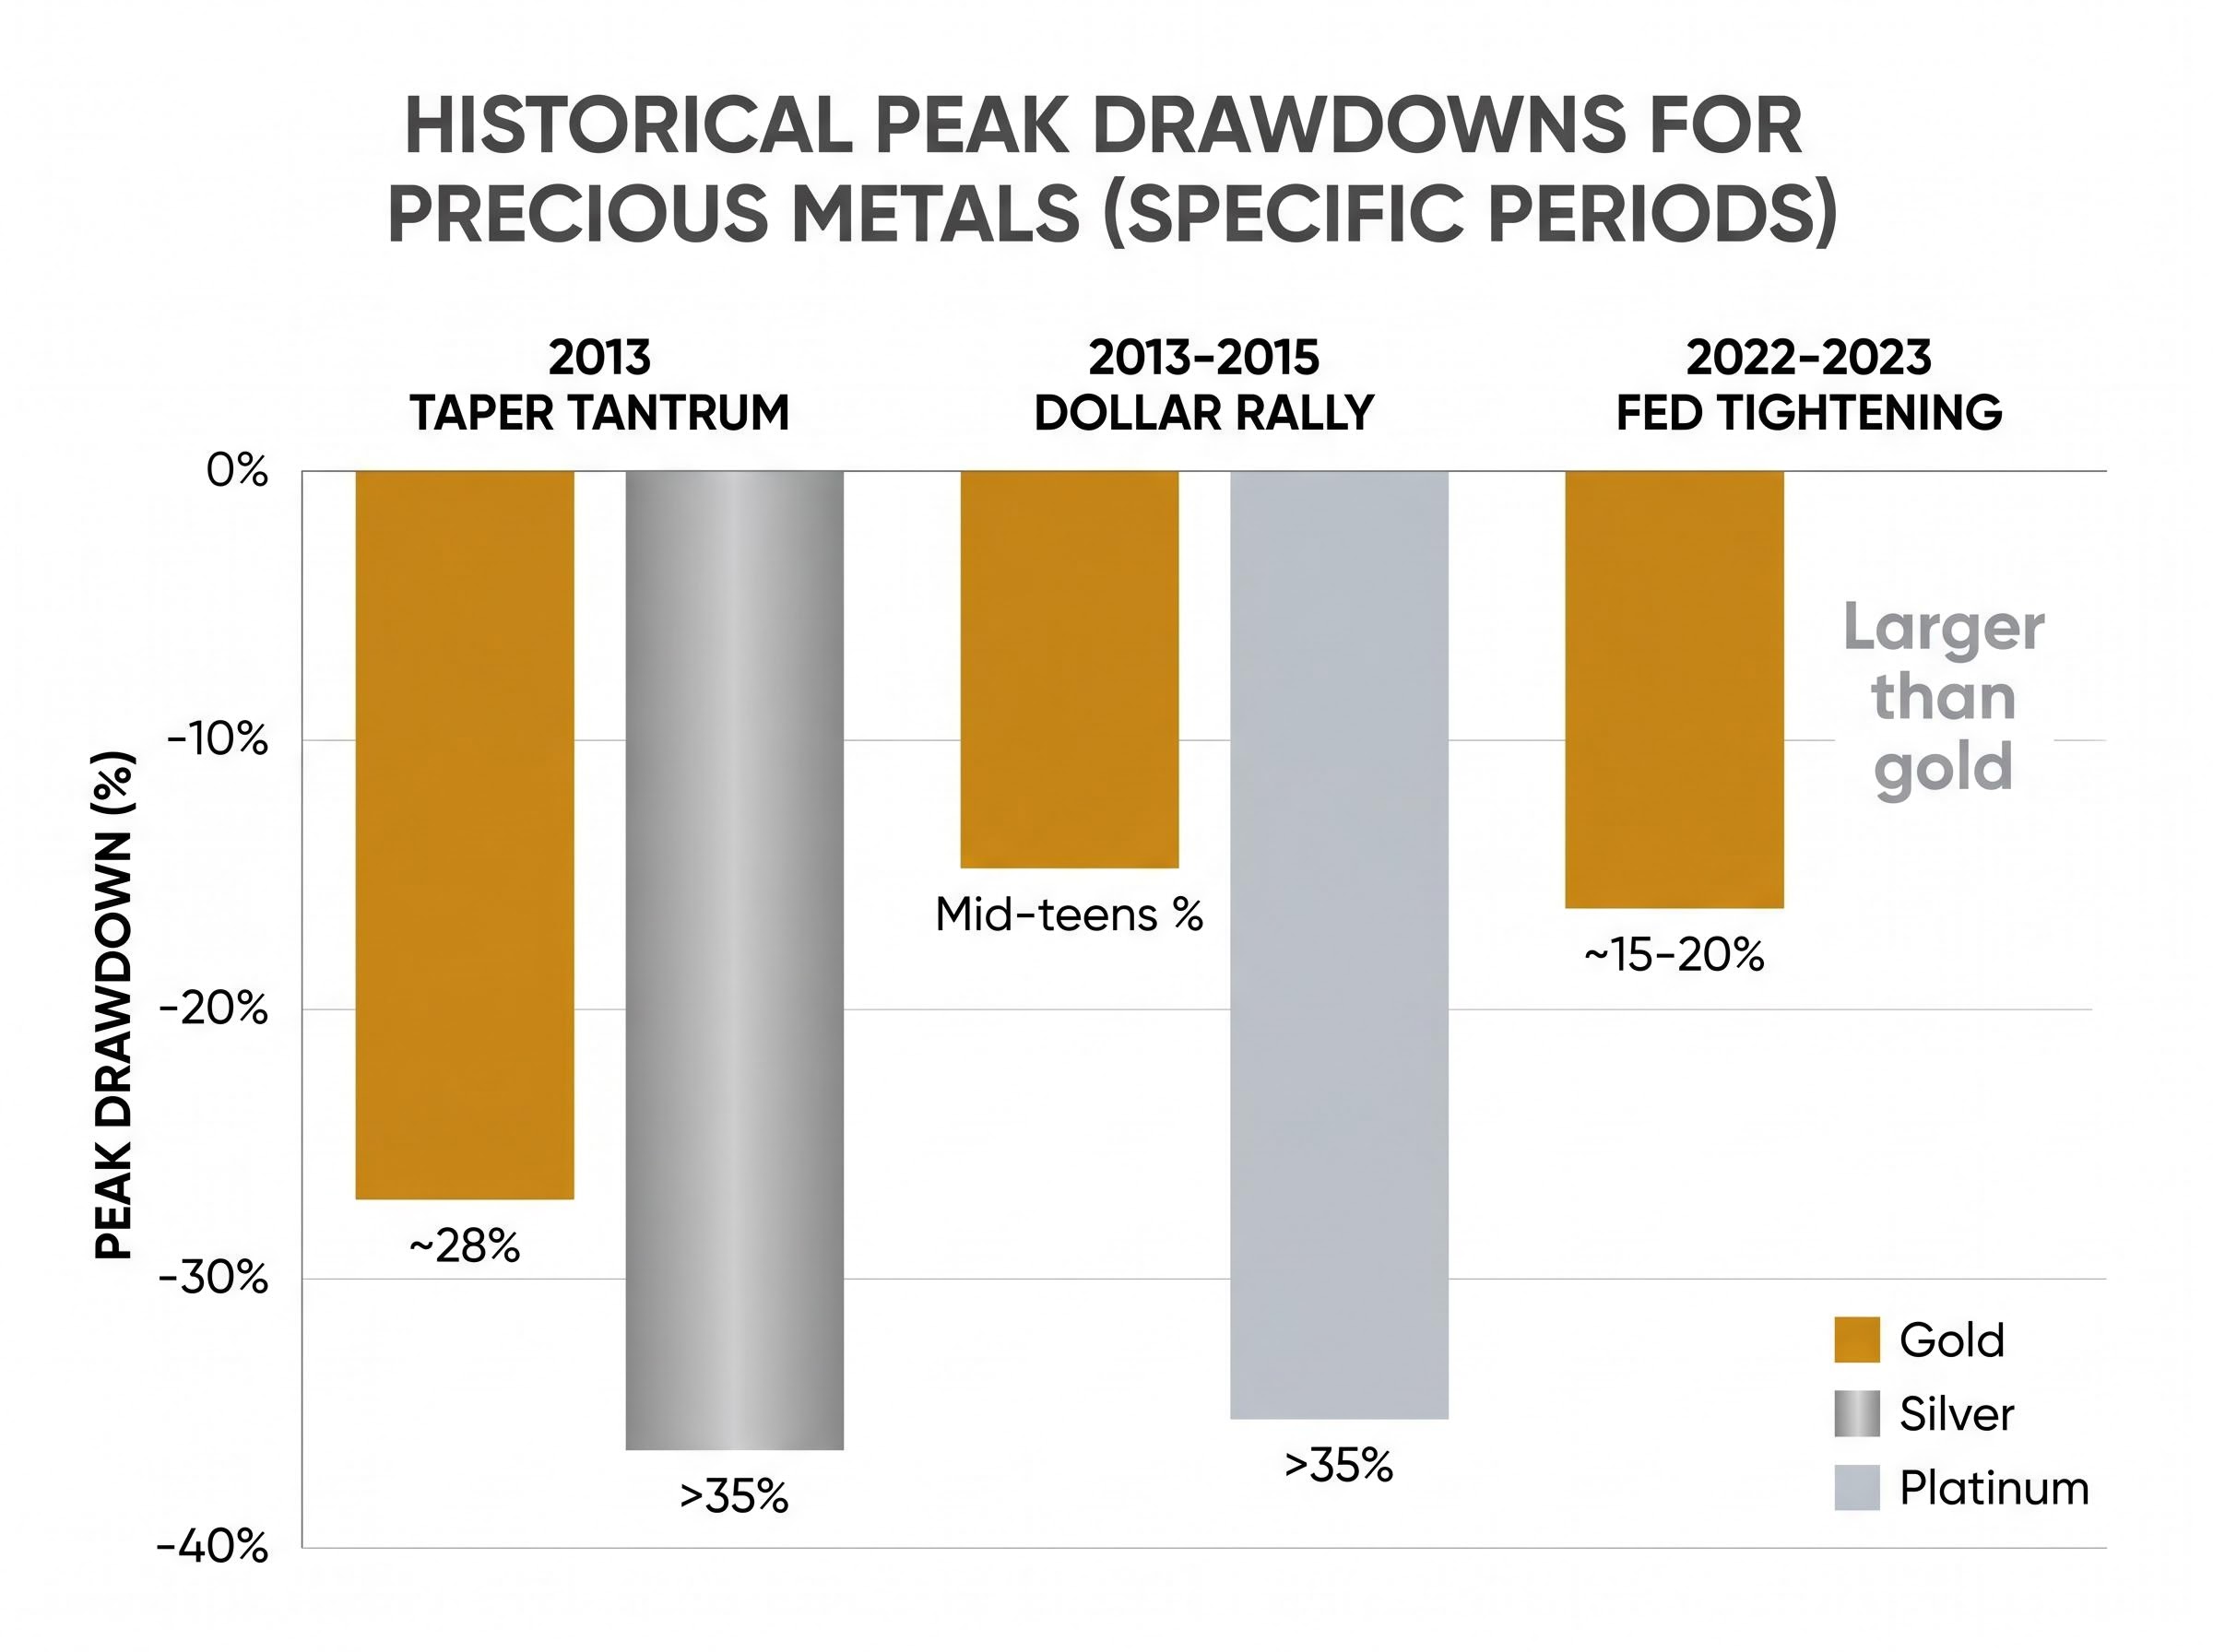
The current episode has well-documented precedent. Three historical periods illustrate how simultaneous dollar strength and yield surges have affected precious metals.
| Episode | Peak Gold Drawdown | Peak Silver Drawdown | Key Driver |
|---|---|---|---|
| 2013 Taper Tantrum | ~28% | >35% | Yield surge and dollar strength on Fed tapering signal |
| 2013-2015 Dollar Rally | Mid-teens % | >35% (platinum) | Sustained dollar strength and weaker industrial demand |
| 2022-2023 Fed Tightening | ~15-20% | Larger than gold | DXY above 110; 10-year yield surge |
The 2013 Taper Tantrum remains the most instructive parallel. When the Federal Reserve signalled it would begin tapering bond purchases, gold fell approximately 28% over the year, according to World Gold Council data. Silver fell more than 35%, per the Silver Institute. Platinum declined more than 35% peak-to-trough during the 2013-2015 dollar-strength period, according to WPIC Platinum Quarterly data.
World Gold Council historical analysis found that when the dollar rallied more than 10% over any 12-month period, gold’s median drawdown was in the mid-teens percent, though with wide dispersion depending on the inflation backdrop.
JP Morgan Commodity Strategy noted in February 2026 that “high real yields have historically capped gold upside.” The pattern is consistent across episodes: silver and platinum deliver larger percentage drawdowns than gold, while gold’s losses are partially cushioned by its monetary and safe-haven functions.
Investors wanting to situate the current selloff within a longer-cycle view of gold versus equities will find our dedicated guide to the Dow-to-gold ratio useful; it walks through the ratio’s historical extremes, including the 1980 trough and 1999 peak, and explains why at approximately 10.5 the ratio currently sits 30% below its 50-year average, a context that shapes how long-horizon allocators interpret near-term yield pressure on gold.
The current selloff is driven by identifiable, measurable forces. That does not make it simple to navigate, because the demand picture for gold is bifurcated in ways that matter for different types of holders.
The World Gold Council’s Q1 2026 Gold Demand Trends report noted “record central bank buying” continuing through the period, while ETF inflows proved “more sensitive to rate expectations.” This distinction is significant. ETF demand, the component most accessible to retail investors, is the component most vulnerable to the current yield environment. Physical bar, coin, and central bank demand has shown more resilience, sometimes rising when higher yields coincide with elevated inflation or uncertainty, according to the WGC’s 2026 outlook.
Institutional gold forecasts from Goldman Sachs, JPMorgan, and UBS continue to target the $5,400-$6,300 range for late 2026, with analysts pointing to central bank accumulation of 750-850 tonnes annually as a structural demand floor that yield-driven corrections have historically not displaced.
The World Gold Council Q1 2026 Gold Demand Trends report documented continued record central bank buying alongside a notable slowdown in ETF inflows, with U.S.-based ETF outflows highlighting how rate-sensitive the tactical investor segment has become relative to long-term institutional holders.
UBS Precious Metals Strategy flagged in April 2026 that “leveraged longs in gold futures are vulnerable to liquidation on rate spikes,” while long-term allocators, including central banks and some institutional investors, are “less rate-sensitive and focus more on diversification and geopolitical hedging.” The selloff, in other words, has a technical component on top of its fundamental drivers.
Federal Reserve communications from March 2026 reinforced market expectations of a sustained high-yield environment, with FOMC members expressing willingness to keep rates “restrictive” for longer. The 10-2 year Treasury yield spread widened 15.27% to 31.32 basis points on 18 May, a signal of shifting curve dynamics worth monitoring.
For investors holding precious metals positions, the framework for assessing whether current pressure is intensifying or beginning to reverse centres on five indicators:
Three mechanics explain the mid-May 2026 selloff in precious metals. High bond yields raise the opportunity cost of holding non-yielding assets. A firmer dollar suppresses international demand by making gold more expensive in local currency terms. The geopolitical risk premium that supported gold’s earlier rally is eroding as yields and the dollar dominate the market’s attention.
All three of these forces can reverse. Yields can fall on softer economic data or a shift in Federal Reserve tone. The dollar can weaken on changing interest rate differentials. A significant geopolitical escalation can refresh the risk premium overnight.
What makes this framework durable is not the current price level but the mechanics themselves. The yield-gold relationship and the dollar-gold relationship are among the most consistently documented dynamics in commodity markets. Understanding them equips investors to interpret future price moves independently of whether gold is at $4,484 or $5,000.
This article is for informational purposes only and should not be considered financial advice. Investors should conduct their own research and consult with financial professionals before making investment decisions. Past performance does not guarantee future results. Financial projections are subject to market conditions and various risk factors.
Gold pays no interest or dividend, so when bond yields rise, investors can earn meaningful risk-free income from Treasuries instead. This opportunity cost makes holding gold less attractive relative to yielding assets, reducing demand and pushing the gold price lower.
Because gold is priced in U.S. dollars, a stronger dollar makes gold more expensive in local currency terms for buyers in Europe, Asia, and emerging markets. This mechanically suppresses international demand and adds a second layer of downward pressure on the gold price on top of any yield-driven selling.
Silver carries significant industrial demand exposure through solar panels and electronics, making it sensitive to economic growth concerns that intensify when yields spike. This gives silver a higher-beta relationship with gold, meaning it tends to fall further during yield and dollar pressure episodes.
The geopolitical risk premium is the portion of the gold price reflecting market anxiety about active conflicts such as the Iran-Israel war. It is eroding in mid-May 2026 because rising yields and dollar strength are dominating investor attention, and safe-haven flows are rotating into the U.S. dollar rather than bullion.
The five key indicators are: the direction of real Treasury yields, the trend in the U.S. Dollar Index, the tone of Federal Reserve communications, net ETF flow data for gold and silver, and any significant new escalation in the Iran-Israel conflict that could refresh the geopolitical risk premium.