Pro Medicus Wins A$90M Boston Contract, Lifting PME Outlook
1 hr ago

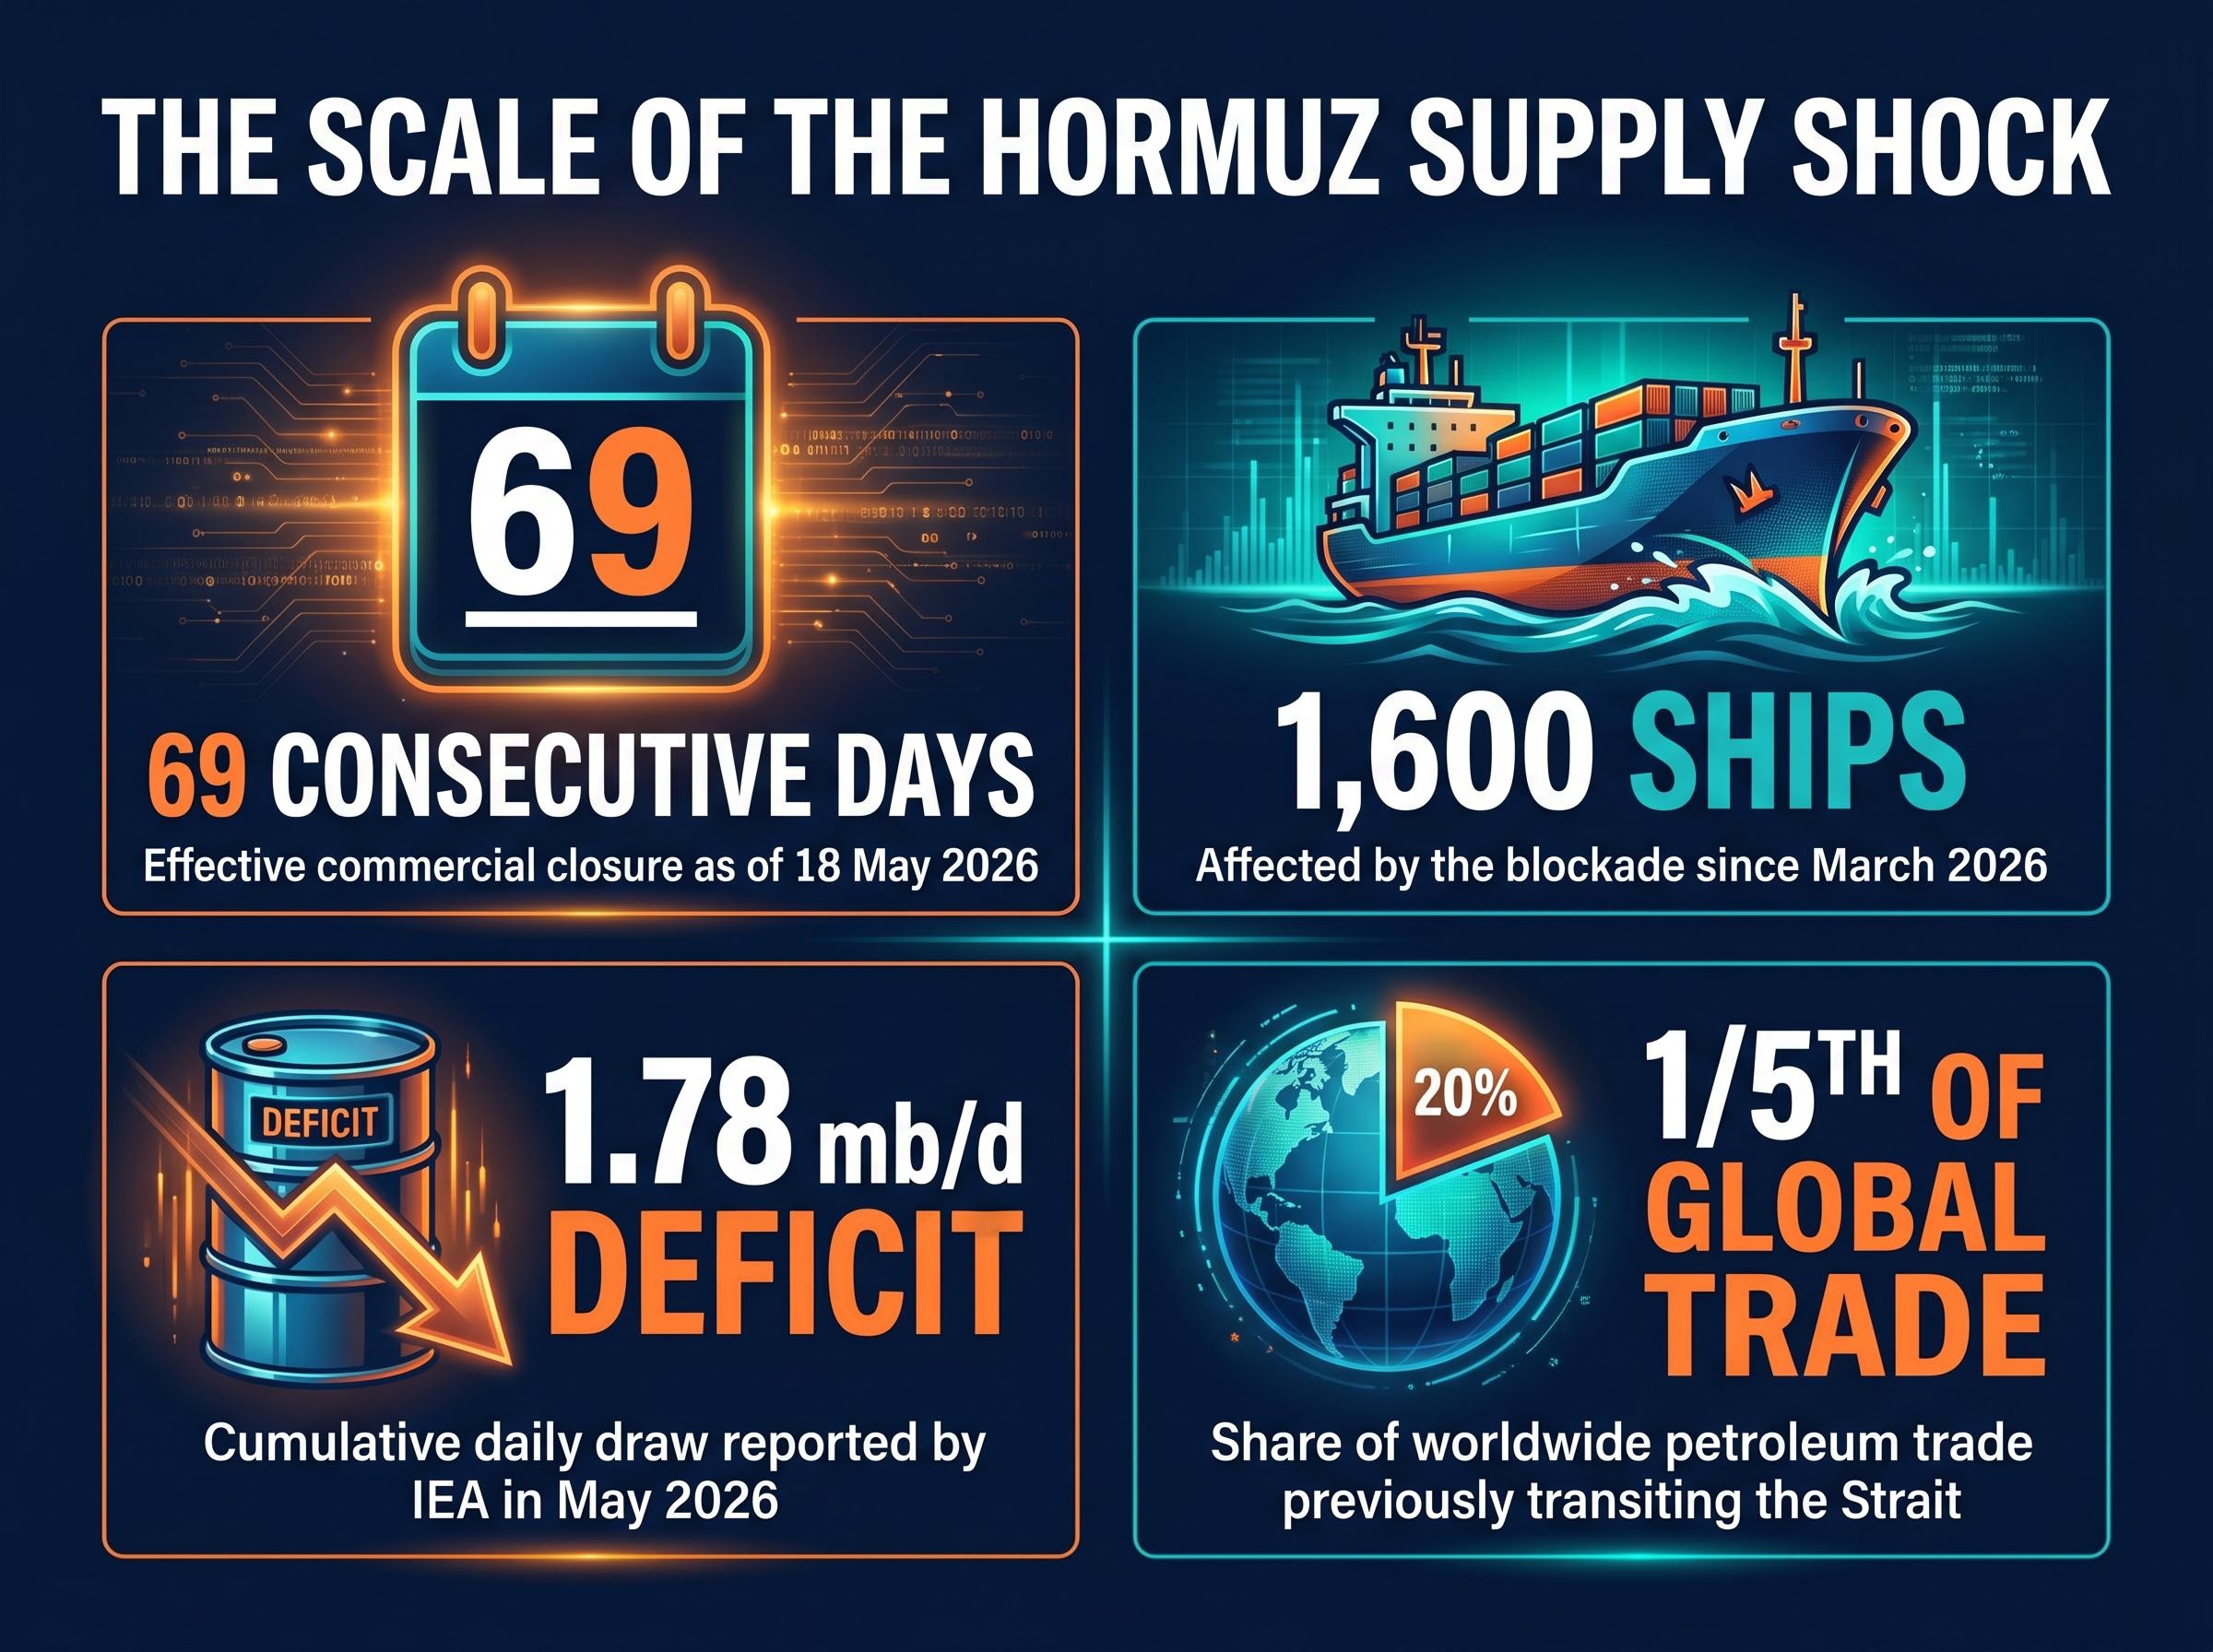
Brent crude hit $110.54 per barrel on Monday as the Strait of Hormuz entered its 69th consecutive day of effective closure, with G7 finance ministers and central bank governors convening in Paris to address what one group of analysts now describes as a credible pathway to 10% inflation across the UK and eurozone. The disruption is no longer a speculative scenario. Naval skirmishes between U.S. and Iranian forces have kept approximately 1,600 ships from transiting a waterway that previously carried one-fifth of all global petroleum trade. The G7 Paris meeting, confirmed for 18-19 May 2026, represents the highest-level coordinated institutional response yet assembled, and its outcome is expected to shape both central bank posture and market expectations through the summer.
What follows maps the specific transmission mechanism from blocked shipping lane to oil price spike to inventory crisis to consumer inflation, using confirmed analyst projections and current market data, so readers can assess the credibility and magnitude of the macro risk scenarios now being priced by bond markets.
Before the crisis, the Strait of Hormuz was not merely a regional shipping lane. It was a structural artery of global petroleum supply, facilitating roughly one-fifth of all worldwide petroleum trade flows. That artery has been severed for over two months.
The physical dimensions of the disruption are stark:
A week-long closure causes a price spike. A 69-day closure causes something structurally different: inventory depletion.
The International Energy Agency’s (IEA) May 2026 Oil Market Report quantified the ongoing draw at 1.78 million barrels per day (mb/d), a deficit that has been compounding since March. Each week of continued closure removes supply that cannot be retroactively restored, and that cumulative deficit is what separates the current situation from the short-duration disruptions that oil markets have absorbed in recent decades.
Brent crude at $110.54 per barrel and WTI at $106.42 (both as of 18 May 2026) represent the market’s current reading of the crisis. Several institutional forecasters treat these levels as a floor rather than a ceiling under continued closure.
The arithmetic is straightforward. A 1.78 mb/d deficit, confirmed by the IEA, means global stockpiles are declining at a rate that, according to Capital Economics, could push inventories to dangerously low levels by the end of June 2026. If the Strait remains blocked through late June, Capital Economics projects Brent could reach $130-$140 per barrel, or potentially higher.
Goldman Sachs raised its Q4 2026 oil price forecasts, citing the “Hormuz shock” as the primary driver and pointing to extreme inventory draws. JPMorgan projects Brent to remain in the low $100s per barrel through 2026 even if the Strait reopens in June, reflecting the time required to rebuild depleted inventories.
| Institution | Price Forecast | Timeframe | Key Condition |
|---|---|---|---|
| IEA | 1.78 mb/d deficit | May 2026 (ongoing) | Closure continues |
| Goldman Sachs | Raised Q4 2026 forecast | Q4 2026 | Extreme inventory draws persist |
| JPMorgan | Low $100s/bbl | Through 2026 | Even if Strait reopens in June |
| Capital Economics | $130-$140/bbl+ | Late June 2026 | Strait remains blocked through June |
The Strait of Hormuz is a narrow waterway between Iran and Oman connecting the Persian Gulf to the Gulf of Oman and the open ocean. Its significance is not merely about volume; it is about the absence of alternatives at the scale required.
EIA Hormuz chokepoint data published in February 2026 recorded 20.9 million barrels per day transiting the waterway in the first half of 2025, representing approximately 20% of global petroleum liquids consumption and establishing the baseline against which the current 1.78 mb/d deficit must be measured.
One-fifth of all worldwide petroleum trade previously transited the Strait of Hormuz, making it the single most concentrated chokepoint in global energy infrastructure.
Several characteristics make the Strait functionally irreplaceable:
Strategic petroleum reserve (SPR) releases by IEA member governments represent the primary institutional offset mechanism. However, specific confirmed SPR release volumes had not been publicly announced as of 18 May 2026. Even a large coordinated release would partially mitigate, rather than fully substitute, for a disruption of this magnitude.
Emergency SPR releases totalling approximately 280 million barrels have failed to halt the inventory drawdown, with OPEC spare capacity of roughly 0.5 million barrels per day negligible at the scale of a disruption that is pulling 8.5 million barrels per day from global stockpiles in Q2 2026.
The path from oil price to consumer price index follows a specific sequence, and each stage amplifies the one before it:
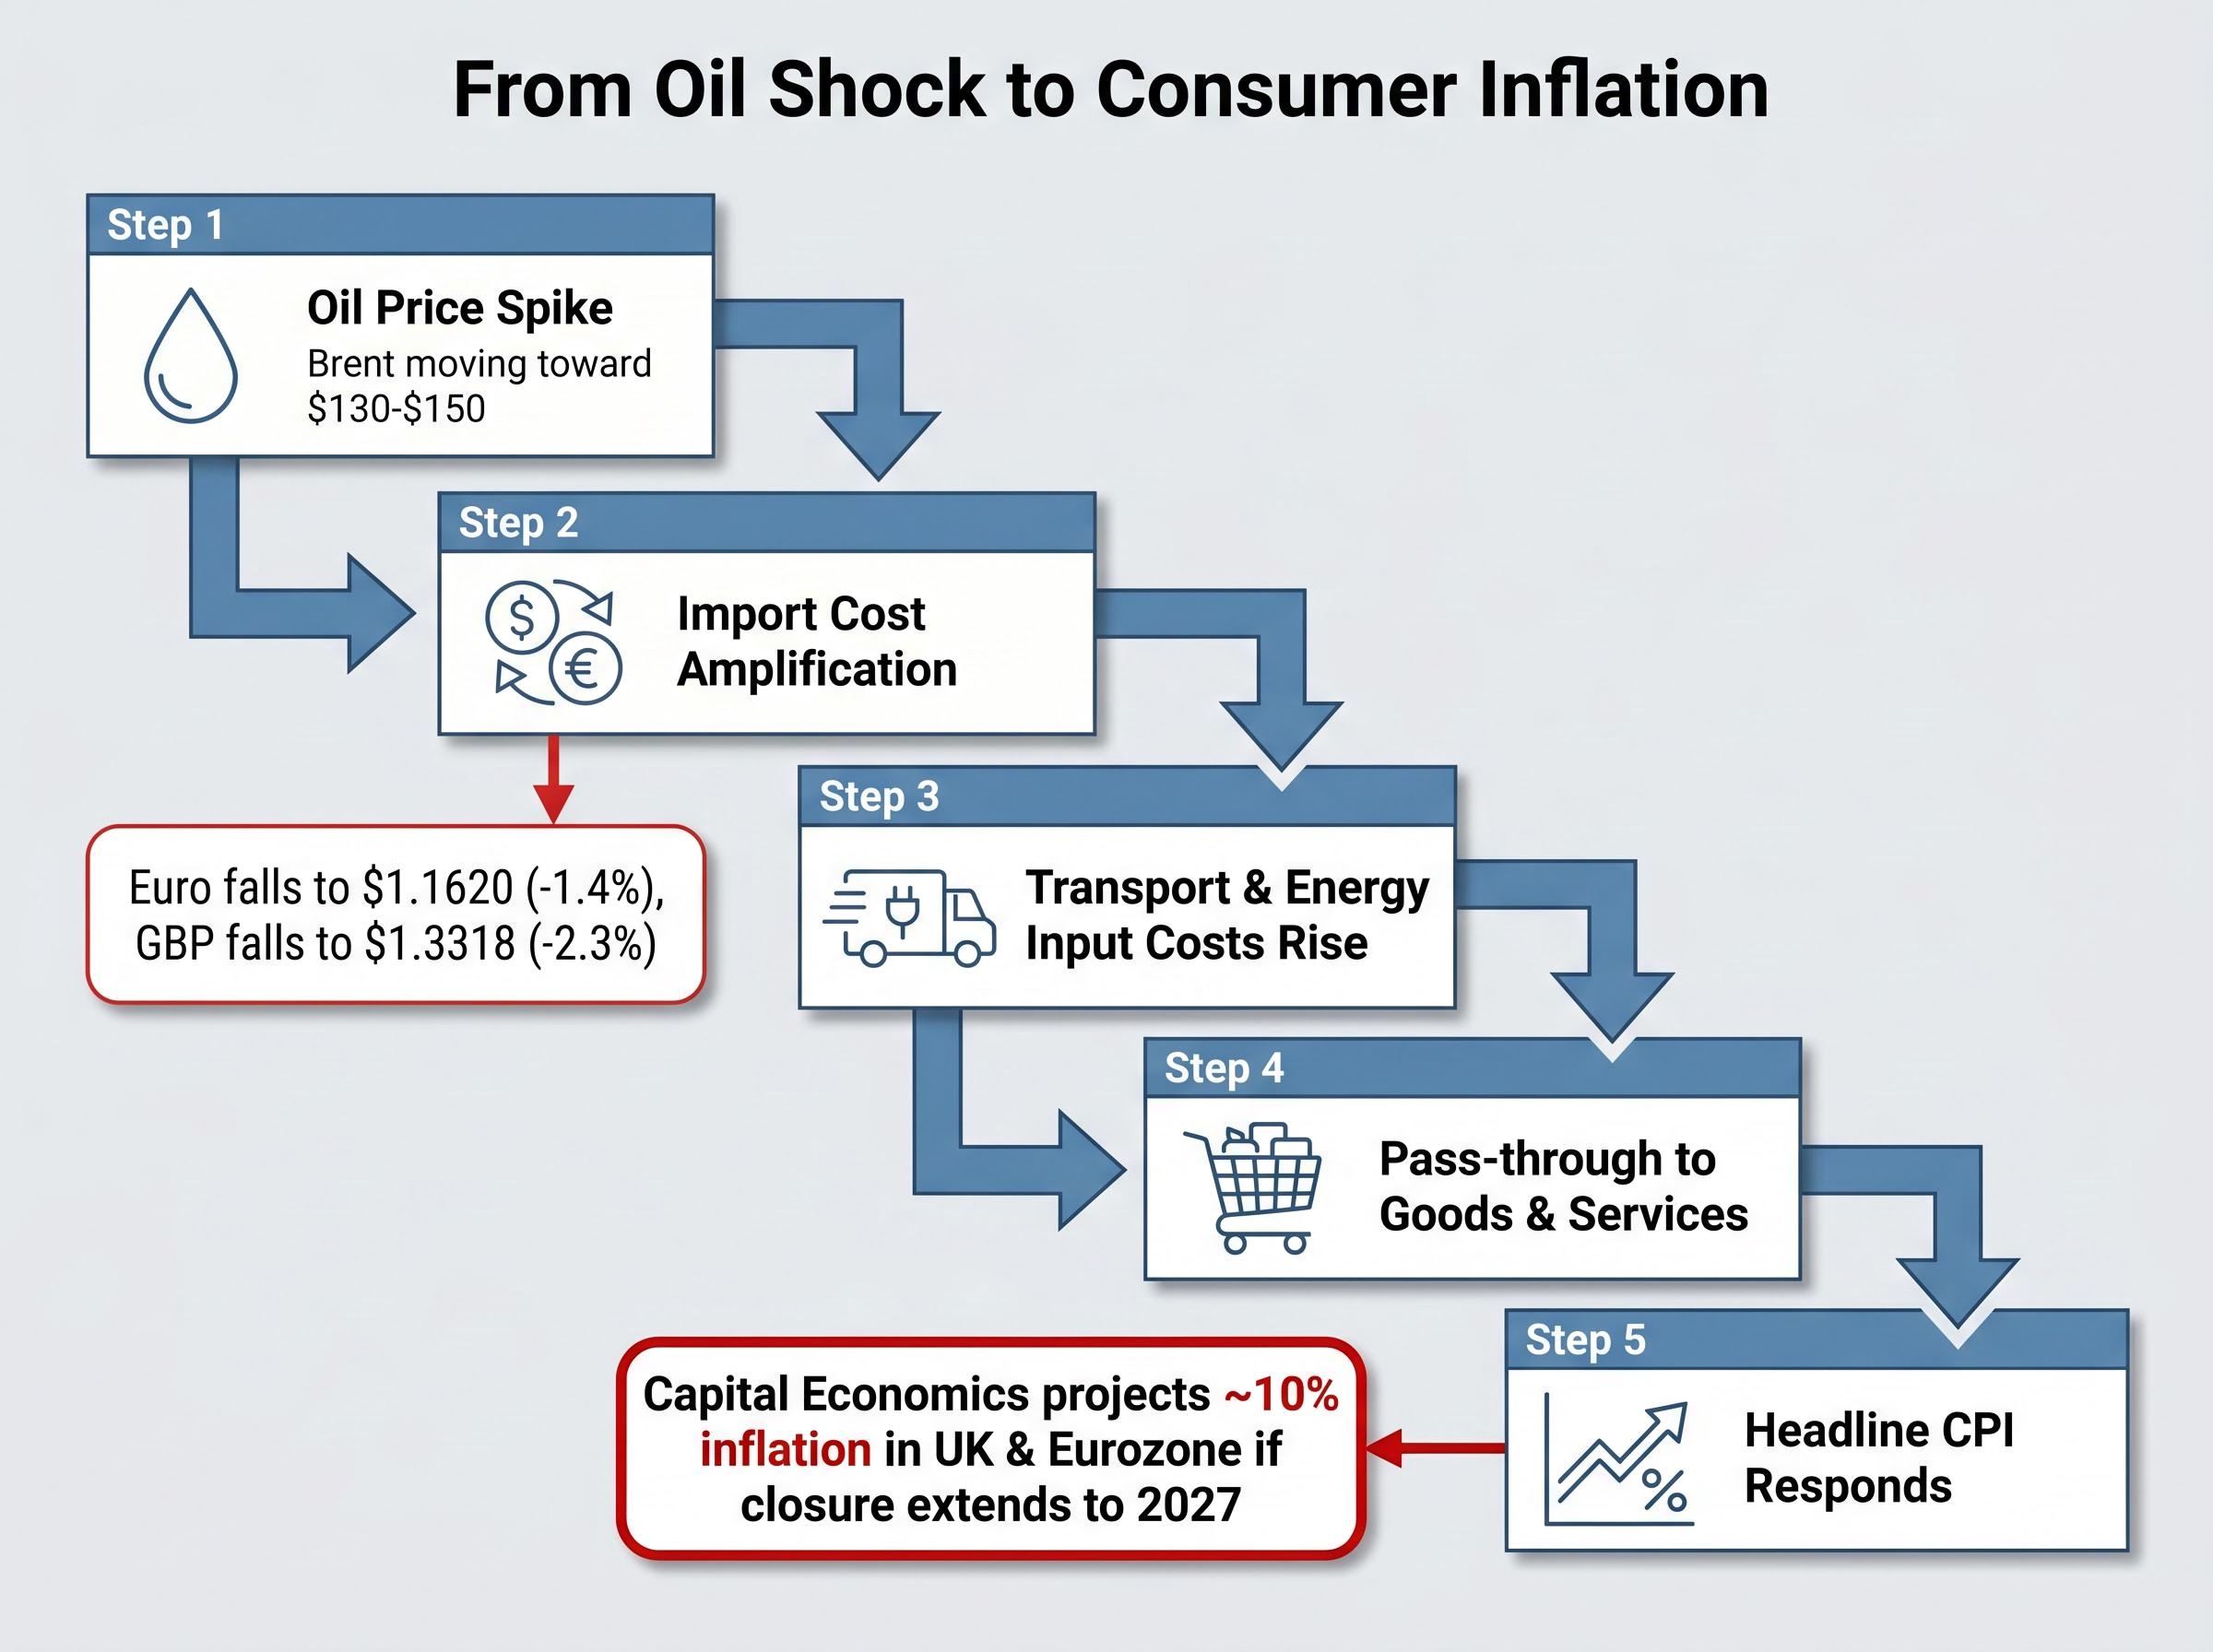
The UK and eurozone face disproportionate exposure for two reasons. Both are net energy importers, meaning they absorb the full price increase rather than benefiting from higher export revenues. The U.S., by contrast, is a net petroleum exporter, providing a partial buffer.
Currency depreciation compounds the problem. The euro fell to $1.1620, down 1.4% on the week, making dollar-denominated oil more expensive for eurozone buyers. The British pound dropped to $1.3318, down 2.3% on the week, an even sharper amplification of UK energy import costs.
Under a scenario in which the closure extends through year-end 2026 with Brent near $150 per barrel into 2027, Capital Economics projected inflation could approach 10% in both the UK and the eurozone.
Central banks face a structural problem. Raising interest rates suppresses demand but does not resolve a supply-side shock originating from a blocked shipping lane. The risk is that rate increases slow economic activity without addressing the cause of inflation, producing a recession on top of the price crisis.
Supply-side inflation, where price increases originate from a physical constraint in production or logistics rather than excess consumer demand, poses a fundamentally different challenge to central banks than the demand-pull variety that standard rate-hike cycles are designed to address.
Capital Economics projected that a prolonged blockage at those price levels could push interest rates back toward their recent peak levels. A Fed rate increase is currently viewed as having roughly even odds of occurring in 2026.
Bond markets are already reflecting this tension. The U.S. 10-year Treasury yield rose to 4.584%, up 23 basis points on the week, while the 30-year yield reached 5.109%, up 18 basis points, pricing in the prospect of higher inflation and tighter monetary policy simultaneously.
The bond market is not waiting for a G7 communique. The 23-basis-point weekly rise in the U.S. 10-year yield and the 30-year pushing above 5.1% represent real-time repricing of inflation expectations and rate-hike probability.
Equity markets tell a more complicated story. Asian indices registered immediate risk-off moves:
Gold held near flat at approximately $4,540 per troy ounce, notably failing to attract safe-haven flows despite the elevated risk environment, a signal that the inflation hedge trade has not yet displaced the rate-hike repricing as the dominant positioning theme.
The divergence is instructive. Fixed income markets are pricing a sustained inflation and rate-hike scenario. Equity markets remain partially anchored to the AI earnings cycle, with Nvidia’s results due 21 May likely to set near-term direction for U.S. indices. The Hormuz crisis has not yet fully displaced the technology earnings narrative in equities, but the bond market is pricing the macro risk independently.
The G7 Finance Ministers and Central Bank Governors meeting in Paris (18-19 May 2026) represents the highest-level coordinated institutional response to the Hormuz crisis confirmed in the public record. Eurogroup President Kyriakos Pierrakakis travelled to France to participate, a signal of eurozone urgency. Internal G7 geopolitical divisions, however, add uncertainty to the coordination outcome.
G7 finance chiefs coordinating on trade strains and inflation containment have faced sustained pressure to reconcile divergent national interests, a tension that makes the Paris meeting’s communique language on SPR releases and central bank signalling the critical variable for market expectations heading into June.
Three near-term catalysts will determine whether the orderly containment scenario or the escalation toward $150 per barrel materialises:
JPMorgan projects Brent to remain in the low $100s per barrel through 2026 even if the Strait reopens in June, establishing a persistent disruption cost floor that readers may underestimate.
The gap between that floor and the Capital Economics $130-$140 ceiling represents the range within which the next several weeks of events will resolve.
For investors wanting to model the macro downside beyond inflation, our deep-dive into the June 2026 recession threshold examines BCA Research’s seven-factor framework for why global GDP data has held up so far, which structural buffers are closest to expiry, and why UBS assigns greater than 50% recession probability if the Strait closure remains unresolved into June.
This article is for informational purposes only and should not be considered financial advice. Investors should conduct their own research and consult with financial professionals before making investment decisions. Financial projections referenced in this article are subject to market conditions and various risk factors, and past performance does not guarantee future results.
The Strait of Hormuz is a narrow waterway between Iran and Oman that previously carried approximately one-fifth of all global petroleum trade, making it the single most concentrated chokepoint in global energy infrastructure. When it is blocked, there are no viable alternative routes capable of replacing the lost volume at scale, which drives oil prices sharply higher.
Capital Economics projects Brent crude could reach $130-$140 per barrel or higher if the Strait remains blocked through late June 2026, while JPMorgan expects prices to stay in the low $100s per barrel through 2026 even if the Strait reopens in June, reflecting the time needed to rebuild depleted inventories.
A closure triggers a sequence where oil price spikes raise import costs, which are amplified by currency depreciation against the dollar, then feed into higher transport, energy, and input costs across every sector, ultimately pushing up consumer prices for food, goods, and services. Capital Economics projects inflation could approach 10% in both the UK and eurozone under a scenario where the closure extends through year-end 2026 with Brent near $150 per barrel.
The International Energy Agency's May 2026 Oil Market Report confirmed an ongoing supply deficit of 1.78 million barrels per day as a result of the Strait of Hormuz closure, a cumulative drawdown that has been compounding since March 2026 and that Capital Economics warns could push global inventories to dangerously low levels by the end of June 2026.
Three near-term catalysts are being closely watched: the G7 Paris communique expected on 19 May 2026, which may announce coordinated strategic petroleum reserve releases; Federal Reserve meeting minutes due 21 May, which will reveal how explicitly the Fed discussed the Hormuz scenario; and Nvidia earnings on 21 May, which could test whether equity markets can hold against the macro headwind.