What Tesla’s $25-$4,600 Gap Teaches About Stock Valuation
27 mins ago

Wall Street’s current price targets for Tesla span from $145 to over $4,600 per share. Every analyst citing one of those numbers is looking at the same company, the same filings, and roughly the same economic environment. The spread is not a failure of analysis. It is the point.
Tesla’s Q1 2026 results produced a familiar tension: revenue of $22.4 billion beat consensus, gross margin of 21.7% crushed the 17% estimate, and deliveries missed by roughly 10,000 vehicles. The stock swung from $298 the day after earnings to $428 within two weeks. That volatility reflects genuine, irresolvable disagreement about what Tesla is, what it will become, and what investors should pay to own a share of either outcome. This guide uses Tesla as a live case study to teach a systematic approach to stock valuation analysis for any company in transition. Readers will learn how to construct bull and bear scenarios, understand which valuation inputs drive the widest swings in outcome, and see why the price paid at entry is often a more powerful variable than getting the business forecast exactly right.
A single-point discounted cash flow (DCF) model, where future cash flows are projected and discounted back to today’s value, works well for a business whose revenue lines are stable and whose margins are predictable. So does a price-to-earnings multiple applied to next year’s consensus estimate. These tools assume the analyst can see the shape of the business with reasonable clarity.
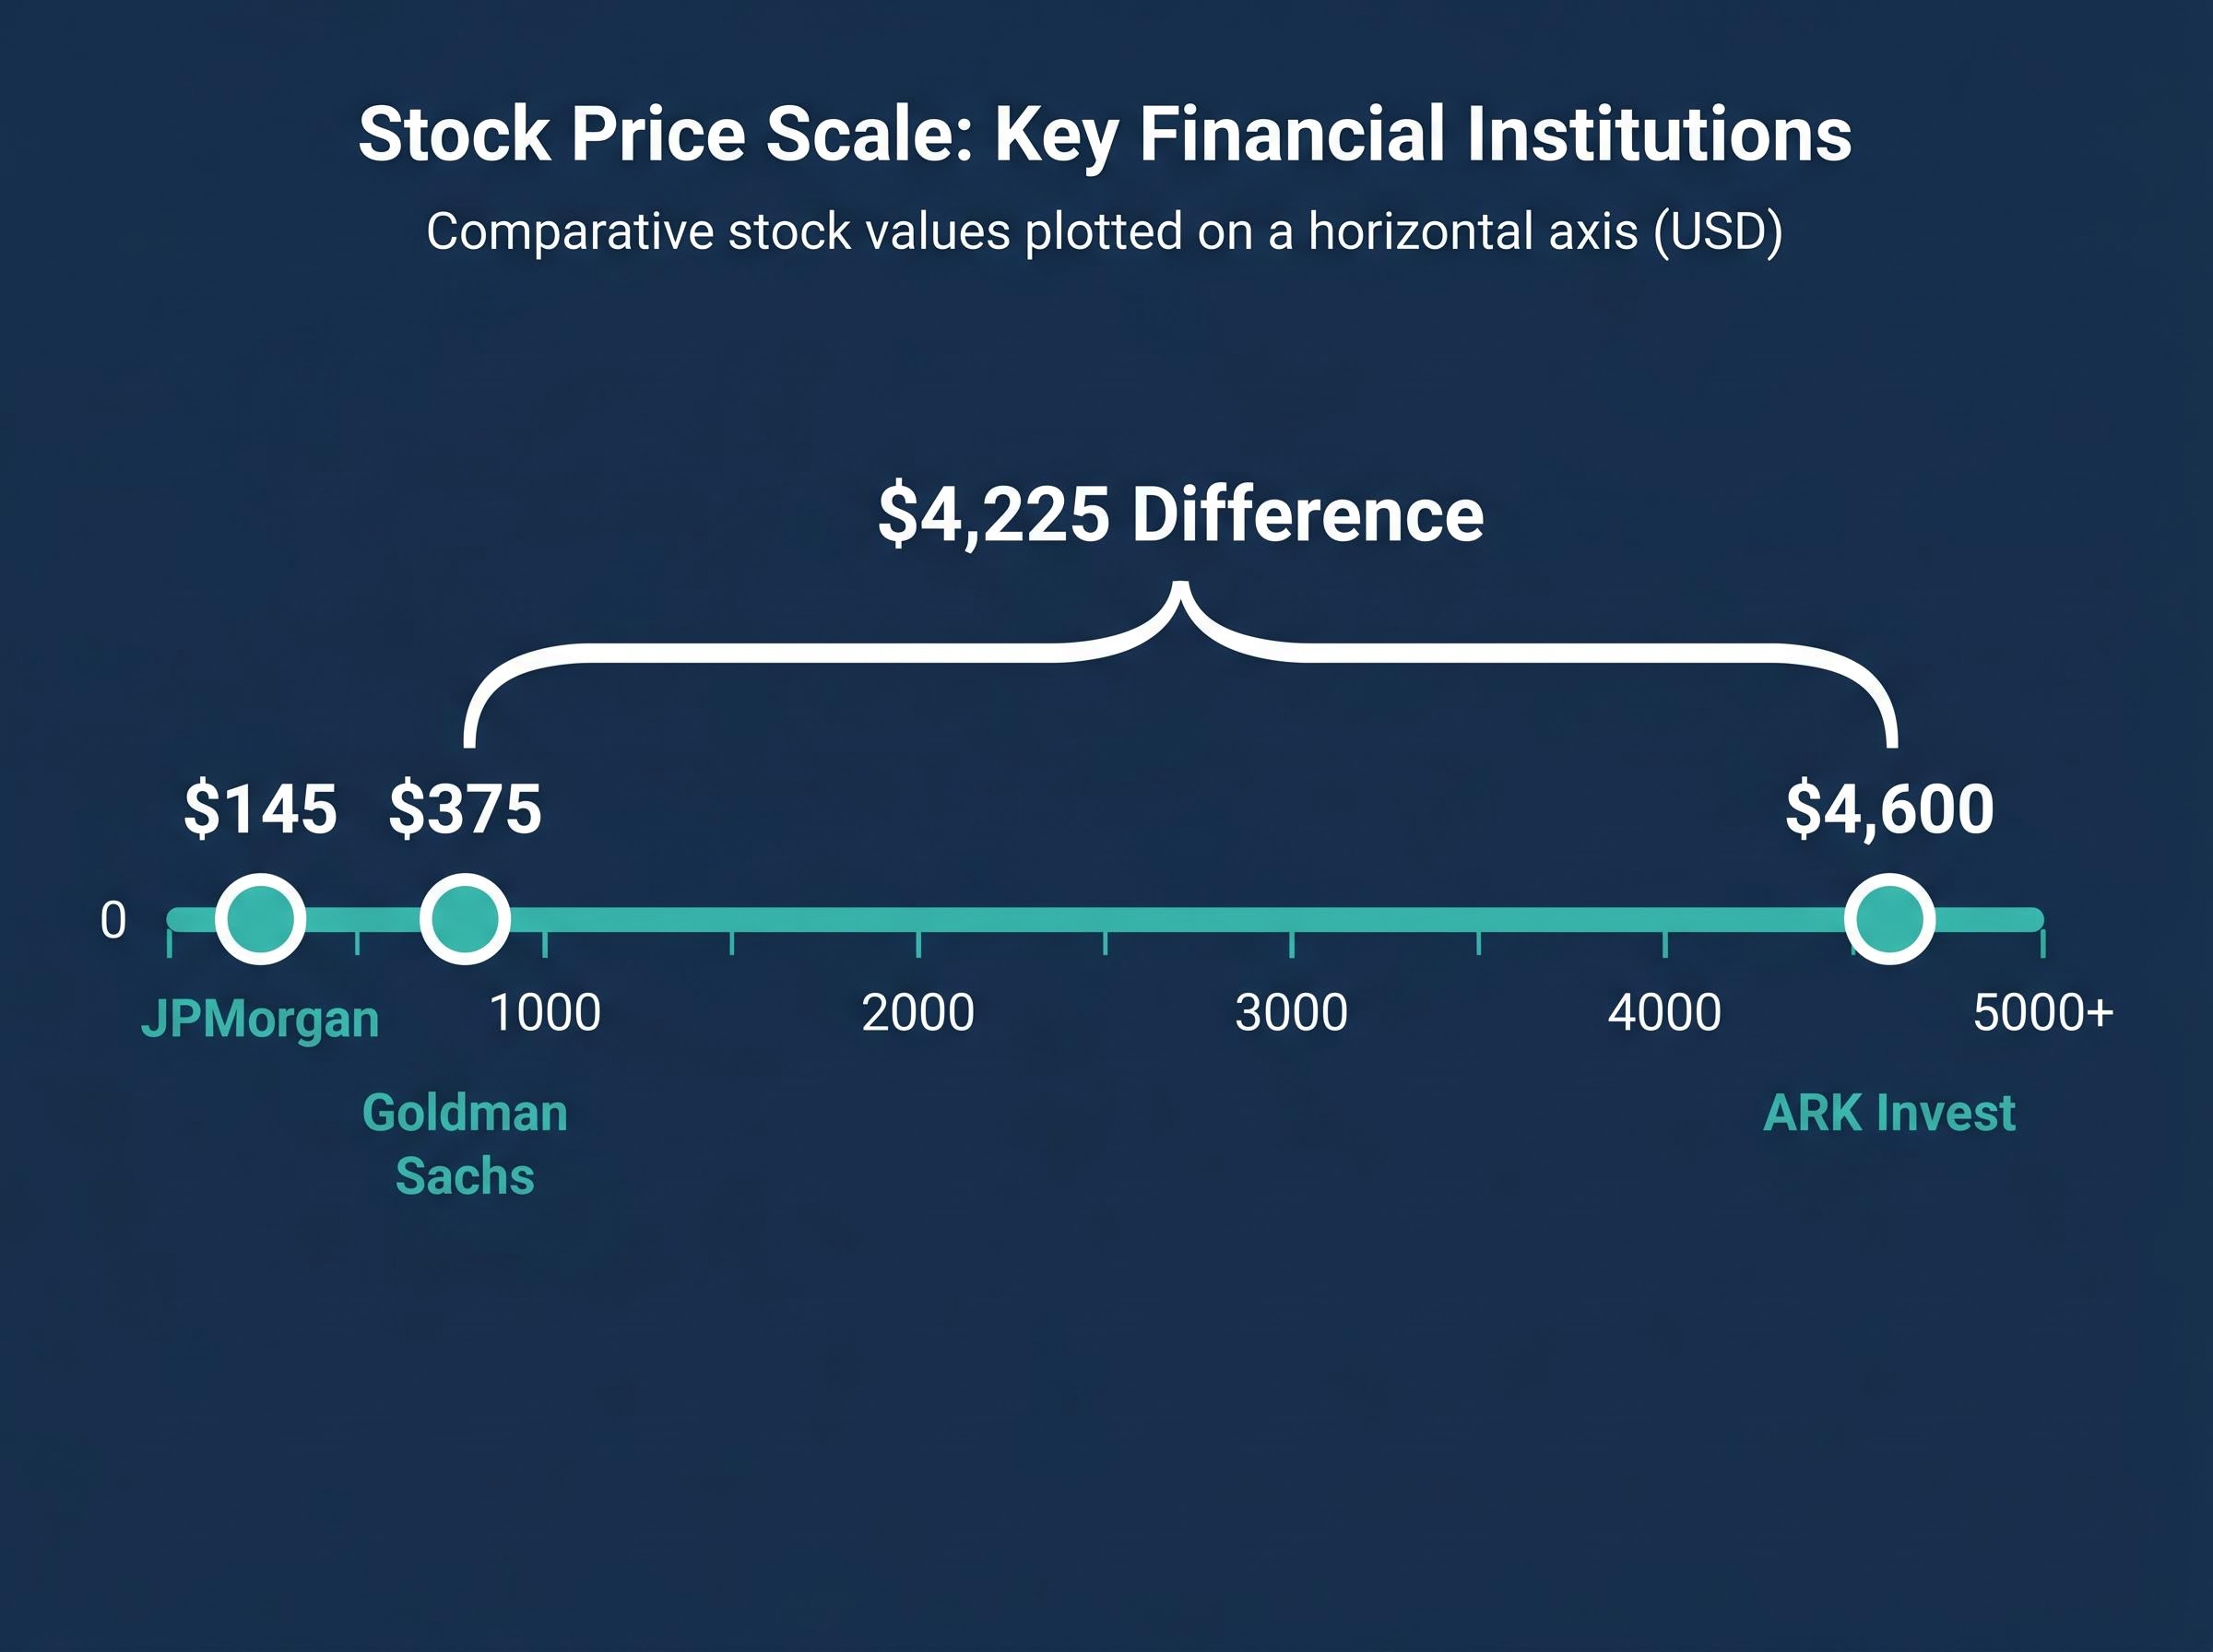
Tesla breaks that assumption. The core automotive business generated 21.7% gross margins in Q1 2026, well above the 17% analyst estimate. Yet the company trades at a market capitalisation of approximately $1.31 trillion, a figure that cannot be justified by the cars alone. Goldman Sachs analyst Mark Delaney’s EV-only DCF, which excludes autonomy and robotics entirely, values Tesla at $375 per share. ARK Invest’s model, built almost entirely on robo-taxi assumptions, produces an expected value of $4,600. Same company, two legitimate analytical frameworks, a $4,225 per share difference in conclusion.
The analyst spread in one number: Goldman Sachs values Tesla’s core automotive business at $375 per share with no autonomy allocation. ARK Invest’s expected value is $4,600, built almost entirely on robo-taxi economics. The difference is $4,225 per share, and both models are internally defensible.
Three conditions signal a company has moved beyond the territory where standard DCF or earnings multiples produce reliable outputs:
FASB segment disclosure standards updated in November 2023 under ASU 2023-07 require public companies to report significant segment expenses on both annual and interim bases, meaning Tesla’s continued consolidation of autonomy and Optimus activity into a single reporting segment is a deliberate disclosure choice rather than a regulatory gap.
When all three conditions hold, the analytical framework must shift from single-point precision to scenario-based thinking. The future is not one path. It is a distribution of outcomes.
The bear case for Tesla is not a prediction that the company will fail. It is a disciplined exercise in stripping narrative away from numbers, asking a straightforward question: what is the automotive business worth on its own terms, and what does the return math look like at today’s price if AI and robotics revenue does not materialise within the forecast window?
The component assumptions are specific. Revenue growth of 6-12% (midpoint 9%) reflects a maturing electric vehicle market where BYD has already surpassed Tesla in global EV volume. Net profit margins of 8-14% reflect the compression already visible in recent quarters compared to prior peaks. Exit multiples of 18-22x earnings align with a premium automaker, not a technology platform.
JPMorgan analyst Ryan Brinkman maintains a $145 price target as of 6 April 2026, flagging any $1 trillion-plus market capitalisation as “speculative” absent Optimus scaling by 2028.
Goldman Sachs provides additional structure. Its three-scenario EV-only DCF produces a bear case of approximately $250, a base case near $350, and a bull case of $450, with no autonomy or Optimus allocation in any scenario.
| Assumption | Bear Range | Midpoint |
|---|---|---|
| Revenue Growth Rate | 6-12% | 9% |
| Net Profit Margin | 8-14% | 11% |
| Exit Multiple (P/E) | 18-22x | 20x |
| Implied 10-Year Annualised Return (at ~$375-$428 entry) | Negative across the range | |
At an entry price near $375-$428, all projected return outcomes under bear case assumptions were negative, according to the research. The bear case does not require Tesla to collapse. It only requires the AI and robotics thesis to remain unrealised within the investment horizon.
The three core valuation levers in any scenario model, revenue growth rate, net profit margin, and exit multiple, must be internally consistent with each other; a high-growth revenue assumption paired with a mature-company exit multiple produces a structurally broken scenario regardless of how defensible each input looks in isolation.
The bear and bull cases produce dramatically different numbers. The mechanics underneath explain why, and understanding those mechanics is what separates an investor who can evaluate an analyst’s price target from one who simply accepts or rejects it.
A DCF model has three core components. First, projected free cash flows: the cash a business is expected to generate after covering operating costs and capital expenditures, estimated year by year across a forecast period (typically 5-10 years for Tesla models). Second, the discount rate, known as the Weighted Average Cost of Capital (WACC), which adjusts those future cash flows to reflect the time value of money and the risk of the business. Analysts typically apply 8-10% for Tesla given its growth profile and capital structure. Third, the terminal value, which captures the company’s worth beyond the explicit forecast period using a perpetual growth rate, commonly 3-5%.
The discounted cash flow mechanics underlying both the bear and bull cases share a common foundation with the dividend discount model: both treat a stock’s value as the present value of future cash flows, with the key difference being whether those cash flows take the form of free cash or distributed dividends.
Small changes in these inputs produce enormous per-share swings at Tesla’s scale. Shifting the WACC from 8% to 10%, or the perpetual growth rate from 5% to 3%, can move the output by hundreds of dollars per share. This mechanical sensitivity is why two analysts with nearly identical revenue forecasts can still reach different conclusions.
Morgan Stanley analyst Adam Jonas uses a sum-of-parts (SOTP) DCF, which values each of Tesla’s business segments separately. The auto segment, FSD/robo-taxi segment, and Optimus segment each receive their own growth assumptions and valuation method, then the parts are summed. This approach is standard for companies with multiple distinct business lines at different growth stages. Morgan Stanley’s bear-to-bull range runs from approximately $450 to $850.
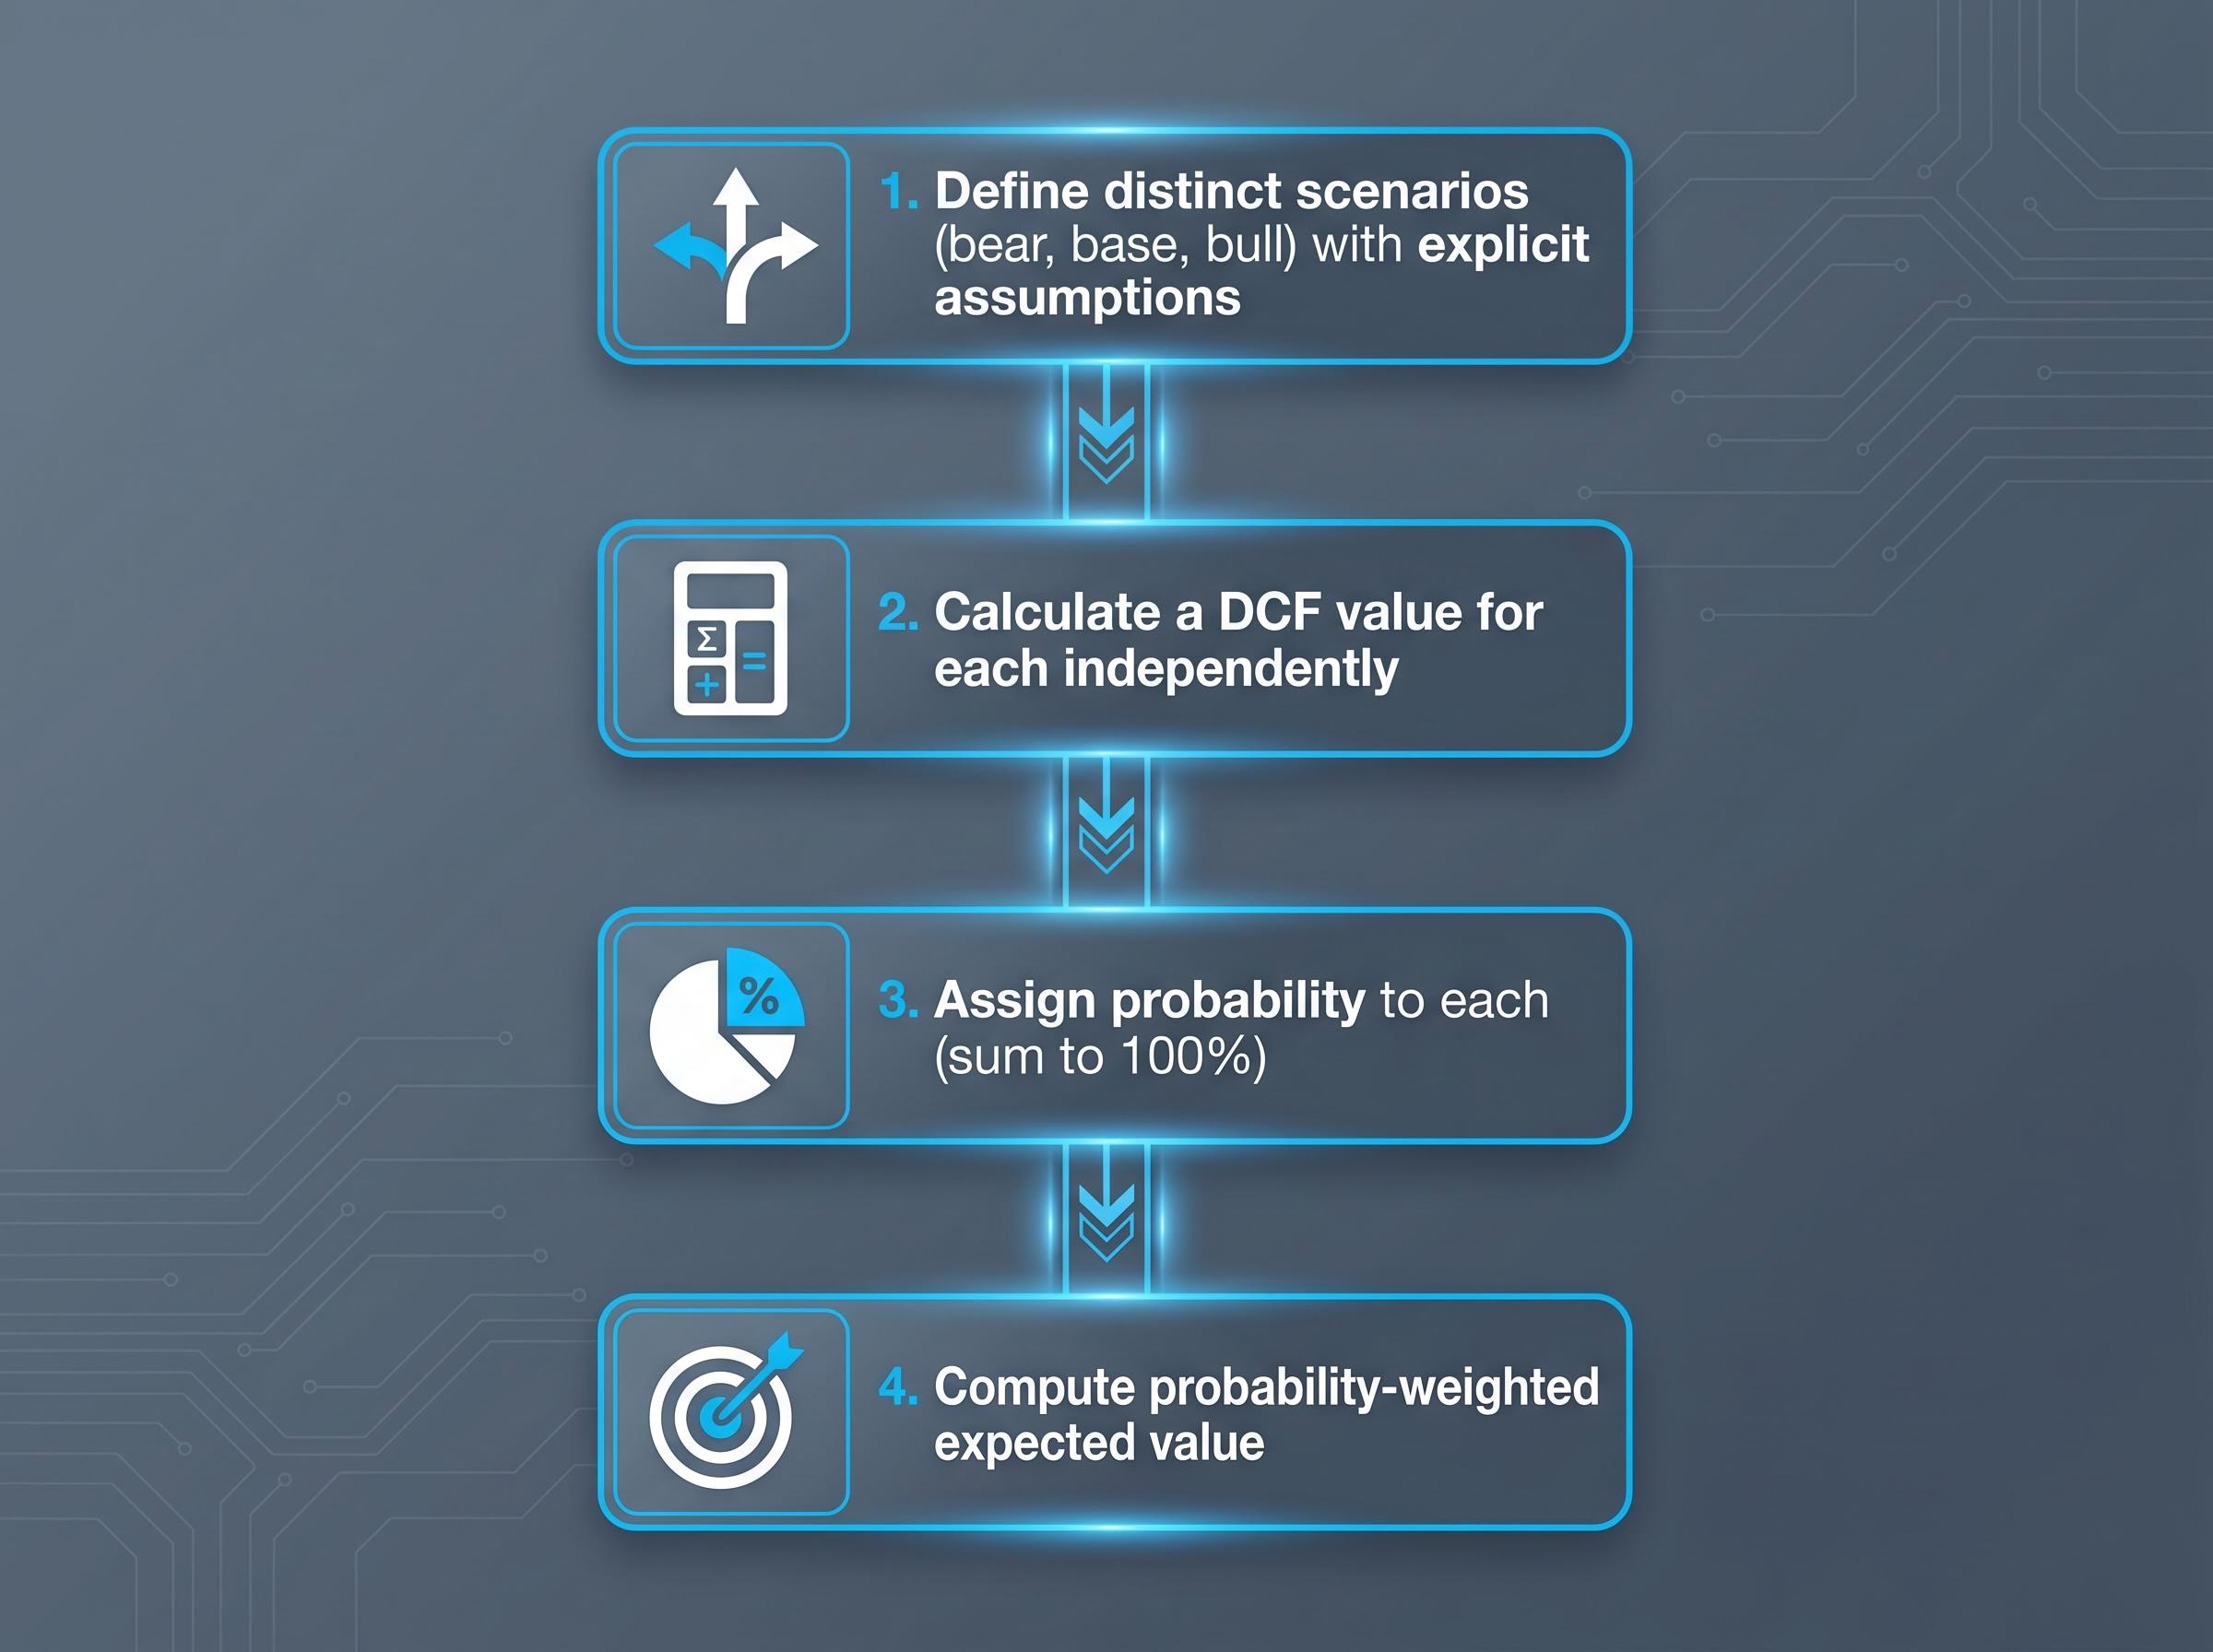
A single DCF scenario is useful but incomplete for a company like Tesla. The CFA Institute’s 2026 Level II curriculum explicitly emphasises probabilistic scenario analysis for high-uncertainty firms, and Aswath Damodaran of NYU Stern has argued that explicit probability assignments (such as a 30% probability of Optimus success) are superior to single-point models because they force analysts to quantify rather than narrate.
The process follows four steps:
The expected value is not a prediction of which scenario will occur. It is a discipline for avoiding the common error of selecting whichever scenario confirms a prior view. The disagreement between ARK Invest’s assumption of approximately 90% robo-taxi margins and JPMorgan’s cap near 50% illustrates that even within a single scenario, the input assumptions carry enormous weight.
NYU Stern’s framework for scenario analysis in high-uncertainty valuations formalises exactly this structure, providing the academic grounding for why probability-weighted expected value calculations are superior to single-point DCF outputs when a company’s future revenue composition remains genuinely unknowable.
Morningstar and CFA practitioners recommend Monte Carlo simulation as a more sophisticated extension, where key inputs like robo-taxi revenue growth are treated as probability distributions rather than point estimates, producing a full distribution of intrinsic values rather than three discrete numbers.
The bull case uses the same framework as the bear case. What changes are the assumptions and the reasons behind them.
Revenue growth of 20-35% (midpoint approximately 27%) reflects the addition of software-attached revenue streams: Full Self-Driving (FSD) subscriptions, robo-taxi fares, and Optimus humanoid robot sales. Net profit margins of 20-30% reflect the bear-to-bull asymmetry specific to Tesla: in the bear case, margins stay automotive-grade; in the bull case, high-margin software and services revenue pushes the blended margin toward technology-company levels. Exit multiples of 25-35x earnings reflect a business that, if the AI pivot lands, would be valued as a technology platform rather than a manufacturer.
Under these assumptions, estimated annualised returns over a 10-year horizon range from approximately 11% to 35%. Baird analyst Ben Kallo’s $538 price target (issued 3 May 2026) represents a sell-side bull case anchored in robo-taxi assumptions, while Morgan Stanley’s bull target reaches approximately $850.
| Assumption | Bear Case | Bull Case |
|---|---|---|
| Revenue Growth | 6-12% | 20-35% |
| Net Margin | 8-14% | 20-30% |
| Exit Multiple (P/E) | 18-22x | 25-35x |
| 10-Year Annualised Return | Negative | ~11-35% |
The bull case carries specific execution dependencies. Unsupervised FSD must reach commercial scale. CyberCab production must stay on schedule. Optimus must generate third-party revenue by 2027. Regulatory approval must expand beyond current testing-only permits. As of May 2026, Tesla holds a renewed testing-only permit in California but no driverless commercial permit. The NHTSA issued a recall on FSD v12 covering approximately 2 million vehicles, and Tesla’s AV exemption petition has been pending since September 2025 with no confirmed update.
Waymo, by contrast, operates 500,000 paid rides per week across San Francisco, Los Angeles, Phoenix, and Austin as of Q1 2026. Tesla has no comparable commercial driverless deployment. That gap is what the bull case requires closing.
On Elon Musk’s timeline record: the 2016 claim that hardware was fully capable of autonomy, the 2019 prediction of one million robo-taxis by 2020, and the 2021 statement that Optimus would be ready by 2022 all missed their original schedules. This pattern is not a character assessment; it is an analytical input for calibrating forward timeline probabilities.
An investor can get the scenario right and still lose money. The price paid at entry determines whether even a correct thesis translates into an acceptable return.
Consider the same Tesla business and the same eventual outcome. Shares were available near $100 a few years before this analysis. At that entry price, even the bear case produces a tolerable result, and the bull case produces extraordinary returns. At the Q1 2026 range of approximately $298-$428, the bear case turns negative and the bull case compresses to 11-35% annualised. The business did not change. The entry price changed everything.
The concept at work is margin of safety: the wider the gap between an estimated intrinsic value and the current market price, the more room for assumptions to be wrong without permanently impairing capital. At $428, that gap is narrow. Tesla’s projected 2026 capital expenditure exceeds $25 billion, generating substantial negative free cash flow. Investors are paying today for cash flows being consumed by investment spending on businesses that do not yet generate revenue.
Forward analyst earnings-per-share estimates already imply more than 5x growth from current levels, meaning the market is not ignoring the bull case. It is already pricing it. The analyst split as of May 2026, roughly 45% buy, 40% hold, and 15% sell, illustrates how professional disagreement about the entry-price question distributes across the street.
Calculating the implied growth requirements embedded in a current share price is often more revealing than building a forward projection from scratch, because it forces the analyst to confront directly whether the market’s embedded assumptions are plausible rather than whether a preferred bull scenario is internally consistent.
A three-step entry-price discipline applies to any transition-period company:
The framework generalises directly. Identify the bear case intrinsic value as a floor. Identify the bull case intrinsic value as a ceiling. Then ask whether the current price sits closer to the floor or ceiling relative to the probability each scenario deserves.
This applies to any company where revenue from a new business segment is being priced into the stock before that revenue appears in reported financials. The discipline is the same: conviction in a thesis is not the same as conviction in a valuation, and the entry price is where that distinction becomes measurable.
The $145 JPMorgan target and the $4,600 ARK Invest expected value are now explainable rather than mysterious. JPMorgan’s model excludes autonomy value entirely. ARK’s model is built almost entirely on it. Both are methodologically defensible within their own assumptions. The spread is not confusion. It is the honest output of different but defensible assumptions about an unknowable future.
The core methodological insight: the analyst spread on a transition-period company is not a sign of market dysfunction. It is the honest output of different but defensible assumptions about an unknowable future. The spread is information, not noise.
Three questions should be answerable before buying any transition-period company at any price. What is the bear-case intrinsic value? What probability does the bull case deserve? Does the entry price reflect that probability assignment? An investor who cannot answer all three is speculating on narrative rather than investing on analysis.
Damodaran has documented a specific bias in this process: analysts systematically overweight optimistic scenarios, meaning the probability-weighting step is where most valuation errors originate. CFA practitioners advocate Monte Carlo simulation over static scenario tables for 2026-era transition stocks because it produces a full probability distribution of intrinsic value rather than three point estimates.
Institutional behaviour confirms the disagreement extends to the most sophisticated capital allocators. Vanguard and BlackRock increased their positions in Q1 2026, while Berkshire Hathaway trimmed 11% and Norges Bank sold 20%. Identical information, different portfolio conclusions.
Four specific catalysts, if confirmed, would shift probability weight toward the bull case:
Valuation for a company like Tesla is not a one-time exercise. It is a living model, updated as each milestone is met or missed, with probability weights adjusted accordingly. The point is not to arrive at the correct price. It is to build enough analytical structure to know which new information should change the model and which should not, giving investors a principled basis for acting on data rather than reacting to price movements.
Defining thesis monitoring triggers before purchasing a position converts quarterly earnings releases from noise-generating events into structured evidence updates, each catalyst either shifting probability weight toward the bull case or confirming the bear case without requiring an emotional response to short-term price movement.
This article is for informational purposes only and should not be considered financial advice. Investors should conduct their own research and consult with financial professionals before making investment decisions. Past performance does not guarantee future results. Financial projections are subject to market conditions and various risk factors. Forward-looking statements regarding Tesla’s autonomous driving, robotics, and revenue projections are speculative and subject to change based on regulatory developments, competitive dynamics, and company execution.
Stock valuation analysis is the process of estimating a company's intrinsic worth using financial models such as discounted cash flow (DCF) and scenario analysis, helping investors determine whether a stock is priced attractively relative to its expected future cash flows.
A DCF model projects a company's free cash flows over a forecast period (typically 5-10 years), discounts them back to present value using a weighted average cost of capital (usually 8-10% for Tesla), and adds a terminal value to capture worth beyond the forecast window; small changes in any input can move the per-share output by hundreds of dollars.
The spread reflects fundamentally different assumptions about whether Tesla's autonomy and robotics businesses will generate material revenue; JPMorgan's $145 target excludes any autonomy value, while ARK Invest's $4,600 expected value is built almost entirely on robo-taxi economics, and both are internally defensible within their own frameworks.
A probability-weighted expected value assigns a percentage likelihood to each scenario (bear, base, bull), calculates a separate DCF output for each, then multiplies each value by its probability and sums the results, producing a single figure that accounts for uncertainty rather than relying on one optimistic or pessimistic point estimate.
Entry price directly determines whether a correct business thesis translates into an acceptable return; Tesla shares available near $100 would produce strong returns even under bear case assumptions, while the same eventual business outcome purchased at $298-$428 compresses bull case annualised returns to roughly 11-35% and turns bear case returns negative.