
Tesla at 90x Earnings: a Framework for Valuing Transitioning Stocks
6 mins ago

At a trailing price-to-earnings ratio of roughly 376x, Tesla is either one of the most rational bets in the market or one of the most dangerous. The difference between those two verdicts comes down entirely to which future an investor believes is being priced in. Tesla’s Q1 2026 earnings, reported on 22 April 2026, crystallised a dynamic that appears in every high-optionality stock: the same set of financial results produced a $600 price target from one credible analyst and an approximately $25 target from another. Neither analyst is being careless. They are reaching different conclusions because they are modelling different companies. This guide uses that divergence as a teaching vehicle for stock valuation analysis, one of the most practical skills in investing: building and stress-testing bull and bear scenarios to understand what a share price is actually assuming, and whether the entry price makes the risk worth taking. Readers will finish with a repeatable framework for scenario-based valuation, an understanding of how revenue growth, margin, and multiple assumptions interact to produce return outcomes, and a clear grasp of why entry price is often the single most consequential variable in any investment.
Dan Ives at Wedbush rates Tesla Outperform with a $600 price target. Gordon Johnson at GLJ Research rates it Sell with a target of approximately $25. The gap between them is $575, and neither analyst is ignoring the other’s data.
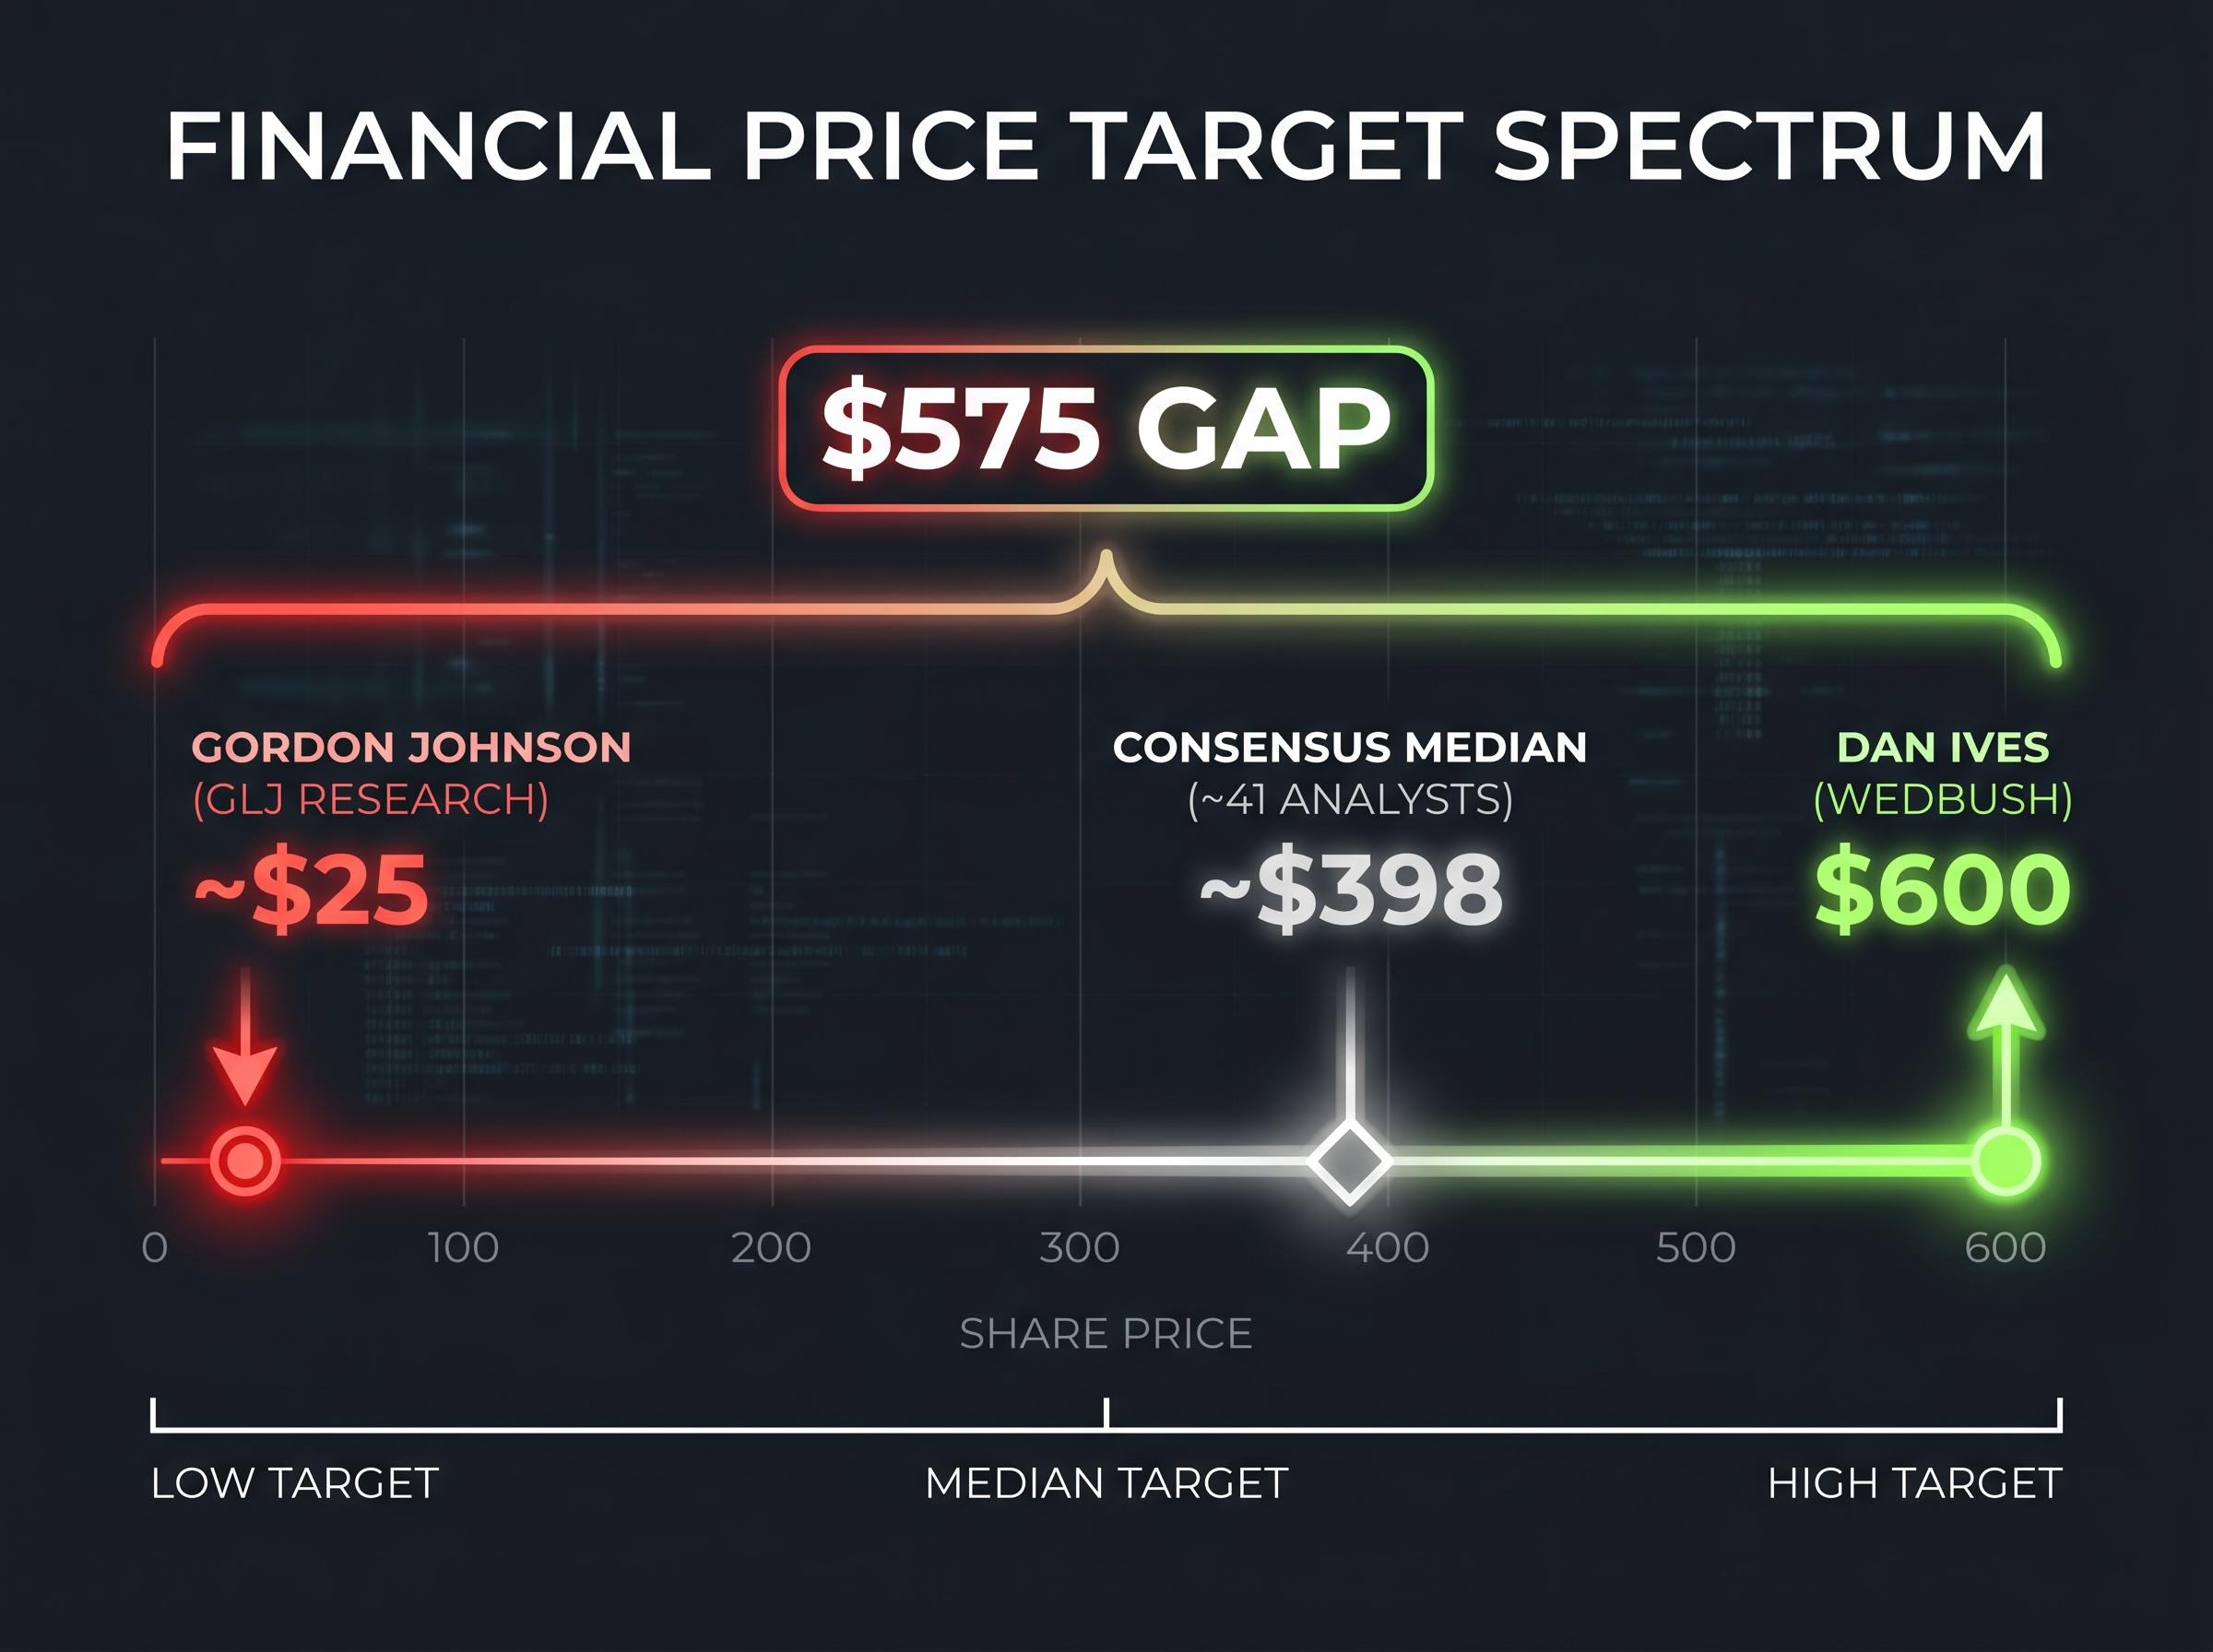
The $575 separating the highest and lowest credible price targets on the same stock is not a failure of analysis. It is the clearest signal available about how much the valuation depends on which company Tesla is modelled as.
The disagreement is structural. Tesla’s future business model is genuinely uncertain, and the valuation an analyst arrives at depends almost entirely on which version of the company they choose to model. Three competing identities are in play:
The analyst consensus of approximately 41 analysts carries a median target of roughly $398. That figure masks a bimodal distribution rather than a tight cluster of agreement. According to a Bank of America global fund manager survey from April 2026, 45% of approximately 250 surveyed institutions are overweight Tesla on AI and robotics optionality. Only 25% weight core EV business above 50% in their models.
This is the first practical skill in scenario analysis. Price target dispersion is a signal about valuation model inputs, not analyst competence. Investors who grasp this stop asking “which analyst is right” and start asking “which assumptions should I stress-test.”
A scenario model does not predict which future will arrive. It maps the range of possible futures and assigns each a probability, so that the output is a weighted distribution of outcomes rather than a single forecast.
The standard three-scenario framework (bull, base, bear) is built on three input levers that drive each scenario’s valuation:
These levers are not independent. Margin assumptions should be consistent with the revenue growth narrative. A company achieving 25%+ gross margins is likely doing so because higher-margin software revenue is growing as a share of the mix, which in turn justifies a higher earnings multiple. If the assumptions within a single scenario contradict each other, the scenario is broken before it produces a number.
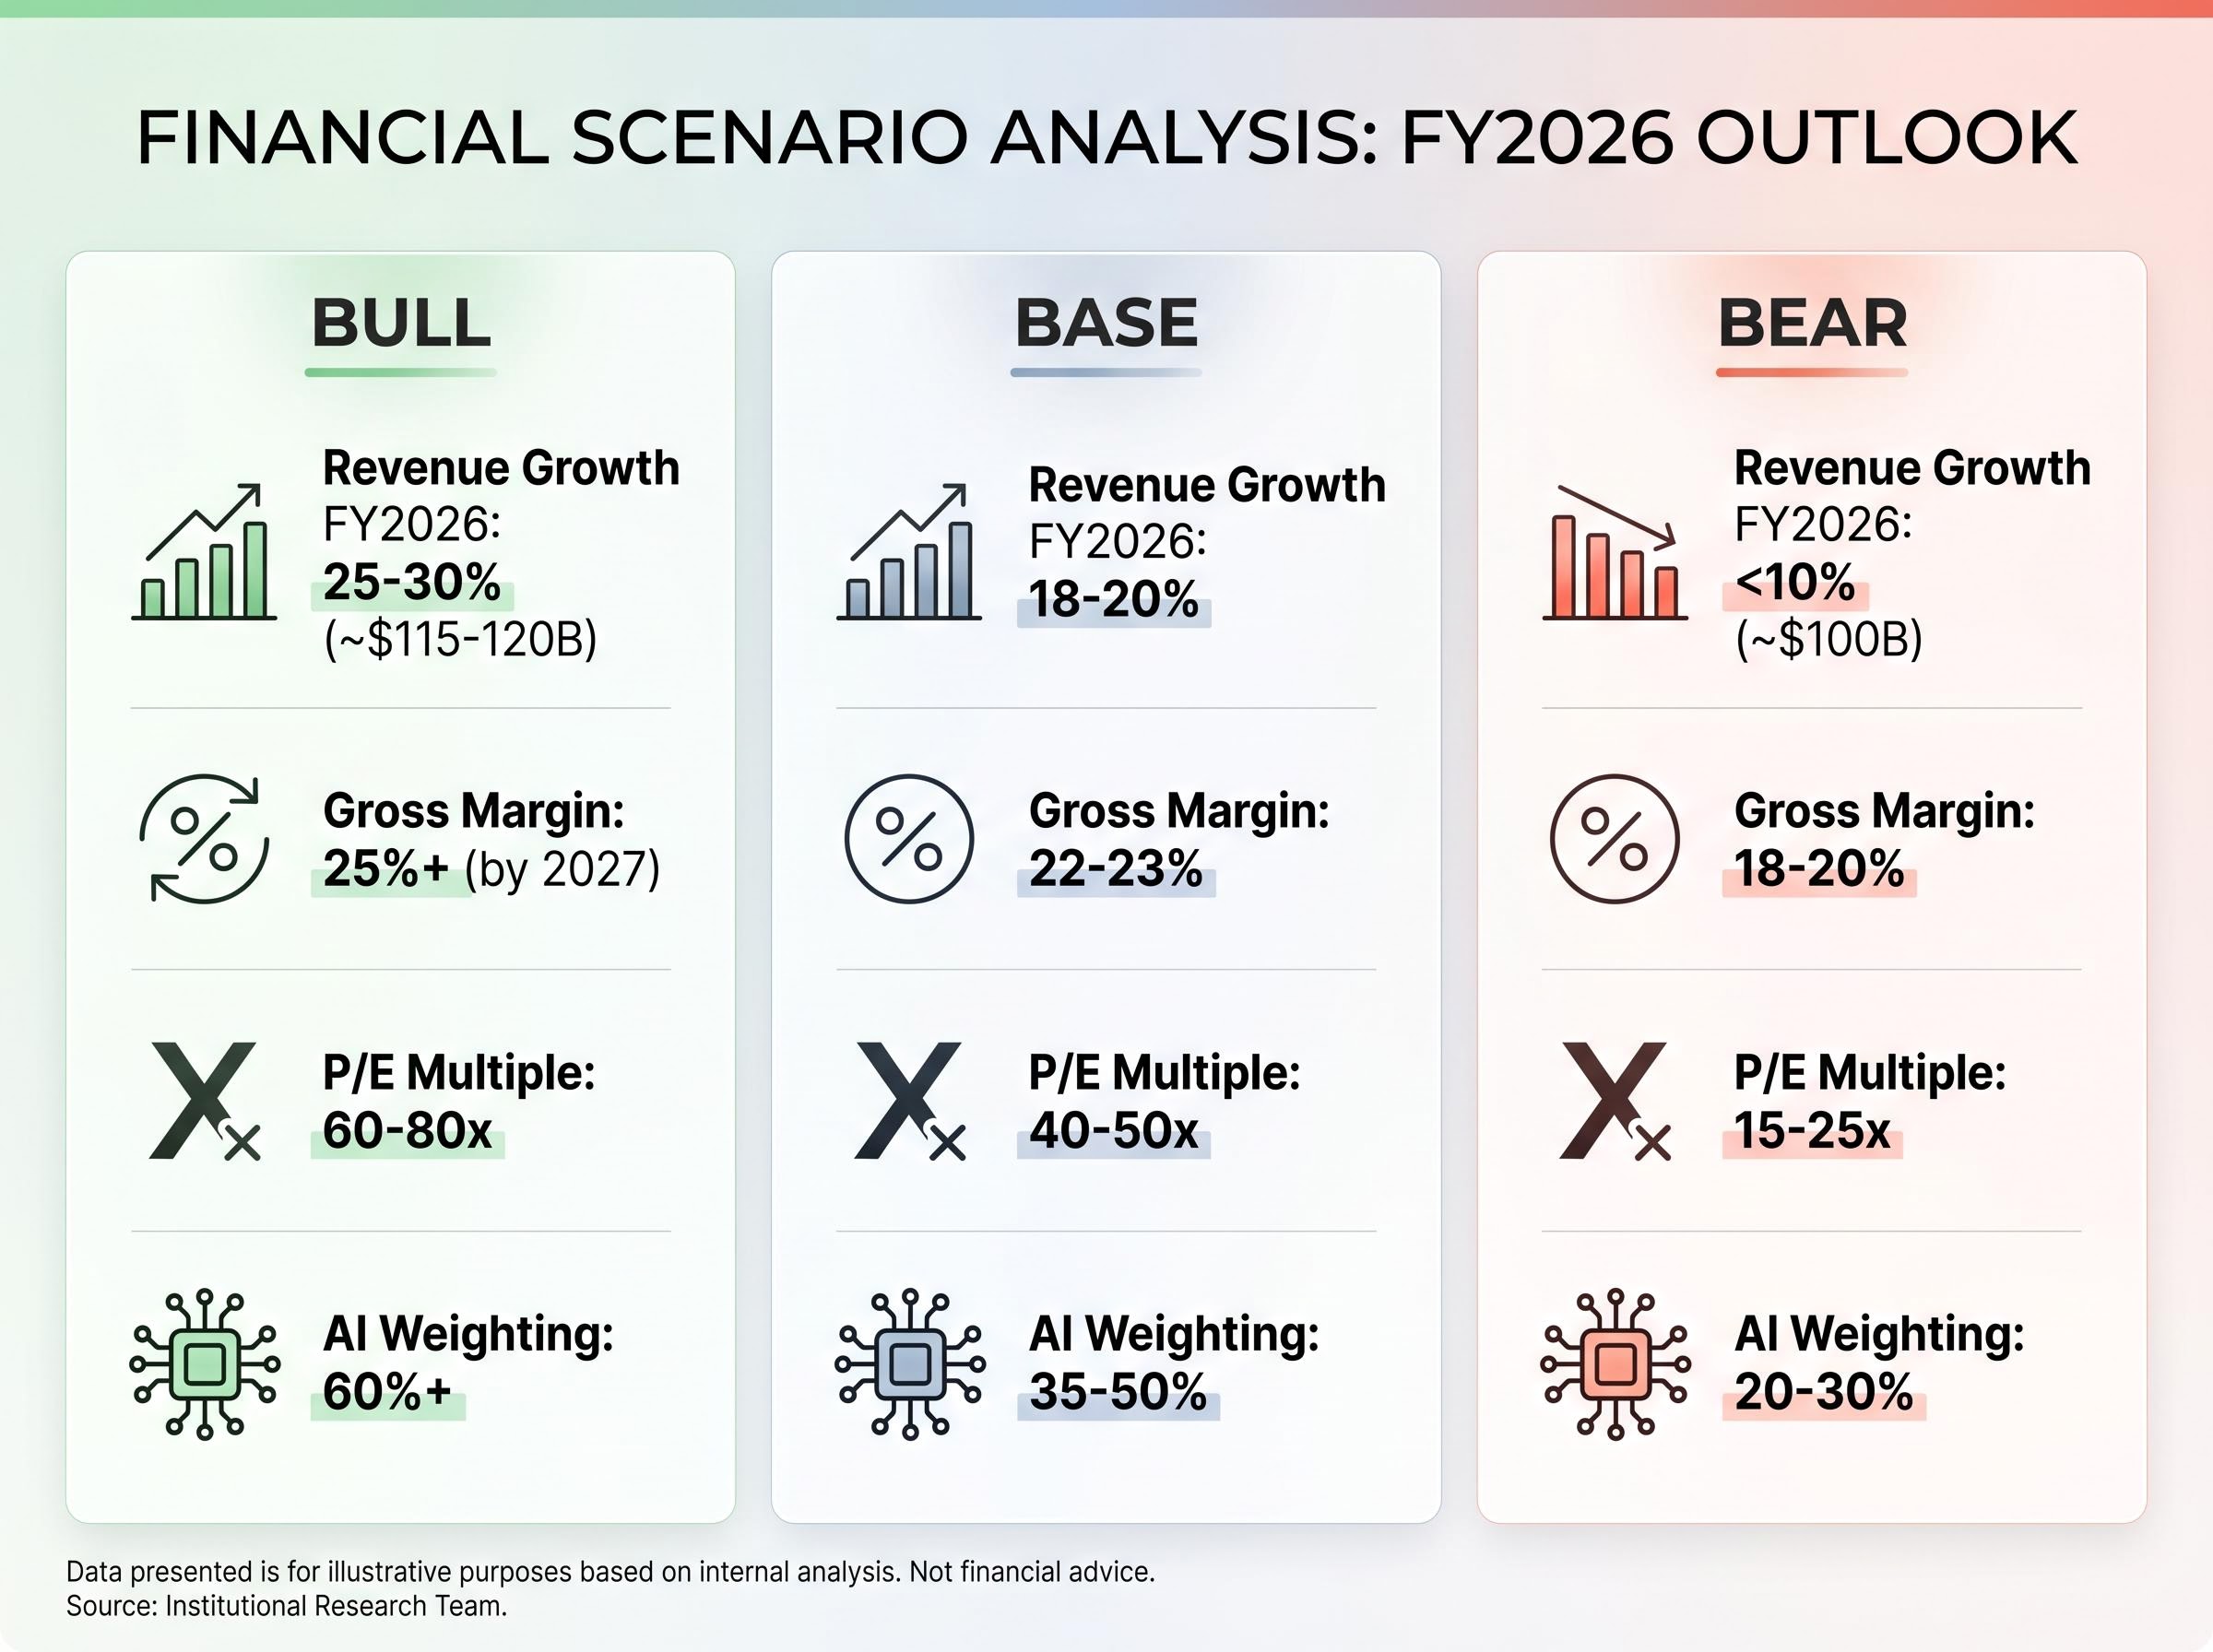
| Scenario | Revenue Growth FY2026 | Gross Margin | P/E Multiple | AI Weighting |
|---|---|---|---|---|
| Bull | 25-30% (~$115-120B) | 25%+ (by 2027) | 60-80x | 60%+ |
| Base | 18-20% | 22-23% | 40-50x | 35-50% |
| Bear | <10% (~$100B) | 18-20% | 15-25x | 20-30% |
Institutional models have shifted AI and autonomy weighting from approximately 20% of Tesla’s total value in 2025 to 35-50% in 2026. That shift alone changes the implied fair value by hundreds of dollars per share, even if earnings estimates remain unchanged.
A best-practice triangulation approach reduces the risk of anchoring to any single methodology:
Investors who understand how the three input levers interact can immediately identify which assumption is doing the most work in any analyst model. That identification is the first step to deciding whether the assumption is credible.
The dividend discount model, which values a stock as the present value of its future income stream, is the methodological opposite of how Tesla is priced: it anchors valuation to cash already distributed to shareholders rather than to a speculative future business that has not yet generated revenue at scale.
The bull case starts with a revenue growth assumption of 25-30% for FY2026, implying roughly $115-120 billion in total revenue. Tesla reported $22.387 billion in Q1 2026, representing 16% year-over-year growth. Reaching the bull case top line requires a meaningful acceleration in the remaining three quarters, and that acceleration cannot come from vehicle deliveries alone.
FSD monetisation and robotaxi revenue need to contribute at a commercial scale. Tesla’s Austin robotaxi launch has been pushed to approximately June 2026, and its FSD permit under California DMV rules still requires safety drivers for unsupervised tests through at least Q3 2026. Autonomous vehicle miles nearly doubled versus the prior period in Q1, which bulls cite as progress. Whether that progress translates to revenue within the FY2026 window is the assumption bearing the most weight.
Dan Ives at Wedbush projects gross margins reaching 25%+ by 2027, up from the 21.1% reported in Q1 2026. That expansion requires the software and autonomy revenue mix to grow as a share of total revenue, not merely cost reduction in auto manufacturing. Software carries structurally higher margins than vehicle hardware, but it has to exist at scale first.
The multiple assumption follows from the margin assumption. A 60-80x forward P/E is defensible by peer comparison only if Tesla’s revenue mix has shifted enough to resemble a technology company at the time of measurement. If the mix remains predominantly automotive, the multiple compresses regardless of the earnings trajectory.
ARK Invest’s Cathie Wood maintains a $2,600 bull case target for 2029, premised on 50%+ compound annual growth from robotaxi and Optimus, 40%+ margins, and a P/E exceeding 100x. Source analysis assigns this full bull case a probability of roughly 5-10% of materialising. Estimated annualised returns under such a scenario range from approximately 11-35% over a ten-year horizon.
The bull case is not incoherent. It is a chain of interdependent assumptions: revenue acceleration requires autonomy revenue, margin expansion requires that revenue to carry software-like margins, and the multiple requires the market to reclassify Tesla as a technology platform. Each link depends on the one before it. Identifying which link is most likely to break is what separates conviction from hope.
The bear case is not a prediction that Tesla fails. It is a disciplined constraint exercise that asks: what happens if Tesla remains a strong EV company but the AI and autonomy transformation does not materialise on the timeline the share price implies?
Revenue growth below 10% for FY2026, implying roughly $100 billion, assumes no meaningful AI or robotics contribution. This is not an implausible scenario. Q1 2026 deliveries came in at 358,000 units, missing consensus expectations. BYD surpassed Tesla as the world’s largest EV producer by volume. FY2025 revenue was reportedly down approximately 3% year over year.
The bear case margin floor of 18-20% gross margin reflects competitive pricing pressure Tesla has already demonstrated. This is not a collapse assumption; it is a “strong EV company” assumption. Free cash flow turned negative in Q1 2026, with FY2026 capital expenditure projected to exceed $25 billion.
The multiple compression logic is where the mathematics become most instructive. If Tesla is valued as an automaker at 15-25x P/E rather than a technology platform at 60-80x, the return profile changes categorically.
| Analyst/Firm | Price Target | Key Multiple Assumption | Primary Bear Rationale |
|---|---|---|---|
| Gordon Johnson, GLJ Research | ~$25 | 15-20x P/E on EV-only fundamentals | 18-20% gross margin; delivery miss; no AI revenue contribution |
| Dan Levy, Barclays | $360 | 40x P/E with 30% AI weighting | 22% gross margin; neutral on Q1; limited near-term autonomy contribution |
Source analysis indicates that at an entry price of approximately $375 per share, bear case projected returns are all negative. Even the most optimistic inputs within the bear scenario produce no positive return. The question is not whether Tesla can grow. It is whether the growth already embedded in the share price leaves any return for the investor buying today.
Consider two investors who both believe Tesla’s bull case will materialise. One purchased shares at approximately $100 a few years ago. The other is buying at the current price of $428.37 on 8 May 2026. Both hold through the same outcome. Their return profiles are radically different.
Tesla’s 52-week range spans $273.21 to $498.83. The stock has traded as low as roughly $100 in recent years and as high as nearly $500. The underlying business thesis may be identical for both entry points, but the mathematics of return are not.
Buying the right story at the wrong price is still a bad investment.
Margin of safety is the investor’s structural protection against scenario error. The wider the gap between an intrinsic value estimate and the entry price, the more assumptions can be wrong without destroying the investment. When the bull case carries a probability of roughly 5-10% of full materialisation, and that is the only scenario producing positive returns at today’s price, buying at $428 is effectively a concentrated bet on a low-probability outcome, regardless of how compelling the narrative sounds.
Probability-weighted scenario analysis converts three narrative outcomes into a single blended expected return, a mechanism that forces investors to confront honest probability estimates rather than defaulting to the headline return of the most optimistic case, which is the error most visible at Tesla’s current multiple.
Forward analyst EPS estimates project more than 5x growth from current levels. Those estimates already incorporate autonomy and AI contributions that have not yet generated revenue at scale.
Evaluate entry price sensitivity in three steps:
This is the most practically actionable concept in this guide. An investor who internalises entry price sensitivity will automatically stress-test embedded scenario assumptions before every new position.
The Tesla case teaches a methodology, not a verdict. The following five-step process applies to any high-optionality stock where the future business model is genuinely uncertain:
Write down assumptions before looking at the current share price. Anchoring the scenario to where the stock is trading, rather than to what the business can plausibly earn, is one of the most common errors in valuation work.
One practical warning stands above the others in the Tesla case. When a company’s entire positive return case depends on a business that does not yet exist generating revenue on a timeline that has historically slipped, the probability weight assigned to that scenario should be lower than the narrative energy surrounding it suggests.
Elon Musk’s timeline track record provides a pattern, not a collection of isolated anecdotes. In 2016, Tesla claimed full self-driving hardware was present in all vehicles. In 2019, Musk predicted one million robotaxis on the road by 2020. In 2021, Optimus was described as deployment-ready by 2022. None materialised on the stated schedule.
Institutional models shifted AI and autonomy weighting from approximately 20% in 2025 to 35-50% in 2026. That shift illustrates how quickly narrative can move asset allocation ahead of execution. An investor applying the five-step framework should quantify the discount: if a company’s transformational timelines have slipped by an average of two to three years historically, the probability weight assigned to near-term materialisation should reflect that pattern explicitly.
Historical precedents for extreme multiples show that Amazon’s AWS transition and Nvidia’s AI pivot both validated optically indefensible P/E ratios in hindsight, but both cases also involved severe drawdowns before the thesis proved out, a pattern that investors extrapolating Tesla’s trajectory should weight explicitly in their scenario probabilities.
The bear case at current prices is not a prediction that Tesla’s transformation fails. It is a mathematical observation: the share price already prices in outcomes that have not happened yet. A company can be right about its future and still be a poor investment at a specific entry point if the market has already captured that future in the price.
Systematic underpricing of risk at the index level creates a market environment where individual stock premiums, including Tesla’s 376x trailing P/E, face an additional compression catalyst if macro conditions force a broad multiple reset, an interaction that scenario models built on company fundamentals alone do not capture.
The framework presented in this guide does not tell investors whether to buy Tesla. It tells them what they are implicitly betting on when they do. At $428.37, the bet is concentrated on AI and autonomy revenue streams that remain pre-commercial, on margin expansion that requires a business mix shift still in progress, and on a valuation multiple that assumes reclassification from automaker to technology platform. That transparency is the entire point of scenario analysis.
The investor’s job is not to predict which scenario is correct. It is to be compensated adequately for the uncertainty of not knowing. Only the entry price can provide that compensation.
This article is for informational purposes only and should not be considered financial advice. Investors should conduct their own research and consult with financial professionals before making investment decisions. Past performance does not guarantee future results. Financial projections are subject to market conditions and various risk factors. Forward-looking statements referenced in this article, including analyst price targets and scenario assumptions, are speculative and subject to change based on market developments and company performance.
Scenario-based stock valuation analysis maps a range of possible futures for a company by adjusting three key input levers: revenue growth rate, net profit margin, and valuation multiple. Each scenario is assigned a probability, producing a weighted expected return rather than a single forecast.
Analysts reach widely different price targets when a company's future business model is genuinely uncertain. For Tesla, the gap between a $600 bull target and a $25 bear target exists because each analyst is modelling a different company: one a tech and AI platform, the other a conventional automaker with sector-appropriate multiples.
Entry price determines how much of the future upside an investor is paying for before it materialises. At a high entry price, even a correct long-term thesis can produce poor returns if the market has already priced in optimistic outcomes, leaving no margin of safety if assumptions prove wrong.
Margin of safety is the gap between a stock's estimated intrinsic value and its current market price. It is calculated by comparing the probability-weighted blended value across bull, base, and bear scenarios to the entry price; the wider the gap in the investor's favour, the more room for error in the underlying assumptions.
Investors should apply an explicit execution risk discount to probability weights assigned to transformational scenarios, particularly when a company has a documented history of timeline slippage. If near-term milestones have historically slipped by two to three years, the probability assigned to on-schedule materialisation should be reduced accordingly.


