What UK Traders Lose When Their CFD Account Goes Offshore
42 mins ago

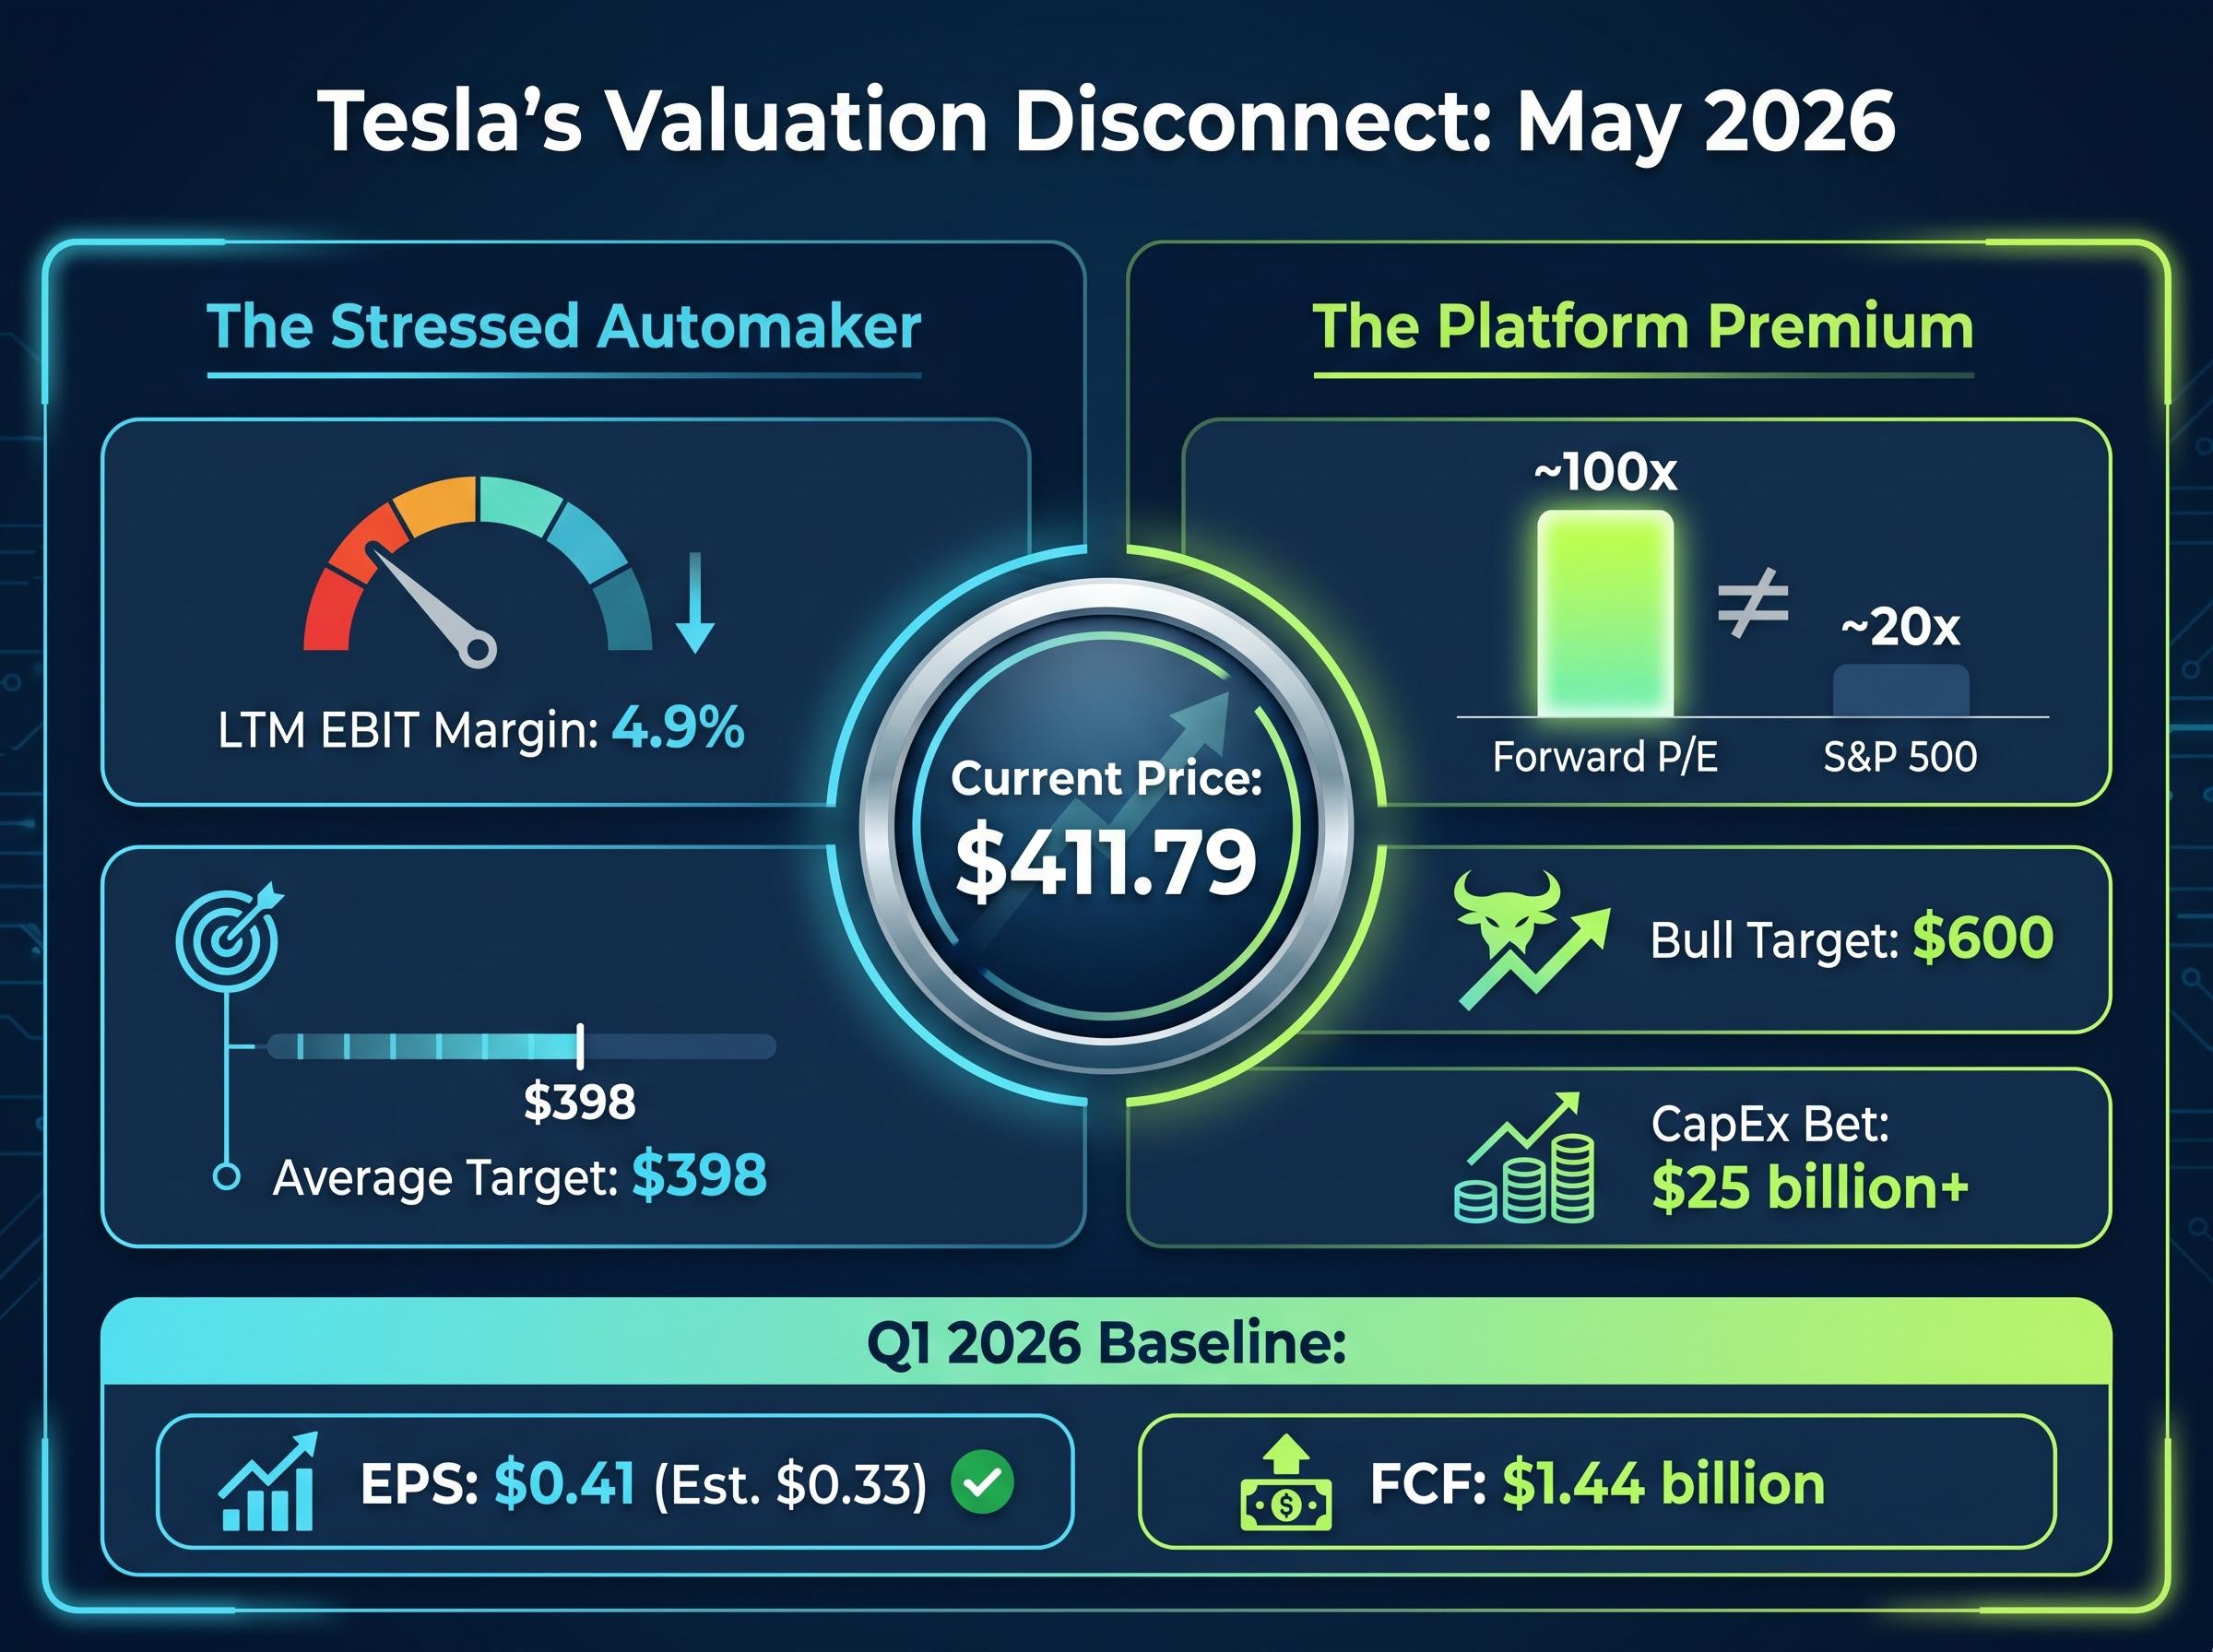
At $411.79 per share with a forward price-to-earnings ratio near 100x, Tesla is already priced above the average analyst consensus target of approximately $398. Anyone buying today is, by definition, betting on an above-average outcome. That bet is not irrational, but it demands a framework more disciplined than conviction alone.
Tesla’s Q1 2026 earnings created a valuation problem that standard tools cannot resolve cleanly. An earnings-per-share beat ($0.41 vs. $0.33 estimated) and positive free cash flow of $1.44 billion sit alongside a $25 billion+ capital expenditure commitment to businesses (Robotaxi, Optimus) that management says will not contribute materially until 2027. The stock is simultaneously easy to justify and easy to dismiss, depending entirely on which scenario the investor weights most heavily.
This guide uses Tesla’s current valuation as a live case study to teach a transferable methodology: how to build bull, base, and bear scenarios for any company in strategic transition, how to assign probabilities to each, and why the price paid at entry often matters more than which scenario ultimately plays out.
The instinct is reasonable. Pull up a trailing P/E ratio, compare it to the sector, and draw a conclusion. For most companies, that instinct works. For Tesla in May 2026, it produces two contradictory answers simultaneously, and neither is wrong.
Standard equity valuation models, including the dividend discount model and its close relatives, are built on the premise that a stock’s worth equals the present value of its future cash flows, an assumption that holds cleanly for mature, dividend-paying businesses but breaks down when the majority of projected value resides in business lines that do not yet generate revenue.
A 4.9% last-twelve-month EBIT margin looks like a stressed automaker grinding through a pricing war. A forward P/E of approximately 100x looks like a software platform business whose best revenue streams have not yet switched on. Both readings are drawn from the same company’s financials. The contradiction is not noise to be resolved; it is a signal that a different analytical framework is required.
Tesla’s forward P/E sits near 100x. The S&P 500 trades at approximately 20x. The gap is not a valuation error; it is the market pricing two fundamentally different businesses inside one ticker.
Three categories of standard metrics consistently mislead when applied to companies mid-pivot between business models:
The consensus analyst target of approximately $398 already sits below Tesla’s current price of $411.79, while the bull end of the analyst range stretches to $600. That spread, more than $200 between the average and the optimist, is itself evidence that single-metric valuation has broken down. The market is not debating what Tesla is worth today. It is debating which future Tesla becomes.
Analyst price target dispersion on Tesla reached its widest recorded level for a large-cap stock in early May 2026, with the range spanning from $119 to $600, a gap that itself quantifies how fundamentally different the underlying scenario assumptions must be across institutional research teams.
Investors who recognise this pattern can avoid the two most common errors: dismissing a stock as overvalued because trailing metrics look stretched, or buying it because the future sounds exciting, without ever constructing a disciplined framework for the space between those positions.
The solution to a broken single-metric valuation is not a better single metric. It is a structured set of alternative futures, each defined by explicit assumptions that can be tested against incoming data.
Four input variables must be defined for each scenario before any probability is assigned. These are the levers that drive the divergence between outcomes:
The order matters. Scenarios built backward from a desired conclusion are worthless. Scenarios built from operational assumptions first produce honest analysis.
| Revenue Growth | EBIT Margin Target | New Business Timeline | CapEx Return | Implied Outcome |
|---|---|---|---|---|
| Bull: 25%+ | Recovery toward 16%+ | Robotaxi/Optimus material by 2027 | Above 1.5x | Significant upside; platform re-rating |
| Base: ~13% | Stabilising around 8% | New businesses contributing by 2029 | ~1x | Flat to modest return from current levels |
| Bear: 5-9% | Continued compression | Not materialising within 10 years | Below 1x | Material downside; capital destruction |
The $25 billion+ CapEx guidance is the central variable separating the base case from the bear case. In the base case, that spending generates adequate returns on a longer timeline. In the bear case, it burns cash without producing revenue, and the auto business cannot fund the gap indefinitely.
Tesla’s Q1 gross margin beat (21.7% vs. 17% estimated) is a meaningful signal for bull-case calibration: it suggests near-term pricing power may be stronger than the market assumed. Whether that signal persists is exactly what subsequent quarters will reveal.
The scenario construction step is where most retail investors stop, mistaking scenario-building for the final answer. It is not. Scenarios are inputs to a probability model, not conclusions.
Three scenarios sitting on a page are three stories. Probability weighting converts them into a single number that can be compared against the price on the screen.
The mechanism is straightforward. Assign a percentage likelihood to each scenario. Multiply each scenario’s implied return by its probability. Sum the results. Compare the blended expected return to a target internal rate of return (IRR), the minimum annual return an investor requires to justify the risk.
| Scenario | Probability | Implied Return | Contribution to Blended Return |
|---|---|---|---|
| Bull | 30% | ~3x | +90% |
| Base | 50% | ~0% | 0% |
| Bear | 20% | ~negative 50% | negative 10% |
| Blended | 100% | +80% (illustrative) |
At $411.79, achieving a 15% annualised IRR requires weighting the bull case at above 25%. That is a higher threshold than the consensus target of approximately $398 implies the average analyst assigns. The uncomfortable implication: anyone buying at today’s price is, by construction, more optimistic than the street average.
Institutional capital allocation signals from Berkshire Hathaway reinforce the probability-weighting discipline the current framework demands: with $397 billion in cash reserves as of Q1 2026 and a stated preference for deploying capital only when margin-of-safety conditions are met, the world’s most scrutinised value allocator is implicitly communicating that the current pricing environment requires above-average selectivity at entry.
At $411.79, the consensus target of $398 already implies slight downside from the average analyst view. Current buyers are, by construction, weighting above-consensus outcomes.
Analyst EPS estimates project more than 5x growth from current levels, an assumption embedded within the bull probability. Whether that growth materialises depends on every variable in the scenario table above. The probability-weighting framework does not predict which scenario will occur. It quantifies how much optimism is already baked into the price.
The same three scenarios, the same probability weights, and the same implied returns produce a fundamentally different investment decision depending on where the investor entered.
An investor who purchased Tesla at approximately $100 per share a few years prior holds a position where even the base-case outcome (flat to modest return from current levels) already represents a substantial gain on cost. The bear case still leaves that investor with a positive total return. The margin of safety is wide because the entry price was low relative to the distribution of outcomes.
At $411.79, the math inverts. The base case implies flat to negative returns. The bear case implies a loss of roughly half the investment. Only the bull case, which requires Robotaxi and Optimus to contribute materially by 2027 and EBIT margins to recover toward 16%+, delivers a return that justifies the risk.
Scenario analysis and entry price analysis are inseparable disciplines. The same company, the same thesis, and the same probability weights produce opposite conclusions at different prices. The price paid is not a passive variable. It is an active determinant of which scenario the investor needs to be right about.
Analogues are not decorative comparisons. They are probability-calibration tools. After building scenario assumptions, the question is whether those assumptions are more consistent with the pattern of a company whose transition succeeded or one whose transition failed.
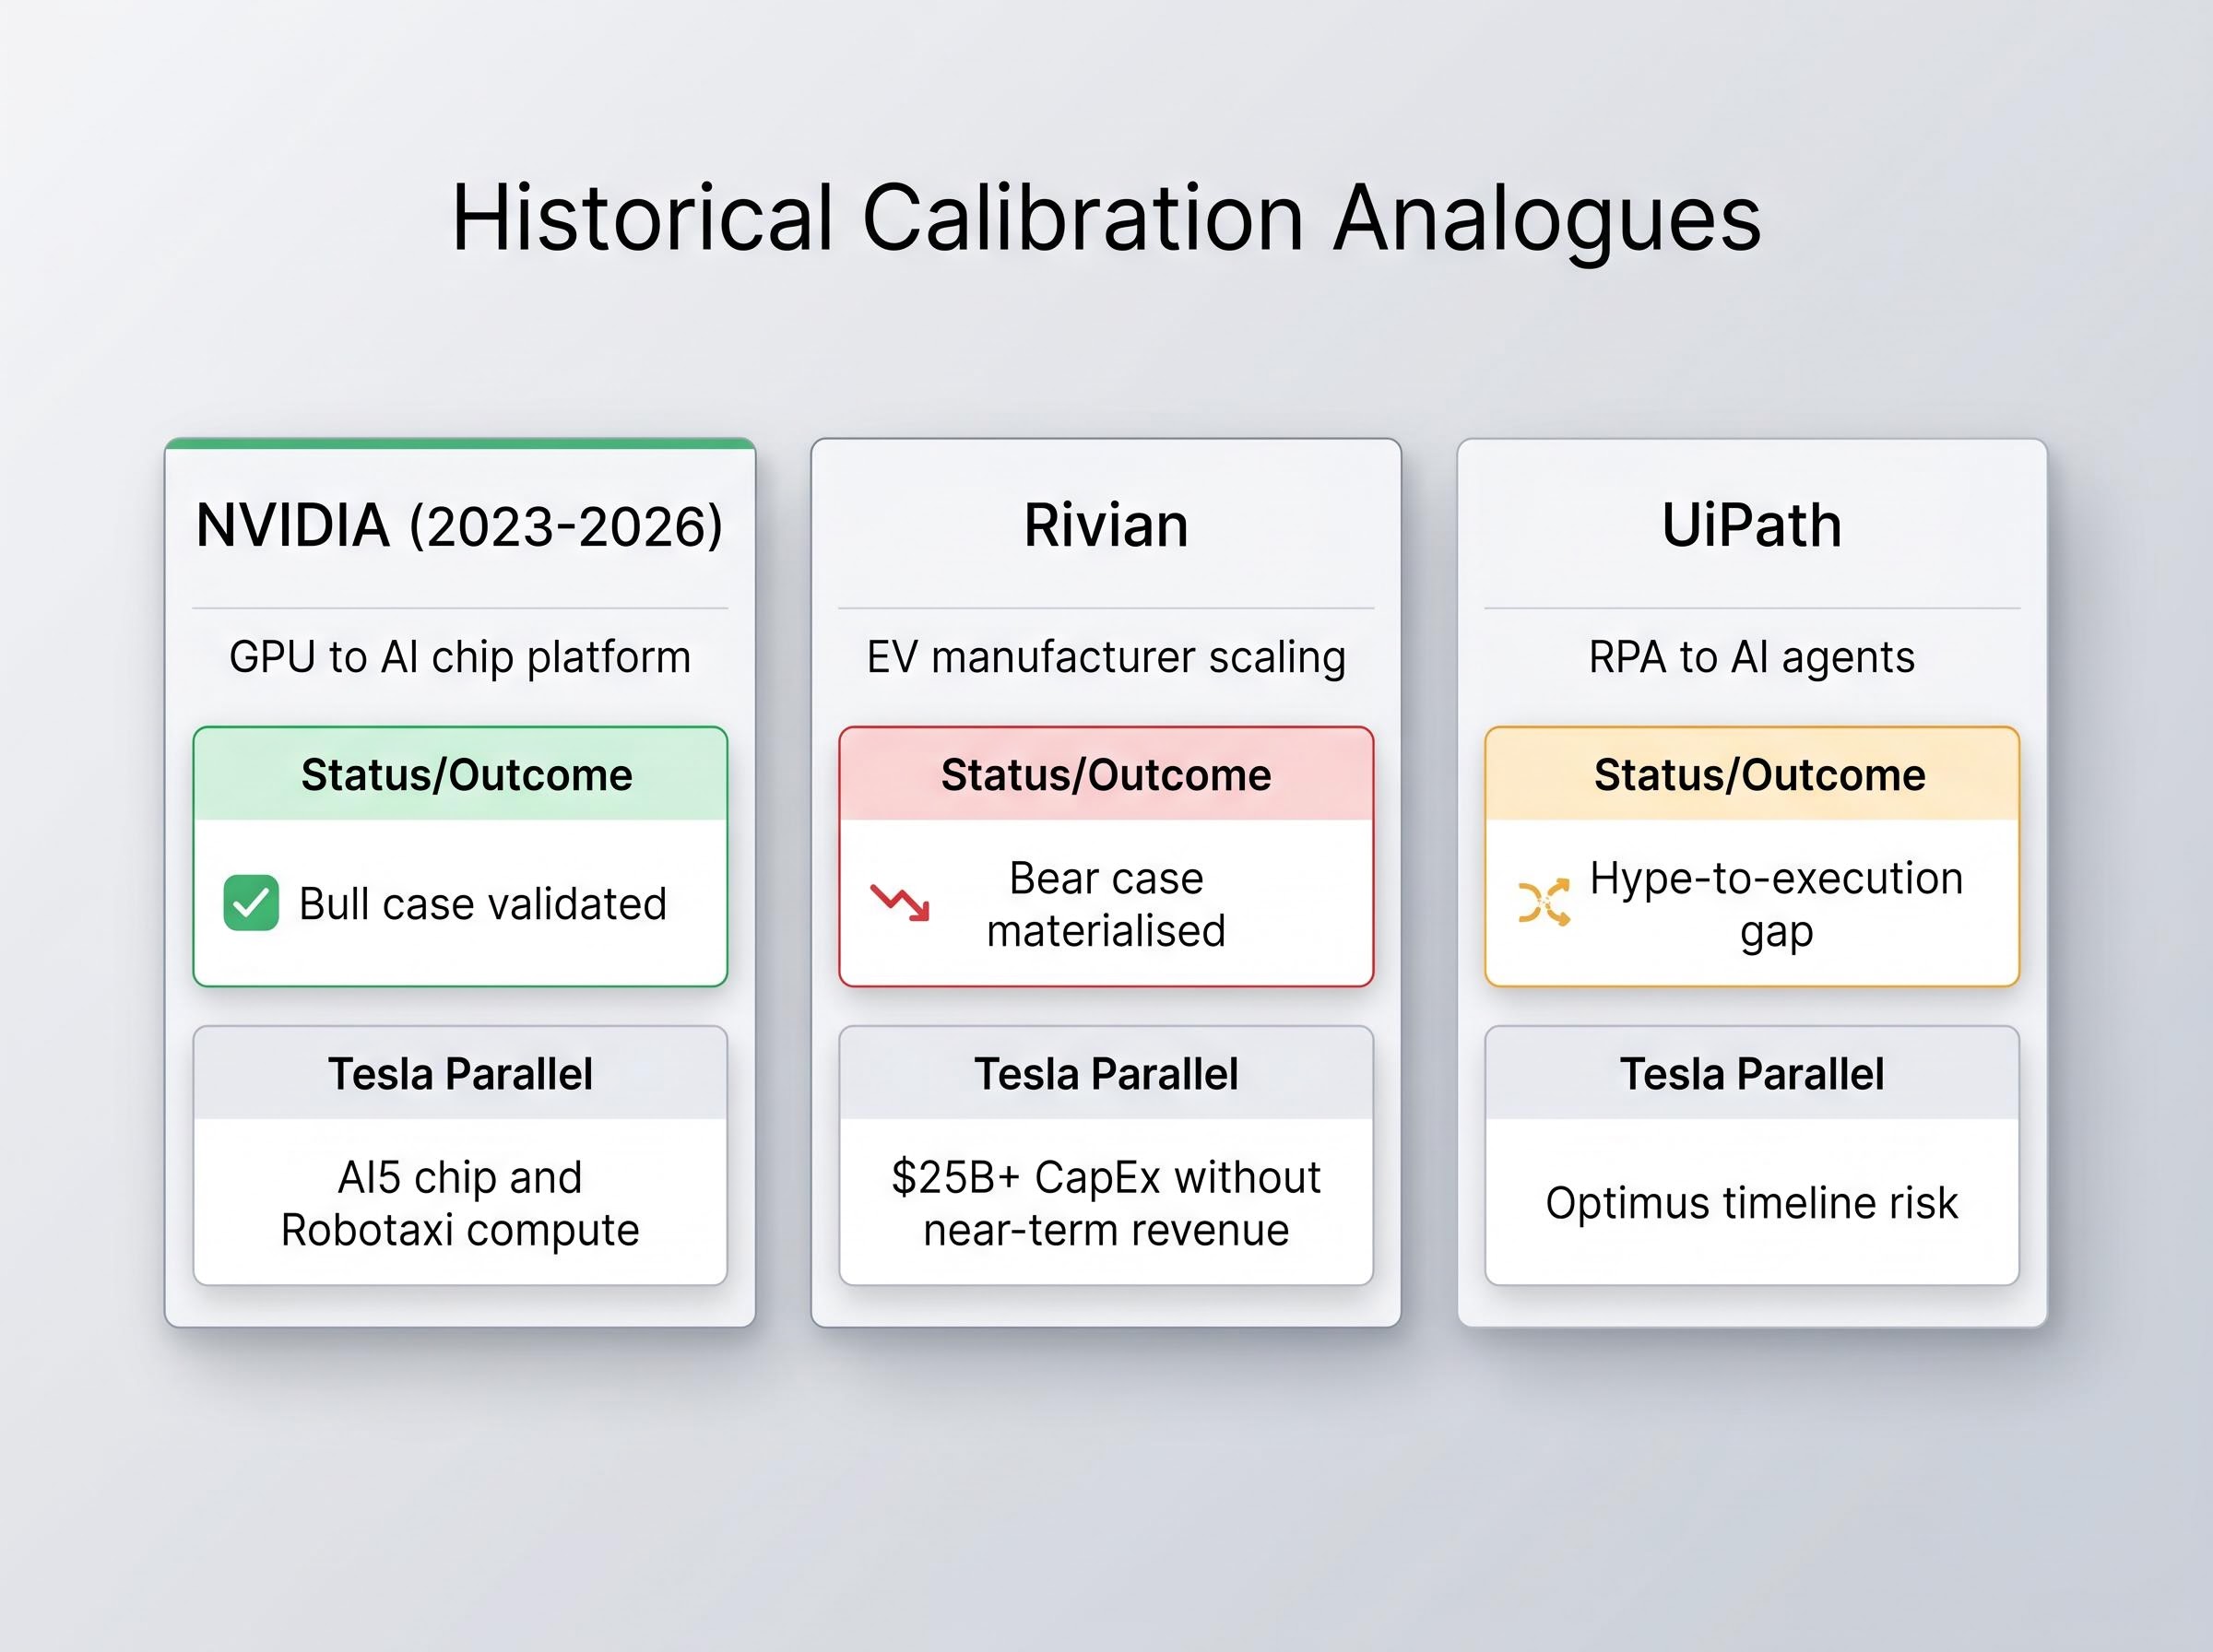
NVIDIA’s 2023-2026 AI platform pivot is the bull-case validation template. Early investors who assigned elevated probability to the AI thesis at premium multiples were rewarded when data centre revenue validated the investment case. The parallel to Tesla is direct: both companies committed large-scale capital expenditure to an AI-adjacent platform shift before the revenue arrived. NVIDIA’s outcome demonstrates that paying a premium for a platform transition can generate outsized returns, provided execution follows. (Specific return figures carry data uncertainty; investors should verify current data via Yahoo Finance or Macrotrends.)
Rivian is the bear-case realisation template. High capital expenditure, delivery shortfalls, and margin compression destroyed value across a multi-year period. The parallel to Tesla’s $25 billion+ CapEx commitment is uncomfortably precise: both involve spending aggressively on unproven businesses before near-term revenue generation can fund the outlay.
UiPath offers a third calibration point. Its AI hype-to-execution gap, where initial optimism about the AI agents transition met slowing growth, resulted in a significant drawdown. A scenario-weighted framework applied early would have flagged the divergence between the narrative and the operating metrics.
| Company | Transition Type | Outcome Pattern | Tesla Parallel | Framework Lesson |
|---|---|---|---|---|
| NVIDIA | GPU to AI chip platform | Bull case validated | AI5 chip and Robotaxi compute investment | Premium multiples can be justified if execution follows |
| Rivian | EV manufacturer scaling | Bear case materialised | $25B+ CapEx without near-term revenue | High-CapEx transitions without revenue destroy value |
| UiPath | RPA software to AI agents | Hype-to-execution gap | Optimus timeline risk | Narrative-operating metric divergence is the earliest warning |
When selecting an analogue, three questions sharpen the comparison:
Tesla’s Q1 2026 free cash flow of $1.44 billion was positive, but the full-year outcome against $25 billion+ in planned CapEx is the sorting signal. That trajectory will determine whether the company tracks closer to the NVIDIA pattern or the Rivian pattern over the next four to six quarters.
Scenario probabilities are not fixed at purchase. They are hypotheses that incoming data either strengthens or weakens each quarter.
Four specific metrics serve as real-time scenario update signals for Tesla, ranked by their impact on the bull-to-bear probability distribution:
Elon Musk’s timeline precedents offer a base rate for calibration. In 2016, full-autonomy hardware was claimed to be ready. In 2019, one million robotaxis were projected. In 2021, Optimus deployment was announced. All slipped materially. This pattern does not mean current timelines will slip, but it establishes a historical base rate that disciplined investors should incorporate when weighting bull-case probabilities tied to management’s stated timelines.
The four-trigger model generalises beyond Tesla. For any company undergoing a strategic pivot, define monitoring triggers across these categories before committing capital:
The discipline is in the timing: triggers must be quantitative where possible and defined before purchase, not constructed after the fact to justify a view that has already formed. Pre-defining them removes the psychological pressure to rationalise disappointing results and converts portfolio management from a narrative exercise into an evidence-based probability update process.
Every element of this framework, the scenarios, the probability weights, the analogue calibration, the monitoring triggers, only produces a useful answer when anchored to the price actually paid. Two investors holding identical Tesla scenario models arrive at opposite conclusions if one bought at $100 and the other at $411.79.
At $411.79 with a consensus target of approximately $398, the current price already embeds optimism. The margin of safety is thin even if management executes well on the transition. The bull case must not only play out; it must play out sufficiently to justify an entry point that the average analyst already considers slightly stretched.
The broader US equity valuation context matters for calibrating entry price discipline: the Buffett Indicator reached 223.6% in May 2026, a level exceeding dot-com bubble peaks, and Berkshire Hathaway’s $373 billion cash reserve signals that even the most sophisticated institutional allocators are not finding widespread margin-of-safety opportunities at current market prices.
The discipline of scenario-weighted valuation is most valuable not when the outlook is clear but precisely when it is not. That is always the condition that produces both the greatest risk and the greatest opportunity. The framework does not eliminate uncertainty. It prices it, honestly and explicitly, so the investor knows exactly what bet the entry price is asking them to make.
This article is for informational purposes only and should not be considered financial advice. Investors should conduct their own research and consult with financial professionals before making investment decisions. Past performance does not guarantee future results. Financial projections are subject to market conditions and various risk factors.
Scenario-based stock valuation analysis involves building three alternative futures (bull, base, and bear cases) with explicit assumptions for revenue growth, margin trajectory, and capital expenditure returns, then assigning probabilities to each to calculate a blended expected return that can be compared against the current share price.
Trailing earnings multiples and margin comparisons reflect the old business model's profitability rather than the new one's potential, meaning a company mid-pivot between business models can simultaneously look overvalued on trailing metrics and reasonably priced on forward platform assumptions, producing contradictory readings from the same financials.
Two investors holding identical scenario models and probability weights arrive at opposite conclusions if one bought at $100 and another at $411.79, because a low entry price means even the base case delivers a positive return, while a high entry price requires the bull case to materialise just to break even.
Investors should pre-define four trigger categories before committing capital: a margin threshold that separates the old business funding the transition from failing to fund it, a regulatory or approval milestone gating the new business, a production or deployment target testing scalability, and a capital efficiency metric measuring returns per dollar of spending.
NVIDIA's AI platform pivot validated that premium multiples can be justified when execution follows large-scale capital commitment, while Rivian demonstrated that high CapEx without near-term revenue generation destroys value; comparing a target company's CapEx structure, competitive moat, and revenue timeline to these patterns sharpens the probability assigned to each scenario.