
How to Value a Stock When Its Future Looks Nothing Like Today
28 mins ago

At roughly $428 per share in early May 2026, Tesla is priced as though its robotaxi network, Optimus humanoid robot, and AI platform will all materialise on schedule. Strip those away and value the company purely on its automotive business, and every modelled scenario produces negative projected returns at the current entry price. That gap, between the stock’s price and what the existing business alone can justify, is the single most important number in any stock valuation analysis of this company.
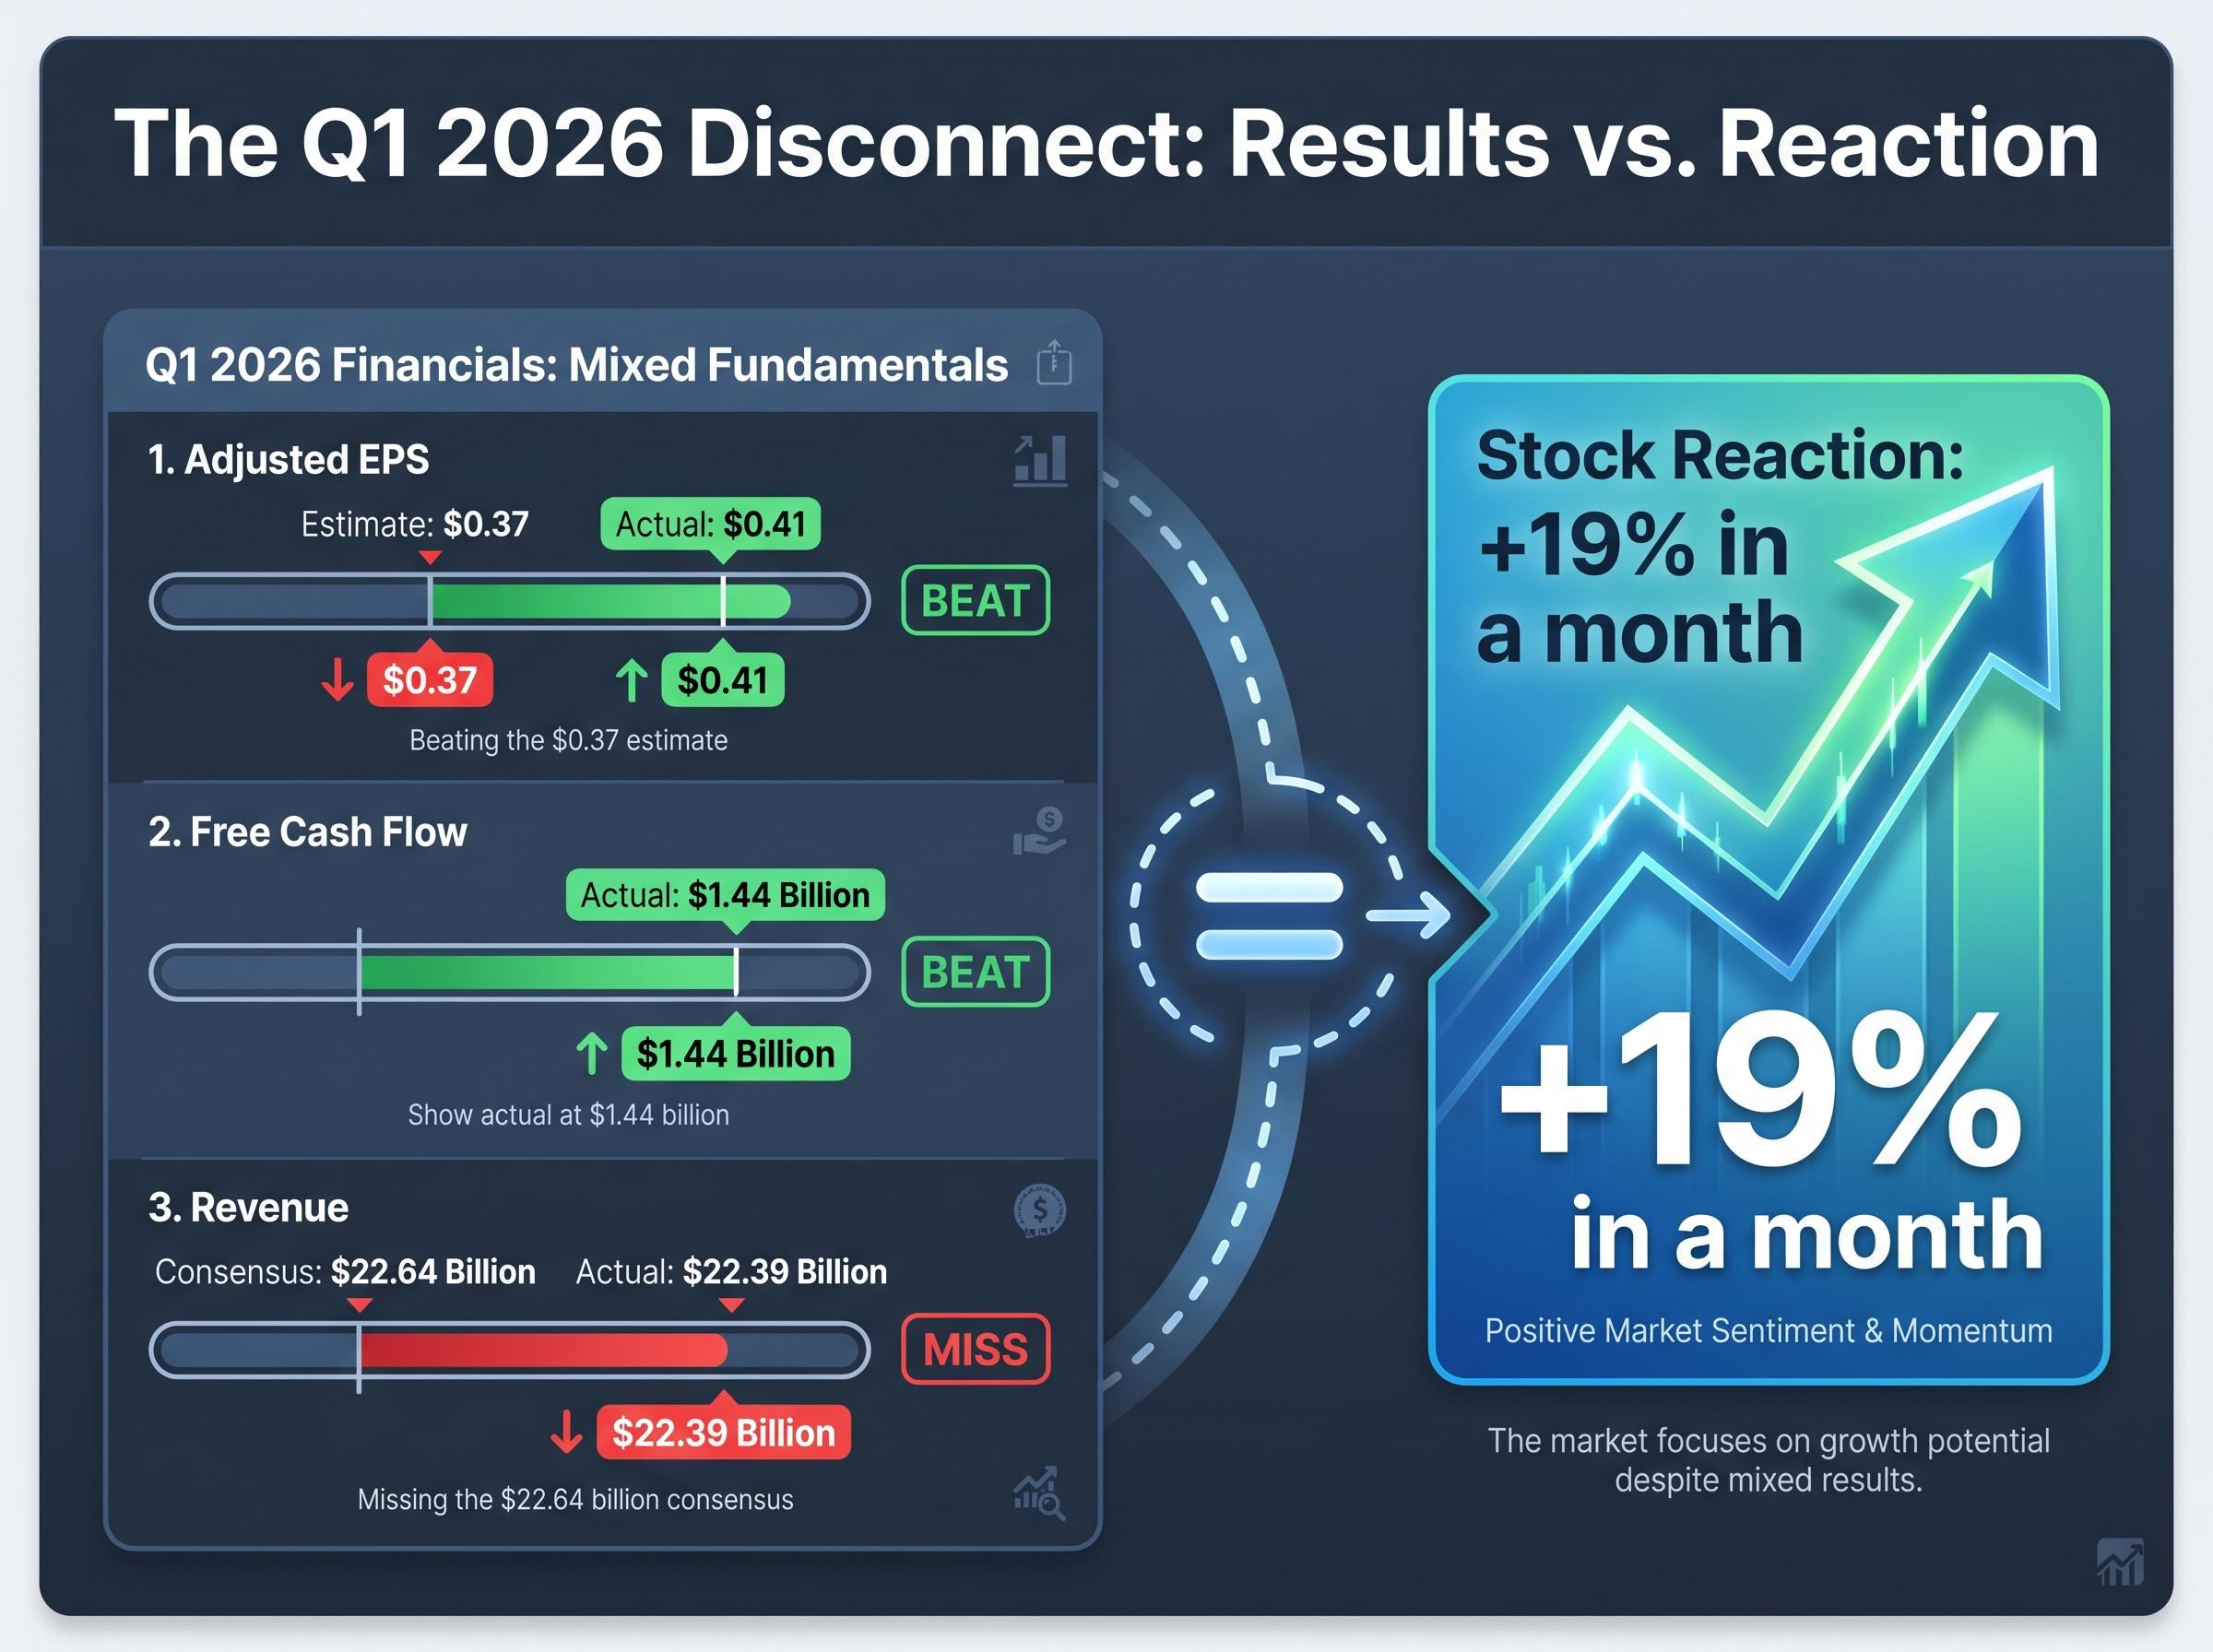
Tesla’s Q1 2026 earnings season sharpened the puzzle. The company beat on adjusted earnings per share and free cash flow but missed on revenue, yet shares climbed nearly 19% in a month. The disconnect reveals how much a valuation depends not on current results but on which future version of the company investors believe they are buying. This guide uses Tesla’s specific bull and bear case numbers as a live teaching vehicle for a skill every investor needs: how to construct scenario-based valuations, evaluate the spread between them, and determine whether an entry price provides adequate return potential under realistic assumptions.
Tesla reports quarterly earnings like an automaker. It guides investors like an AI and robotics enterprise. That dual identity is what makes any single-number valuation, whether a consensus price target or a trailing price-to-earnings ratio, structurally inadequate.
The Q1 2026 numbers illustrate the tension. Adjusted EPS came in at $0.41, beating the $0.37 estimate. Free cash flow hit $1.44 billion, another beat. Revenue of $22.39 billion missed the $22.64 billion consensus by a slim margin. Yet the stock rallied. Investors were not trading the quarter; they were trading the future the quarter hinted at.
Consider the two identities side by side:
On the Q1 2026 earnings call, Elon Musk framed Tesla explicitly as an AI and robotics enterprise rather than a car company.
CEO framing: Musk described Tesla’s future as defined by autonomous driving, robotaxi networks, and the Optimus humanoid robot, positioning the automotive business as the foundation for a much larger technology platform.
Applying a Ford or GM multiple to a company whose CEO has described one product (Optimus) as potentially the largest ever brought to market produces a number that satisfies neither bulls nor bears. That discomfort is not a flaw in the analysis. It is the analysis.
Analyst consensus price targets cluster between $398 and $413, with a Hold rating across multiple sources. The stock closed at approximately $428-$430 on 8 May 2026, meaning the market is pricing in assumptions that go beyond what consensus models capture.
Analyst price target divergence of this magnitude, spanning from $145 to $600 on a single stock, is not a sign of analytical failure; it is a direct consequence of analysts modelling genuinely different companies, with each price target reflecting a distinct probability assignment to the autonomous driving and robotics revenue thesis.
The 19% one-month gain following Q1 earnings reflected sentiment-driven repricing, not a fundamental revision large enough to justify the move on quarterly results alone. When the trading price sits above every major consensus target, the premium is the market’s bet on the transformation narrative.
Four valuation instruments are directly relevant to Tesla’s case, and understanding what each measures, and where each breaks down, is the prerequisite for building any scenario model.
Price-to-Earnings (P/E) compares a stock’s price to its earnings per share. Trailing P/E uses historical reported earnings; forward P/E uses analyst projections. Forward P/E is more predictive for growth companies but only as reliable as the estimates feeding it.
Price-to-Sales (P/S) compares market capitalisation to total revenue. It is useful when earnings are volatile or suppressed, capturing revenue-generating capacity regardless of current profitability.
Discounted Cash Flow (DCF) projects future cash flows and discounts them to present value. It is the most sensitive to input assumptions: change the revenue growth rate or discount rate by a few percentage points and the output shifts dramatically.
Reverse DCF methodology approaches the problem from a different direction: rather than projecting cash flows forward to arrive at a fair value, it starts from the current share price and asks what earnings growth rate the market is implicitly assuming, a number that can then be compared against what management has actually committed to deliver.
EV/EBITDA assesses enterprise value relative to operating earnings, enabling comparison across companies with different capital structures or tax treatments.
| Valuation Tool | What It Measures | Best Used For | Key Limitation |
|---|---|---|---|
| P/E (trailing) | Price relative to past earnings | Stable, mature businesses | Backward-looking; ignores growth trajectory |
| P/E (forward) | Price relative to projected earnings | Growth stocks with analyst coverage | Only as accurate as the estimates |
| Price-to-Sales | Market cap relative to revenue | Companies with volatile or negative earnings | Ignores profitability entirely |
| DCF | Present value of projected future cash flows | Intrinsic value estimation | Highly sensitive to growth and discount rate inputs |
| EV/EBITDA | Enterprise value relative to operating earnings | Cross-company comparison | Excludes capex, which matters for capital-intensive firms |
The methodological leap that makes valuation analysis useful for real decisions is the shift from “what is Tesla worth?” to “what is Tesla worth under each scenario?” Each input, revenue growth rate, margin assumption, exit multiple, has a plausible range. Running the model at the low, mid, and high end of each range produces the scenario spread.
For Tesla, the bull case assumes revenue growth of 20%-35% (midpoint approximately 27%), net profit margins of 20%-30%, and exit multiples of 25x-35x earnings. The bear case assumes revenue growth of 6%-12% (midpoint 9%), net margins of 8%-14%, and exit multiples of 18x-22x. Current net margins sit in the 7%-10% range, meaning even the bear case projects margin improvement from present levels.
That spread is why a single number cannot answer the question. The model can.
The bull case projects annualised returns of approximately 11%-35% over a 10-year horizon. That range is wide because the execution requirements are significant. Three conditions must be met for those numbers to materialise:
Explicit bull and bear case construction requires more than choosing optimistic and pessimistic revenue numbers; each scenario must identify the single variable most likely to determine whether the thesis holds, whether that is a Cybercab commercialisation timeline, a California autonomous vehicle permit approval, or a gross margin threshold that signals manufacturing scale.
Bull case return range: Approximately 11%-35% annualised over a 10-year horizon, contingent on all three execution requirements materialising at or near projected timelines.
Recent catalysts suggest the bull path has not closed. Cybercab production officially started 24 April 2026. Tesla confirmed robotaxi expansion to seven new cities in H1 2026, including Phoenix and Miami. Autonomous vehicle miles driven nearly doubled in Q1 2026 compared to the prior period.
The $25 billion capex guidance for 2026, raised from $20 billion, signals management’s conviction. It also creates near-term risk: that level of capital expenditure could pressure free cash flow and compress returns for shareholders who need the transformation to arrive on time.
Musk’s historical timeline pattern is a probability-adjustment factor that no bull case model should ignore. In 2016, Tesla claimed all vehicles had full self-driving hardware. In 2019, Musk projected one million robotaxis on the road by 2020. In 2021, he stated Optimus would be ready by 2022. All three timelines slipped materially.
This pattern does not disqualify the bull case. It adjusts the probability. The bull scenario may materialise later and at smaller initial scale than projected, which compresses returns for investors who paid today’s price on the assumption of on-time delivery.
The bear case is not a collapse scenario. It is the valuation that emerges if Tesla remains a strong, above-average electric vehicle company but does not generate meaningful autonomous driving or robotics revenue within the modelled horizon.
Under these assumptions, revenue grows at 6%-12% (midpoint 9%), net margins settle at 8%-14%, and the stock exits at 18x-22x earnings. Those margins would still exceed Ford and GM. This is a “great car company” scenario, not a failure scenario.
At approximately $375-$380 per share, every projected return outcome under the bear case was negative. At the current trading price of approximately $428-$430, the negative returns deepen further. The implication is direct: the current share price embeds a substantial AI and robotics premium, and if only the automotive business materialises, buyers at this level face a loss.
Regulatory headwinds add texture to this risk. The California DMV adopted new noncompliance rules for driverless vehicles on 29 April 2026, introducing an additional accountability mechanism for autonomous vehicle operators. Competitive pressure from BYD on global EV volume compounds the margin challenge.
The California DMV noncompliance rules for driverless vehicles, adopted 29 April 2026, establish a formal mechanism for law enforcement to issue notices against operators whose autonomous systems fail to meet the state’s safety standards, adding a specific accountability layer that any bear case timeline model must now incorporate.
| Assumption Category | Bear Low | Bear Mid | Bear High | Bull Mid |
|---|---|---|---|---|
| Revenue Growth Rate | 6% | 9% | 12% | 27% |
| Net Profit Margin | 8% | 11% | 14% | 25% |
| Exit P/E Multiple | 18x | 20x | 22x | 30x |
| Projected 10-Year Annualised Return | Negative | Negative | Negative | ~11%-35% |
The bear case teaches investors to ask a specific question before any purchase: “If only the current business materialises, what do I earn?” If the answer at the current price is a loss, the investor is paying entirely for optionality on an unproven future.
Identical bull and bear assumptions produce entirely different return outcomes depending on the entry price. This is not a conservative investor’s preference. It is arithmetic.
Consider the same bull case scenario run at three different entry points:
Analyst forward EPS estimates project more than 5x earnings growth from current levels, meaning the stock is pricing in significant execution. A buyer at $428 needs far more of that execution to materialise than a buyer at $100 did. Those same analyst EPS estimates declined more than 90% from their peak before recovering, illustrating the volatility of forward estimates for companies in transition.
The entry price is the one variable an investor controls. The future revenue mix, the regulatory environment, and the competitive dynamics are not. Running the same scenario at different entry prices reveals where a margin of safety begins to exist, and where it does not.
This is where scenario building becomes personally actionable. The model is not complete until the same assumptions are tested at the price being considered for purchase.
The Tesla analysis distils into a five-step methodology that applies to any company whose current price embeds a transformation premium:
This methodology is particularly relevant for evaluating AI-adjacent companies, EV competitors, biotech firms with pipeline-dependent valuations, and any business undergoing a fundamental model transition.
The analyst base case derived from this Tesla analysis reflects partial execution: autonomous driving and robotics revenue materialise, but later and at smaller scale than projected. That means the realistic return for a buyer at current prices lands somewhere between the bull and bear scenarios, a range that only becomes visible when both cases are built explicitly.
Assigning probabilities (the research source estimates 5%-10% probability for full bull case materialisation) is not about prediction accuracy. It is about forcing the investor to make assumptions explicit and testable.
An investor who assigns 50% probability to the bull case and 50% to the bear case is making a very different bet than one who assigns 10% to the bull and 90% to the bear. The expected value calculation will reflect that difference clearly, and the discipline of writing the number down is what separates conviction from hope.
Tesla’s Q1 2026 results, an EPS beat, an FCF beat, a slight revenue miss, and a capex raise to $25 billion, describe a company in genuine transition rather than confirmed arrival. That is precisely the condition under which scenario-based valuation is most useful and most necessary.
The asymmetry at current prices is stark. The upside requires a high-probability assignment to the bull case. The bear case, which models an above-average automotive company rather than a failed one, punishes investors with negative returns at the current entry price. The gap between those two outcomes is the market’s bet on transformation.
Before buying any high-multiple, transformation-stage company, build both scenarios explicitly. Run them at the current price. Ask whether the probability-weighted outcome meets a minimum return threshold. Specifically:
The discipline of building bear and bull cases explicitly is what separates investors who understood what they were buying from those who were surprised when the transformation took longer than expected.
Investors who have built both scenarios explicitly and assigned probability weights still face the ongoing task of updating those weights as new data arrives; our deep-dive into real-time thesis signals for Tesla investors covers the specific Q2 metrics, including auto gross margin excluding one-time items, FSD recurring revenue trajectory, and California DMV permit filings, that indicate which scenario is materialising.
This article is for informational purposes only and should not be considered financial advice. Investors should conduct their own research and consult with financial professionals before making investment decisions. Past performance does not guarantee future results. Financial projections are subject to market conditions and various risk factors.
—
Scenario-based stock valuation analysis builds separate financial models for optimistic and pessimistic outcomes rather than relying on a single price estimate, allowing investors to evaluate projected returns under each case and determine whether the current entry price provides adequate return potential.
For transition-stage companies, analysts recommend building a bear case that values only the existing proven business and a bull case that specifies the exact execution milestones required, then assigning probability weights to each scenario to calculate an expected return at the current share price.
Because identical bull and bear assumptions produce entirely different return outcomes depending on what you paid to enter the position; at a higher entry price, the bull case must materialise with greater probability just to break even, while the bear case produces deeper losses.
Tesla beat on adjusted EPS and free cash flow but missed on revenue, yet shares climbed nearly 19% in a month, indicating the market is pricing the company's future autonomous driving and robotics potential rather than its current automotive results.
A reverse DCF starts from the current share price and works backward to determine what earnings growth rate the market is implicitly assuming, which investors can then compare against what management has actually committed to deliver to judge whether expectations are realistic.


