What Tesla’s $25-$4,600 Gap Teaches About Stock Valuation
6 mins ago

At Tesla’s current price of approximately $425 per share, Wall Street analysts have set price targets ranging from under $200 to $1,771, a spread so wide it functions less as a consensus than as a confession that nobody agrees on what this company actually is. That disagreement is not a flaw in the analysis. It is the analysis. When a company is mid-transition from one business model to another, conventional valuation tools stop producing clear answers and start producing inputs to a much harder question: which version of this company is the market paying for?
This guide uses Tesla’s Q1 2026 valuation as a working case study to teach a broadly applicable investment skill: how to construct bull and bear case scenarios, stress-test the assumptions that drive them apart, and use entry price as the primary variable an investor can actually control. The methodology applies to any transition-stage company, not just Tesla. Readers will finish with a reusable framework for evaluating businesses whose current price embeds a future that has not yet materialised.
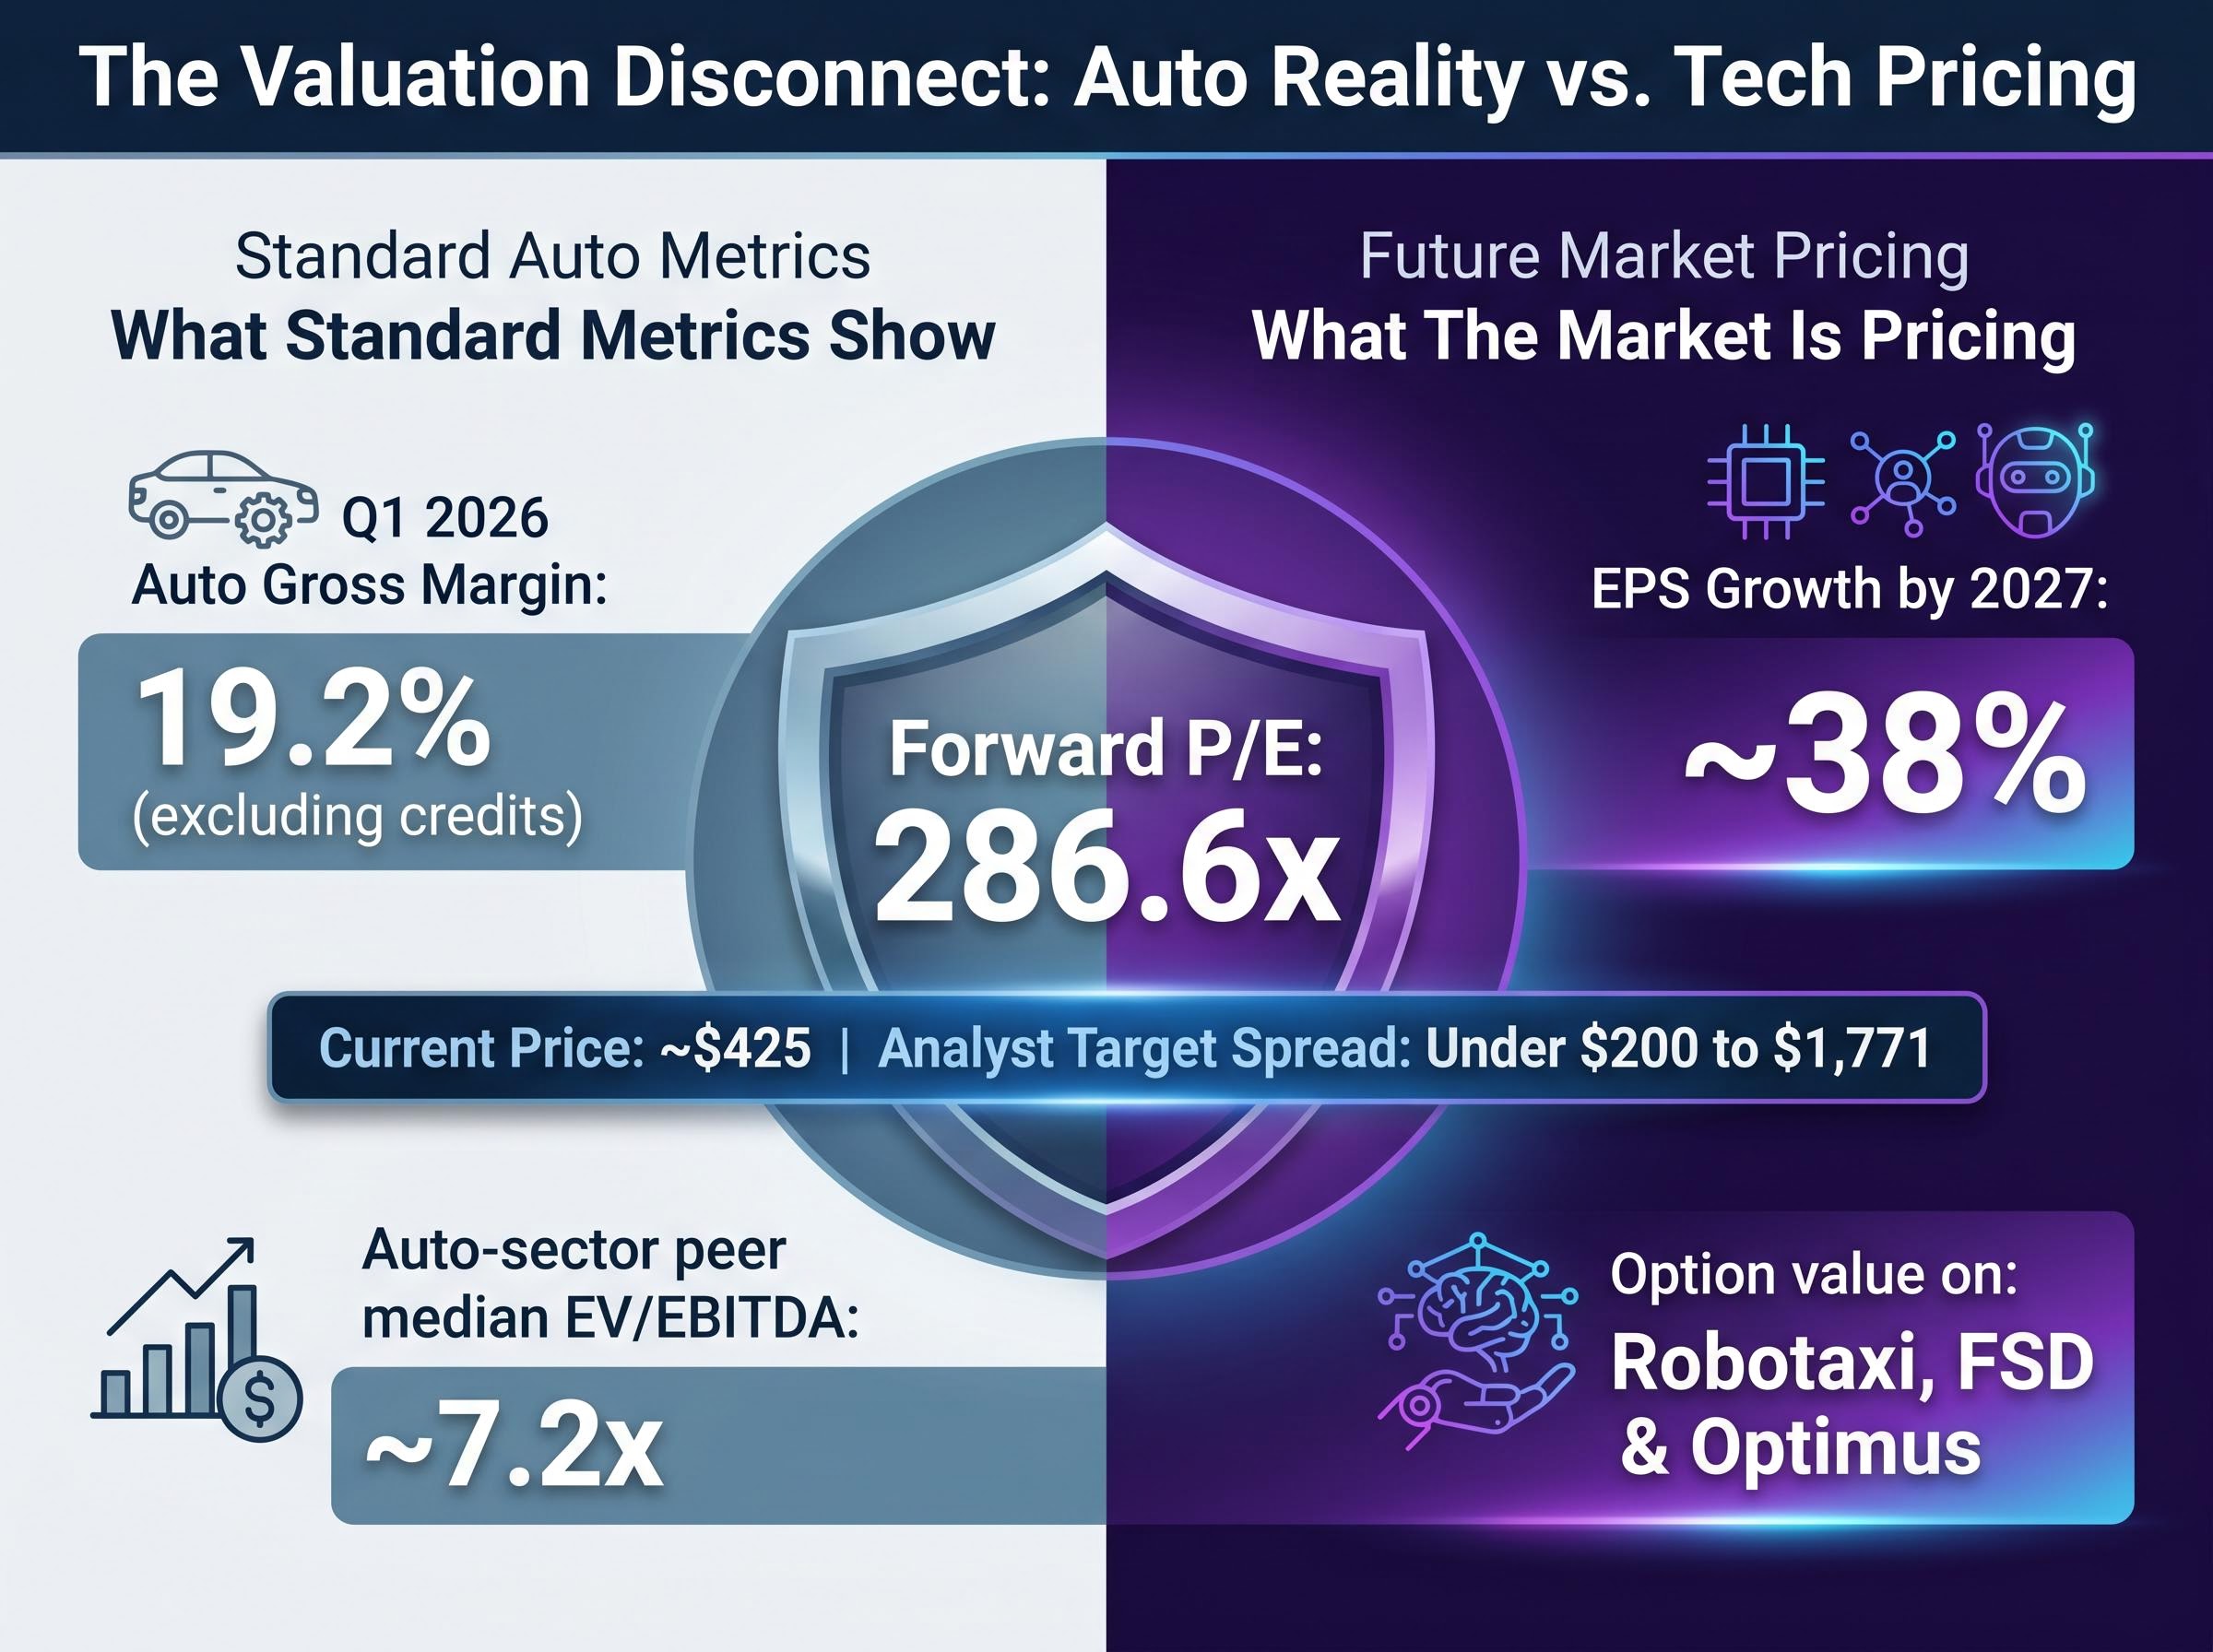
A forward price-to-earnings ratio of approximately 286.6x tells an investor that Tesla is expensive. It does not tell them why, or whether “expensive” even means what it normally means.
Standard single-metric valuation works when a company’s current financials reasonably represent its future earnings power. For a transition-stage company, they do not. Current revenue reflects the old business, vehicle sales with an auto gross margin (excluding credits) of approximately 19.2% in Q1 2026, while the market price reflects a potential future business in autonomy, robotics, and artificial intelligence. The gap between those two realities is where conventional metrics break down.
Consider what the numbers show versus what the market is actually pricing:
The P/E ratio captures both realities in a single number, which is precisely why it fails as a diagnostic tool here. It is technically correct and analytically useless.
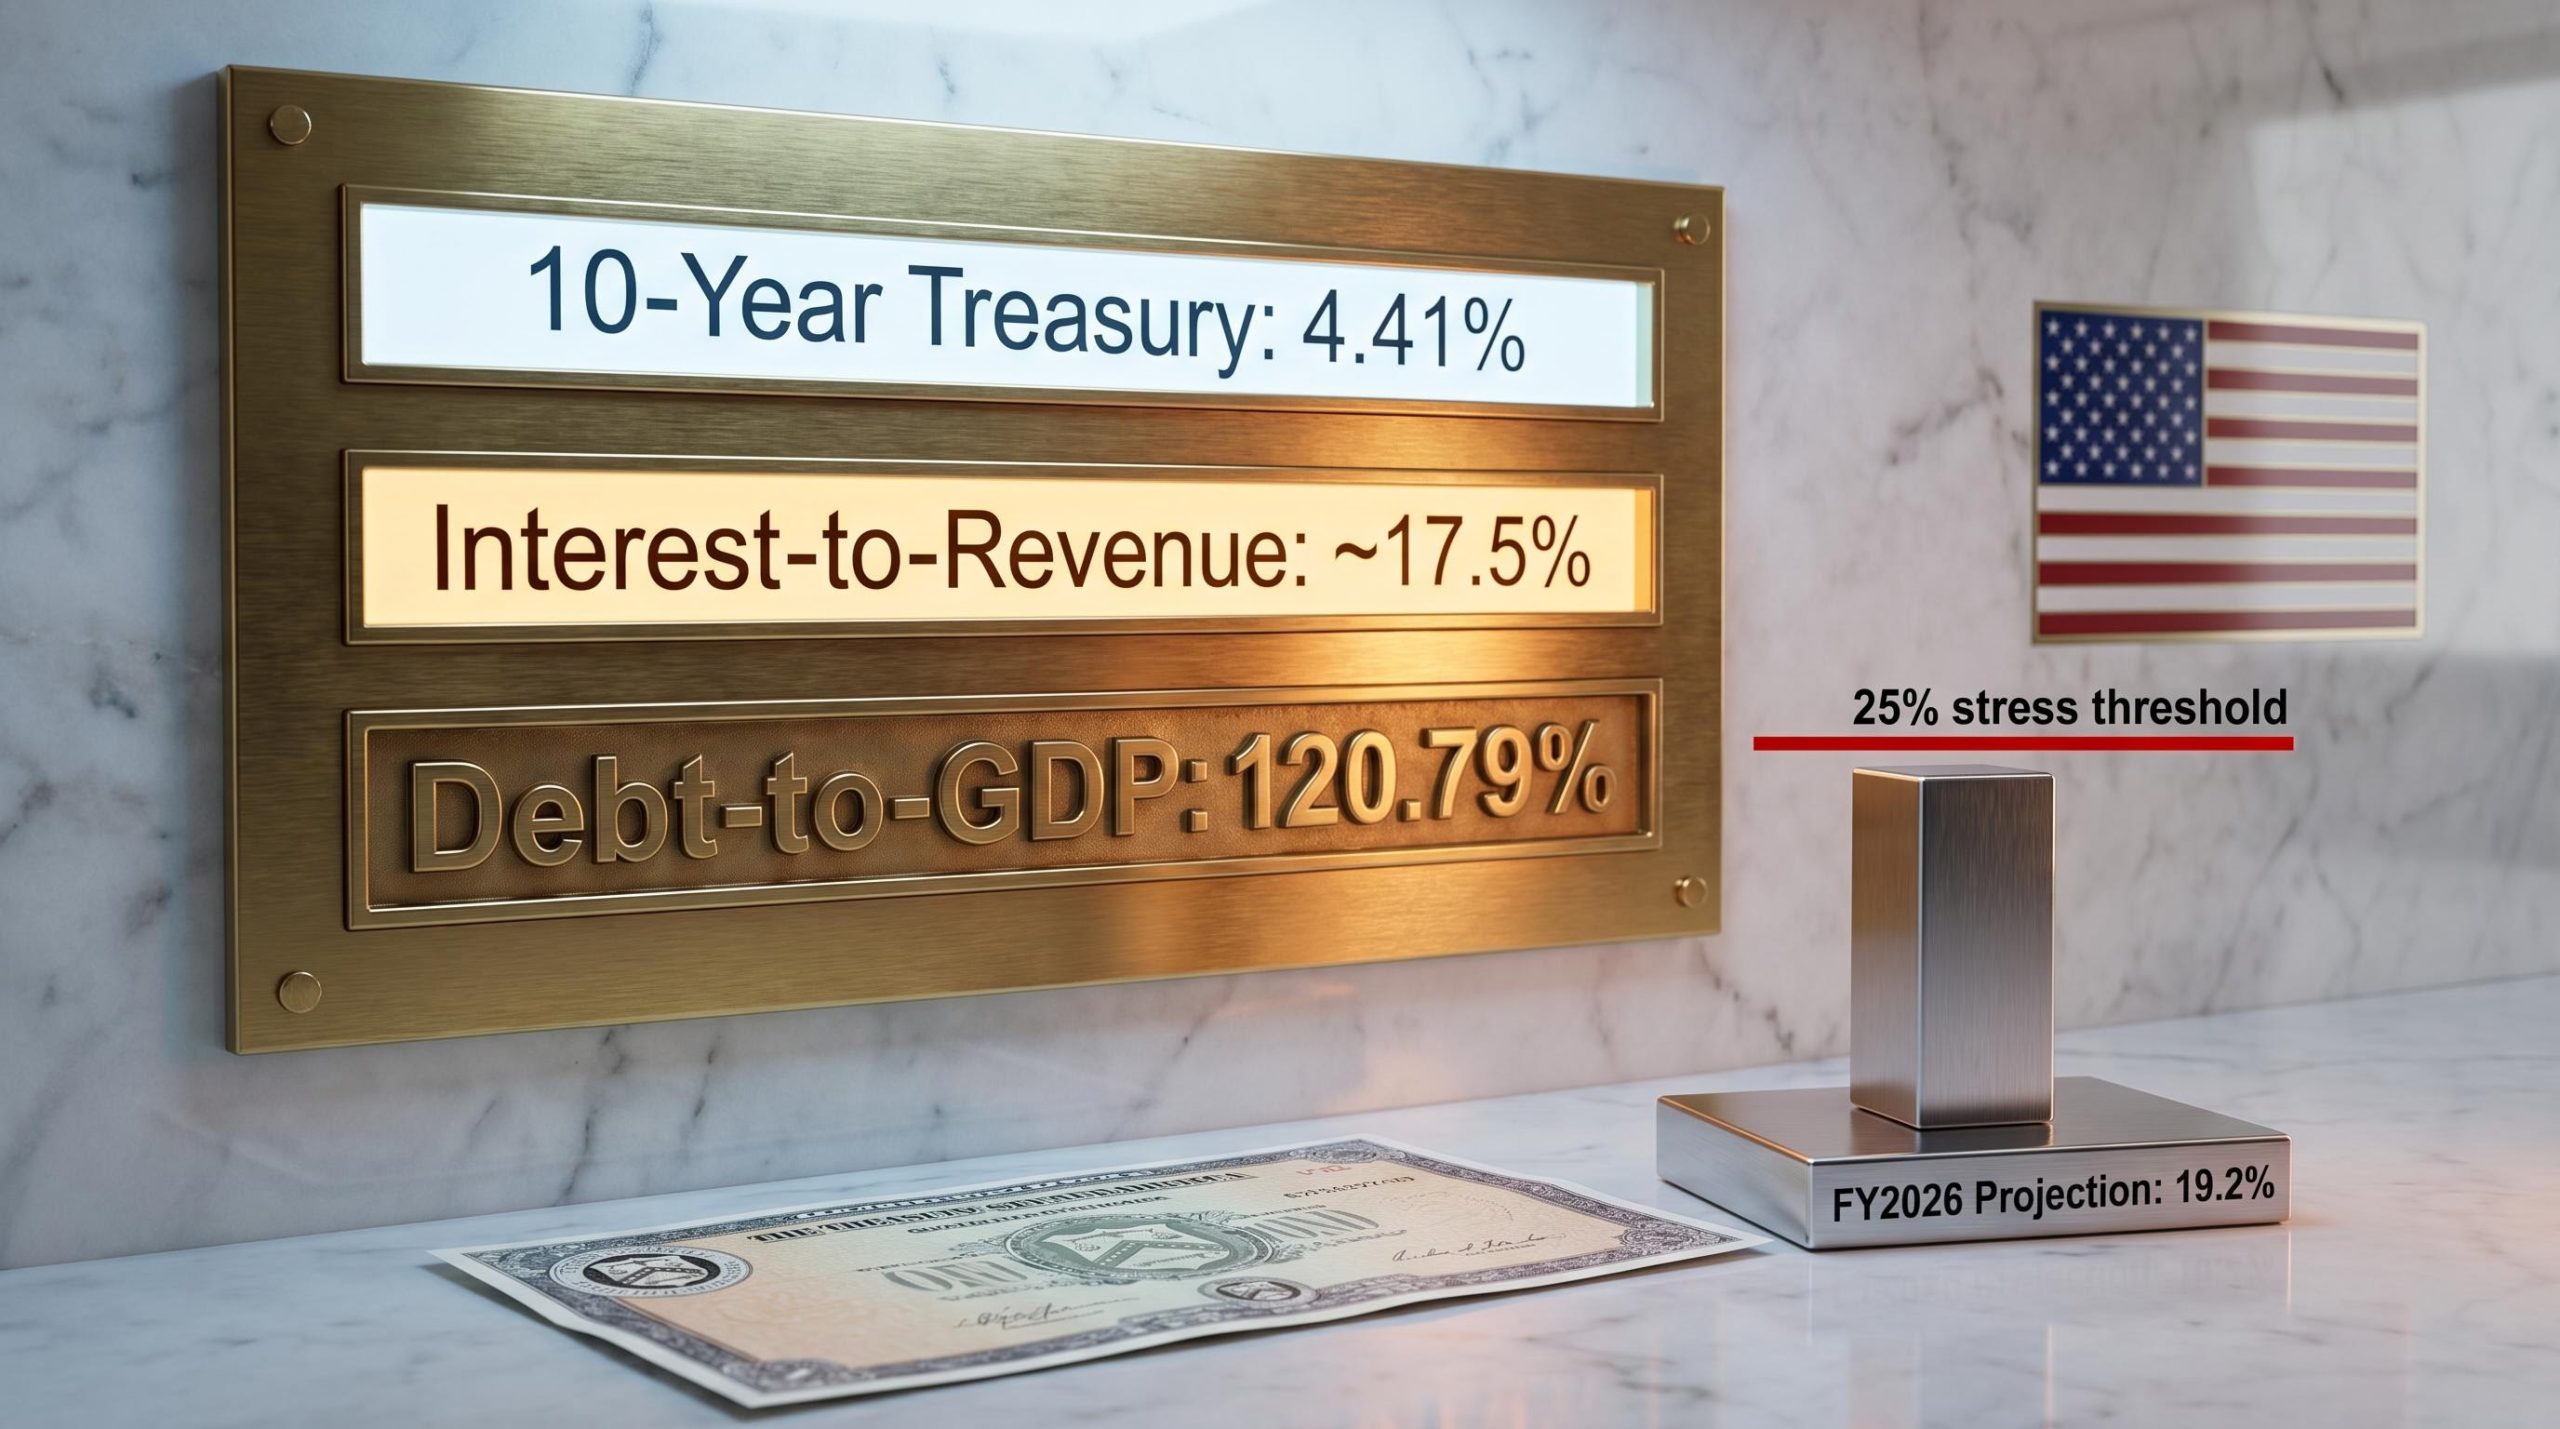
Elevated AI and tech multiples across the broader market provide the backdrop against which Tesla’s 286.6x forward P/E should be read: the S&P 500 Shiller CAPE ratio reached 40-41 in May 2026, the second-highest reading in 155 years of market data, meaning the valuation premium Tesla carries is partly company-specific and partly a feature of the entire technology investment landscape.
Analysts address this by separating the valuation into distinct business segments, each assigned a multiple appropriate to its own growth and margin profile. This approach is known as sum-of-the-parts (SOTP) valuation.
Morgan Stanley’s framework provides a named example. Core automotive plus energy revenue is valued at approximately 7.2x next-twelve-months EV/EBITDA, in line with auto-sector peers. Autonomy and robotics, including Robotaxi, FSD licensing, and Optimus, are treated as contingent value segments: optionality that may or may not convert into earnings. In the bull scenario, these segments represent the majority of enterprise value. In the bear scenario, they represent very little.
That separation is the structural solution. Without it, an investor applying a standard P/E screen to Tesla will reach a confident conclusion that is almost certainly wrong in one direction or the other.
Scenario analysis is not optimism versus pessimism. It is the practice of constructing internally consistent sets of assumptions, covering growth rate, margin trajectory, and valuation multiple, and then asking which version of the company each set describes.
For transition-stage companies, the bull and bear cases typically diverge not on near-term revenue but on whether the new business line generates meaningful revenue at all within the projection window. Both scenarios may agree that Tesla sells more cars next year. They disagree on whether Robotaxi is a real business by 2030.
The following table summarises the core assumptions driving each scenario:
| Assumption | Bull Case | Bear Case | Why It Diverges |
|---|---|---|---|
| Revenue CAGR | 20-35% (midpoint ~27%) | 6-12% (midpoint ~9%) | AI/autonomy revenue materialises vs. auto-only growth |
| Net Profit Margin | 20-30% | 8-14% | Software margins vs. manufacturing margins |
| Valuation Multiple | 25-35x earnings | 18-22x earnings | Tech/AI multiple vs. auto-sector multiple |
| Implied 10-Year Return | ~11-35% annualised | Negative at ~$375/share | Entry price determines breakeven scenario |
| Probability Weight | ~5-10% full materialisation | ~30% | Bull requires multiple contingencies to resolve favourably |
Probability weighting converts these parallel scenarios into a single expected-value estimate. A common framework assigns 40% to a base case, 30% to the bull case, and 30% to the bear case, then sums the weighted outcomes to produce an expected intrinsic value.
The bull case carries an estimated 5-10% probability of full materialisation. A $1,771 price target is not a prediction. It is a low-probability scenario output. Interpreting it as a forecast is one of the most common errors retail investors make with analyst price targets.
Most investors treat optimistic targets as forecasts rather than scenario outputs. Understanding the probability architecture behind them changes how every number in this analysis should be read.
Probability calibration in scenario models is the most consequential and most overlooked step in the entire framework: shifting a Robotaxi scenario from a 30% probability weight to a 10% weight moves the blended fair value estimate by far more than adjusting the revenue growth assumption within that scenario, meaning investors who spend their analysis time on growth rate precision and skip the probability question are optimising the wrong variable.
Scenarios describe different futures. Entry price determines which future an investor needs to be correct about.
This is the single variable in a valuation model that the investor controls entirely. Every other input, revenue growth, margin trajectory, competitive dynamics, regulatory timelines, is a projection. The price paid is a fact. And it determines the entire return profile under every scenario simultaneously.
Tesla shares were available at approximately $100 per share a few years prior to their current range of approximately $375-$425, with a peak near $450. Under identical future scenarios, the return profile at each entry point is radically different. At $100, even the bear case might have delivered acceptable returns. At $375, the research shows that every projected return outcome was negative, meaning the current price requires something close to the bull scenario simply to avoid a loss.
The asymmetric risk principle provides a discipline for this problem:
Morgan Stanley’s bull case of $860 implies a 50% entry threshold of $430 and a 70% threshold of $602. At approximately $425, Tesla sits at the very edge of the minimum margin-of-safety zone.
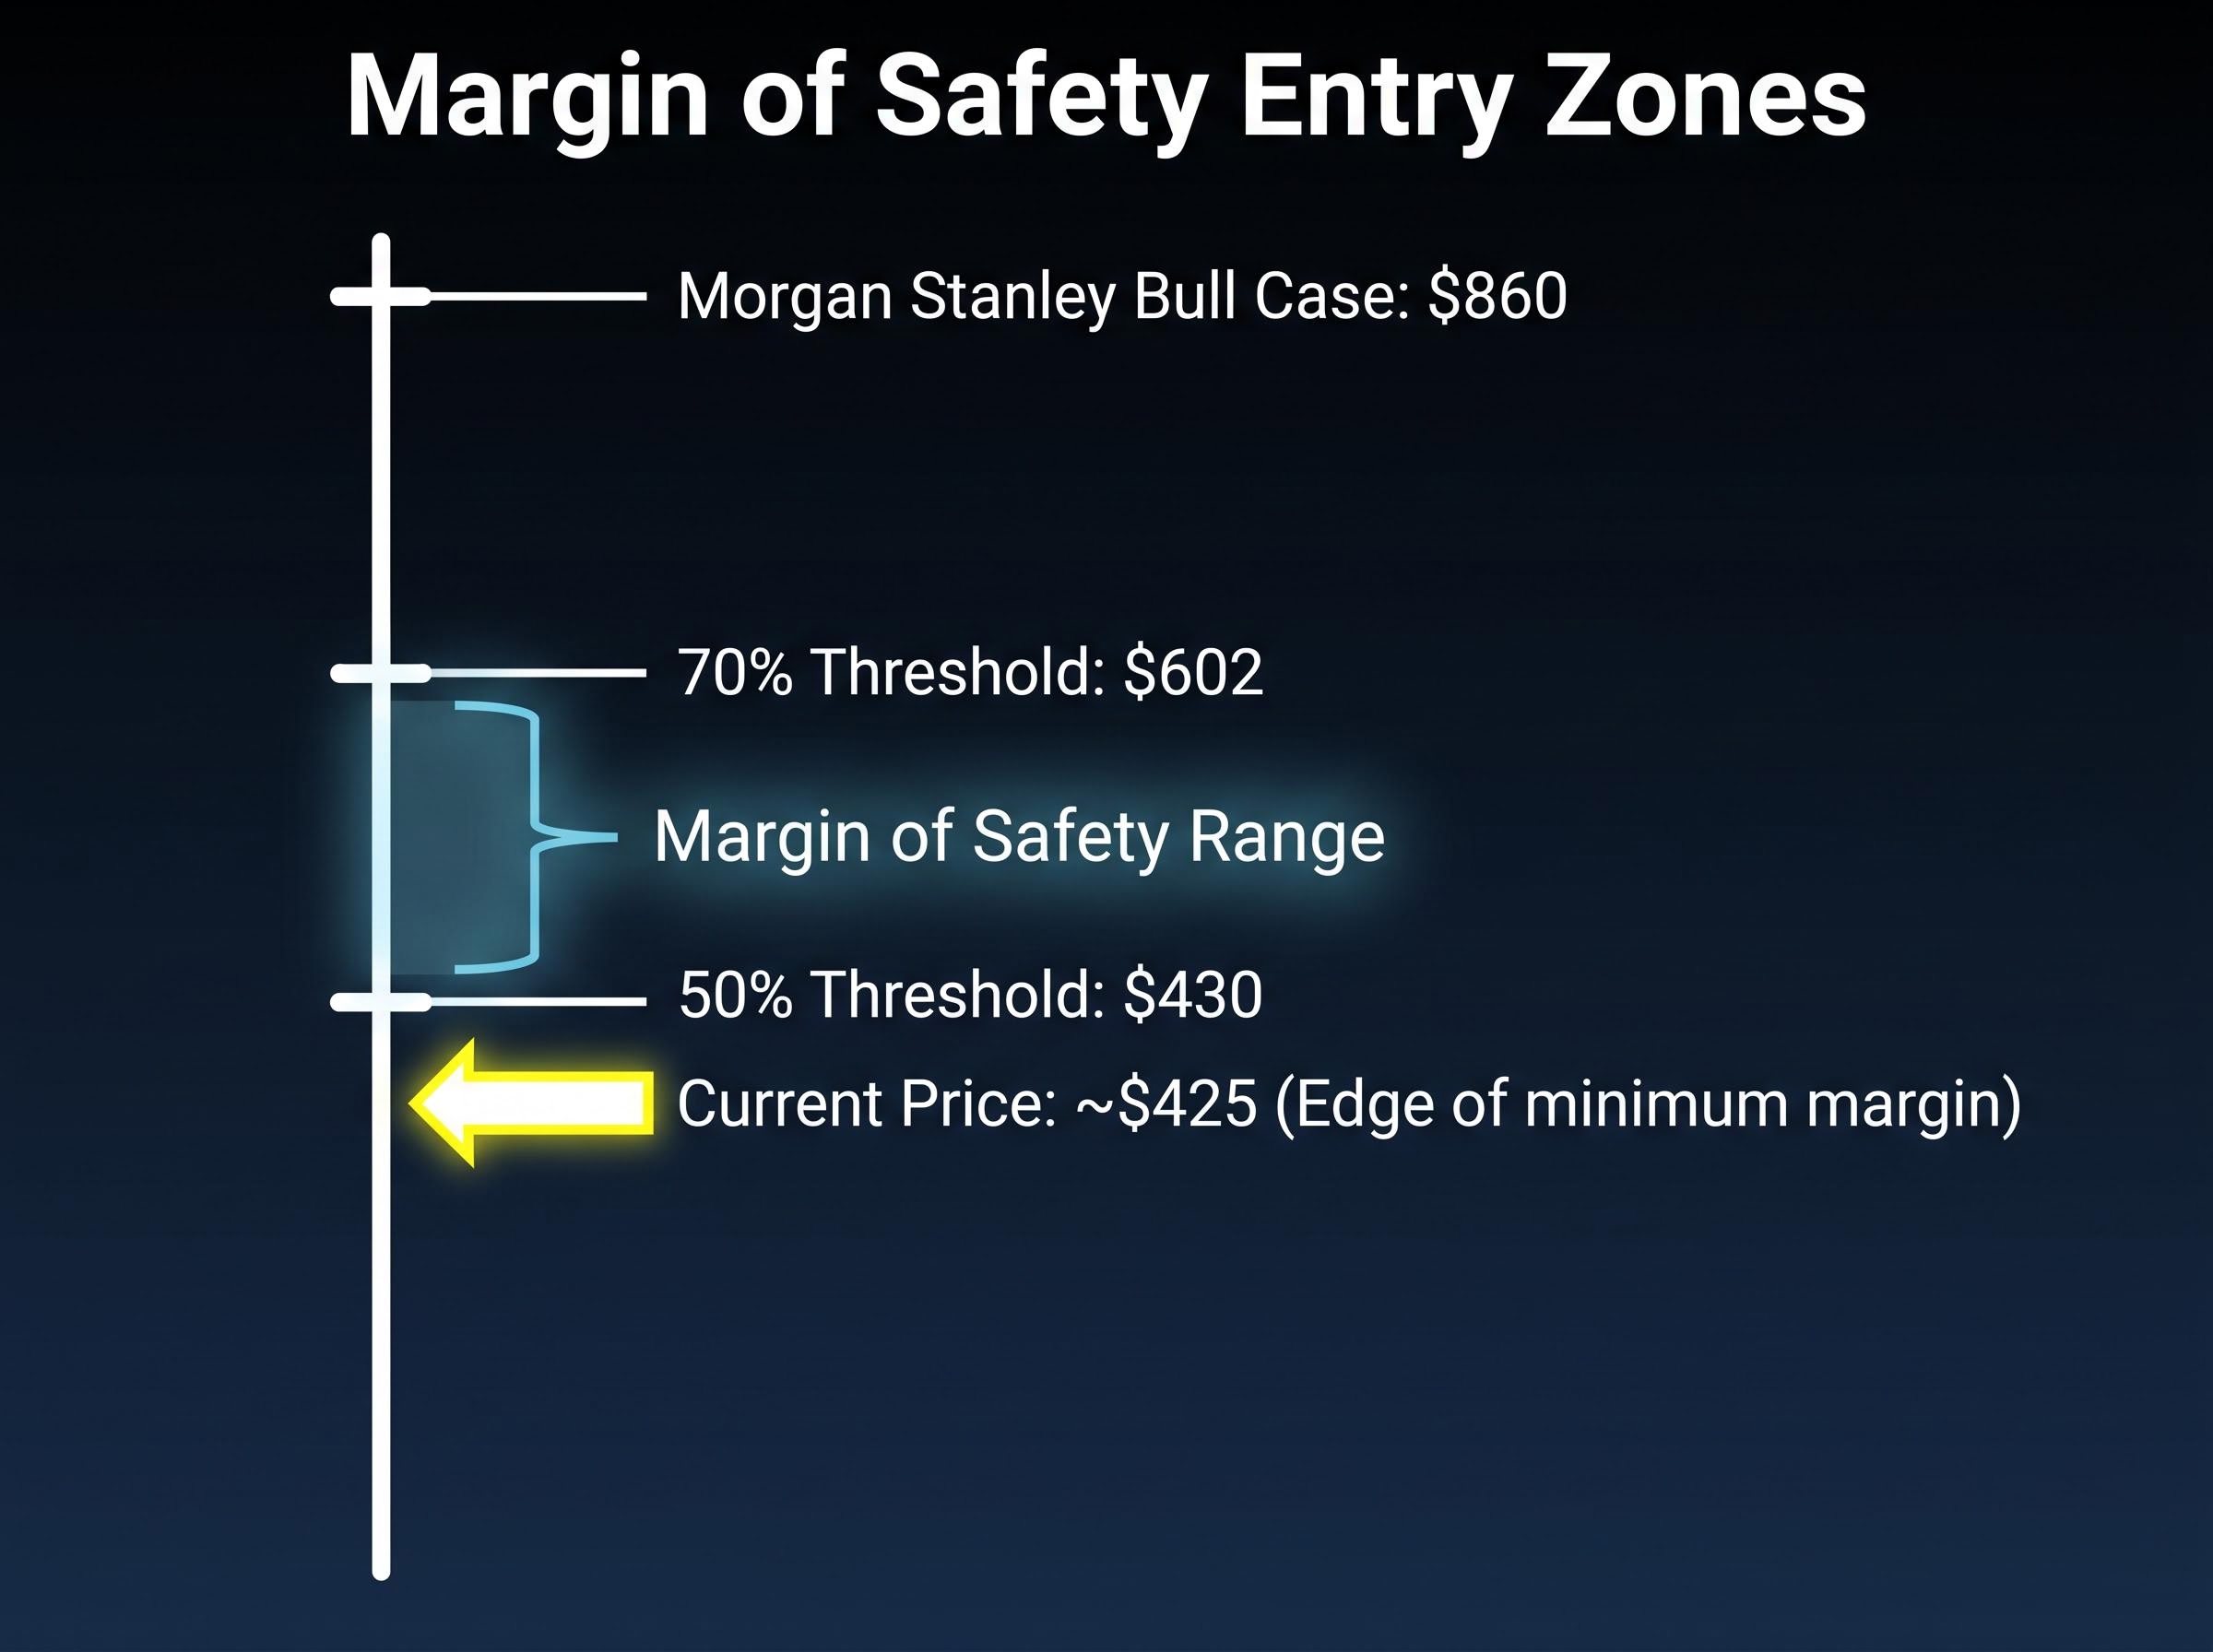
This arithmetic does not tell investors whether to buy or sell. It tells them exactly which scenario has to materialise for the investment to work from here. At current levels, the answer is that something very close to the bull case, or at least a strong base case, is required simply to generate a positive return. The risk-reward, by this measure, reads as roughly neutral.
Scenario models produce clean outputs. The real world introduces friction that most reliably destroys bull cases through four recurring mechanisms. Each one maps directly to an assumption in the scenario framework, which is precisely why it belongs in the model.
| Risk Variable | Mechanism | Tesla Example | Comparable Case |
|---|---|---|---|
| Regulatory Delay | Permits and approvals gate revenue timelines; each quarter of delay compounds the discount on future cash flows | No commercial AV permits filed in California as of the reporting period; Austin, Dallas, and Houston limited rollouts underway but full launch pending NHTSA review | NVIDIA: P/E compressed to a seven-year low following US China chip export controls in 2025 |
| Execution Risk on Capital-Intensive Programmes | High CapEx burns cash before revenue arrives; if revenue scales slower than modelled, FCF stays negative longer | Projected $25B CapEx for 2026; approximately -$8.5B FCF under bear assumptions | Snowflake: approximately 50% stock decline when growth decelerated and margins compressed simultaneously |
| Multiple Compression | Growth deceleration triggers both lower earnings and a lower multiple applied to those earnings, producing amplified downside | Forward P/E of 286.6x requires sustained growth acceleration; any deceleration compresses both components | Snowflake: peak revenue multiple contracted sharply on growth slowdown |
| Management Timeline Slippage | Repeated timeline misses erode the credibility of forward projections that underpin the bull case | Three documented instances: 2016 full-autonomy hardware claim, 2019 one-million-robotaxi projection, 2021 Optimus deployment target | UiPath: enterprise automation adoption curves proved slower than bulls modelled |
These four variables appear repeatedly across transition-stage companies, from NVIDIA to Palantir to Snowflake to UiPath. Investors who can identify them early gain a systematic advantage in stress-testing the bull case before committing capital. Each variable is observable and trackable; none requires inside information to monitor.
Execution risk benchmarks drawn from direct competitors sharpen the assessment considerably: Waymo completed approximately 2 million paid rides by March 2026 without a commercial robotaxi permit filing from Tesla in any major US market during the same period, a comparison that moves execution risk from an abstract model assumption to a concrete, observable competitive gap.
When a company’s value depends on a future that may or may not exist, a single discounted cash flow (DCF) model produces false precision. Analysts address this by layering multiple tools, each one correcting a limitation of the one before it.
A sensitivity table converts the model’s two most uncertain inputs, typically growth rate and margin, into a visible grid of outcomes. Instead of a single number that implies false confidence, the investor sees the full range of values produced across plausible assumption pairs.
For Tesla, a sensitivity table across revenue compound annual growth rate (CAGR) of 6% to 35% and net margin of 8% to 30% produces a range from deeply negative returns to approximately 35% annualised. That range is itself the most honest summary of the investment case. It does not resolve the uncertainty; it makes the uncertainty legible.
The spread between Tesla’s lowest and highest analyst targets is not noise. It is the signal. When a company is in transition, stock valuation analysis does not produce an answer. It produces a map of the conditions under which each outcome is possible. The investor’s job is to decide whether those conditions are probable enough at the price being asked.
Analyst price target gaps of this magnitude are not evidence of analytical failure; they reflect the fact that each analyst is modelling a structurally different company, with each target internally consistent under its own assumptions even when those assumptions sit hundreds of dollars apart.
The methodology covered in this guide, scenario construction, probability weighting, entry price discipline, risk variable identification, applies to any company whose current price embeds a future that has not yet materialised. It works for Tesla today and will work for the next transition-stage company that divides Wall Street.
Before buying any such company, an investor should be able to identify the specific developments that must occur within the projection window for the bull case to materialise. For Tesla, those conditions are:
McKinsey’s autonomous-driving commercialisation outlook, based on a 2026 survey of industry leaders, projects large-scale global robotaxi rollout by 2030, identifying L4 robo-taxis already operating commercially in select US and Chinese cities as the leading edge of that transition, a timeline that aligns with the upper bound of the bull case projection window in Tesla’s scenario framework.
Forward analyst EPS estimates project more than 5x growth from current Tesla levels. That projection almost certainly incorporates AI and autonomy contributions, meaning it is itself a bull-case-adjacent estimate rather than a conservative baseline.
Aswath Damodaran’s narrative-multiple framework highlights a further layer of assumption risk: auto peers trade at approximately 7x EV/EBITDA while AI and software peers trade at 50x-plus. For transition companies, the appropriate multiple is a blend that must shift over time as revenue mix evolves. Stress-testing the multiple is as important as stress-testing the growth rate, because the multiple itself is an assumption, not a given.
That three-condition checklist is a template. Adapt it to any transition-stage company by replacing the specific milestones with the ones that company’s bull case requires, then ask honestly whether those milestones are plausible at the current entry price. The valuation spread does not tell an investor what will happen. It tells them what they are betting on.
This article is for informational purposes only and should not be considered financial advice. Investors should conduct their own research and consult with financial professionals before making investment decisions. Past performance does not guarantee future results. Financial projections are subject to market conditions and various risk factors.
Sum-of-the-parts (SOTP) valuation separates a company into distinct business segments, each assigned a multiple appropriate to its own growth and margin profile, because applying a single metric to a company mid-transition between two business models produces results that are technically correct but analytically misleading.
The price paid for a stock determines the entire return profile under every scenario simultaneously; at Tesla's approximate price of $375-$425, research shows that nearly every projected return outcome is negative unless something close to the bull case materialises, meaning entry price is the one variable in a valuation model that an investor fully controls.
Probability weighting assigns a likelihood to each scenario, for example 40% to a base case, 30% to a bull case, and 30% to a bear case, then sums the weighted outcomes to produce a single expected intrinsic value rather than treating any one scenario as the definitive forecast.
The four recurring mechanisms are regulatory delay, execution risk on capital-intensive programmes, multiple compression triggered by growth deceleration, and management timeline slippage; each maps directly to an assumption in the scenario framework and is observable without inside information.
A sensitivity table converts the model's two most uncertain inputs, typically revenue growth rate and net profit margin, into a grid of outcomes across plausible assumption pairs, replacing a single misleading number with the full visible range of values the model produces.