How to Value Stocks When the Future Looks Nothing Like Today
26 mins ago

At the same price and with the same financials in front of them, one analyst sees Tesla as a generational buying opportunity while another sees a stock that cannot justify its valuation under any realistic scenario. Both are using the same numbers. The difference is which future they think is more likely. Tesla’s Q1 2026 earnings release on 22 April 2026 crystallised a challenge every serious investor faces: how to value a company whose stock price is not pricing the business it has today, but the business it might become. With revenue of $22.4 billion (up 16% year over year), adjusted EPS of $0.41, and gross margin of 19.2%, the core automotive results were solid. Yet the stock was trading near $400 per share, a level that only makes sense if autonomous vehicles, humanoid robots, and software-like margins all materialise on schedule. That gap between current fundamentals and priced-in future is exactly where stock valuation analysis becomes both indispensable and genuinely difficult. This guide uses Tesla’s bull and bear case frameworks as a live classroom. By the end, readers will understand how to build scenario-based valuations, why entry price is one of the most consequential variables in any investment, and how to assess what a stock’s current price is actually betting on.
Standard valuation tools work well for companies with predictable earnings. Price-to-earnings (P/E) ratios benchmark Apple at roughly 30x earnings, reflecting stable cash flows and buyback-driven EPS growth. Price-to-book value captures Berkshire Hathaway at approximately 1.5x to 1.6x book, a sensible anchor for an asset-heavy conglomerate. These methods were designed for businesses whose next five years will look broadly similar to their last five.
Tesla breaks that assumption. In bull-case analyst scenarios, the implied P/E runs from 80x to 188x, ranges that would flag any mature company as absurdly overpriced.
The S&P 500’s long-run average P/E sits at approximately 25x. Tesla’s bull-scenario exit multiples of 80x to 188x represent a 3x to 7x premium over that baseline, a gap that reflects not current earnings power but a bet on businesses that do not yet generate revenue.
For a company like Tesla, the majority of projected value comes from robotaxis, humanoid robots, and software-margin autonomy products, none of which contributed meaningful revenue in Q1 2026. When a stock price embeds a future business that does not yet exist, the investor’s real task shifts. It is no longer about benchmarking current earnings against sector peers. It is about evaluating the probability and value of that future.
| Company | Primary Valuation Method | Typical Multiple | What It Captures |
|---|---|---|---|
| Tesla (bull scenario) | Scenario DCF / Monte Carlo | 80x to 188x P/E | Optionality on autonomy, robotics, and software margins |
| Apple | P/E on stable earnings | ~30x P/E | Predictable cash flows and buyback-driven EPS growth |
| Berkshire Hathaway | Price-to-book value | ~1.5x to 1.6x book | Intrinsic asset worth of a diversified conglomerate |
Understanding where standard tools fail is the prerequisite for applying better ones. Investors who skip this step tend to either dismiss high-multiple stocks outright or accept elevated prices uncritically. Both errors carry real portfolio costs.
Before applying any numbers to Tesla specifically, it helps to understand the three inputs that drive any scenario-based valuation:
These three inputs are the analysis. Two analysts looking at the same company will reach wildly different valuations if their revenue growth or margin assumptions differ by even a few percentage points compounded over a decade. The methodology matters far less than the assumptions fed into it.
Scenario-based stock valuation assigns explicit probabilities to each outcome range rather than treating any single target price as a destination, and the mechanics of that probability-weighting step are what separate a genuine analytical framework from a narrative dressed in numbers.
Damodaran’s DCF framework for high-growth firms distinguishes between two-stage and three-stage models based on how long a company can sustain above-market growth rates, a distinction that directly shapes which discount rate and terminal multiple assumptions are appropriate for a company like Tesla.
A discounted cash flow (DCF) analysis works backward from the future. It projects what a business will earn over a defined horizon, applies a discount rate that reflects the risk of those projections not materialising, and calculates what those future earnings are worth in today’s dollars.
TIKR Terminal’s 3-year DCF framework for Tesla applies 15.4% revenue growth, 13.4% operating margins, and a 188.7x exit multiple, yielding a 38% annualised internal rate of return (IRR) from a $390.82 entry price. The discount rate is where risk enters the model explicitly: higher uncertainty about future cash flows means a higher discount rate, which lowers the present value of those projected earnings.
Rather than producing a single target price, a Monte Carlo simulation runs thousands of scenarios with varied assumptions and maps the probability distribution of outcomes. The result is a range, not a point estimate.
ARK Invest applies this approach to Tesla, generating three reference points: a bear case of $2,900, a base case of $4,600, and a bull case of $5,800 per share. ARK’s model is open-source on GitHub, allowing investors to adjust individual assumptions (robotaxi adoption rate, margin trajectory, EV market share) and observe how changes cascade through the valuation. For investors building their own scenario frameworks, this public model serves as both a reference and a stress-testing tool.
The bull case for Tesla is not simply optimism about the company’s prospects. It is a specific set of conditions that must hold simultaneously for the projected valuations to materialise.
The assumptions embedded in the most aggressive scenarios include:
Each of those margin assumptions maps to a specific business transformation. Full Self-Driving (FSD) and robotaxi must generate software-like economics at commercial scale. Optimus, Tesla’s humanoid robot programme, must reach meaningful commercial revenue by 2027. The core EV business must hold margins while competitors, including BYD (which surpassed Tesla as the world’s largest EV producer by volume), continue pressing on price.
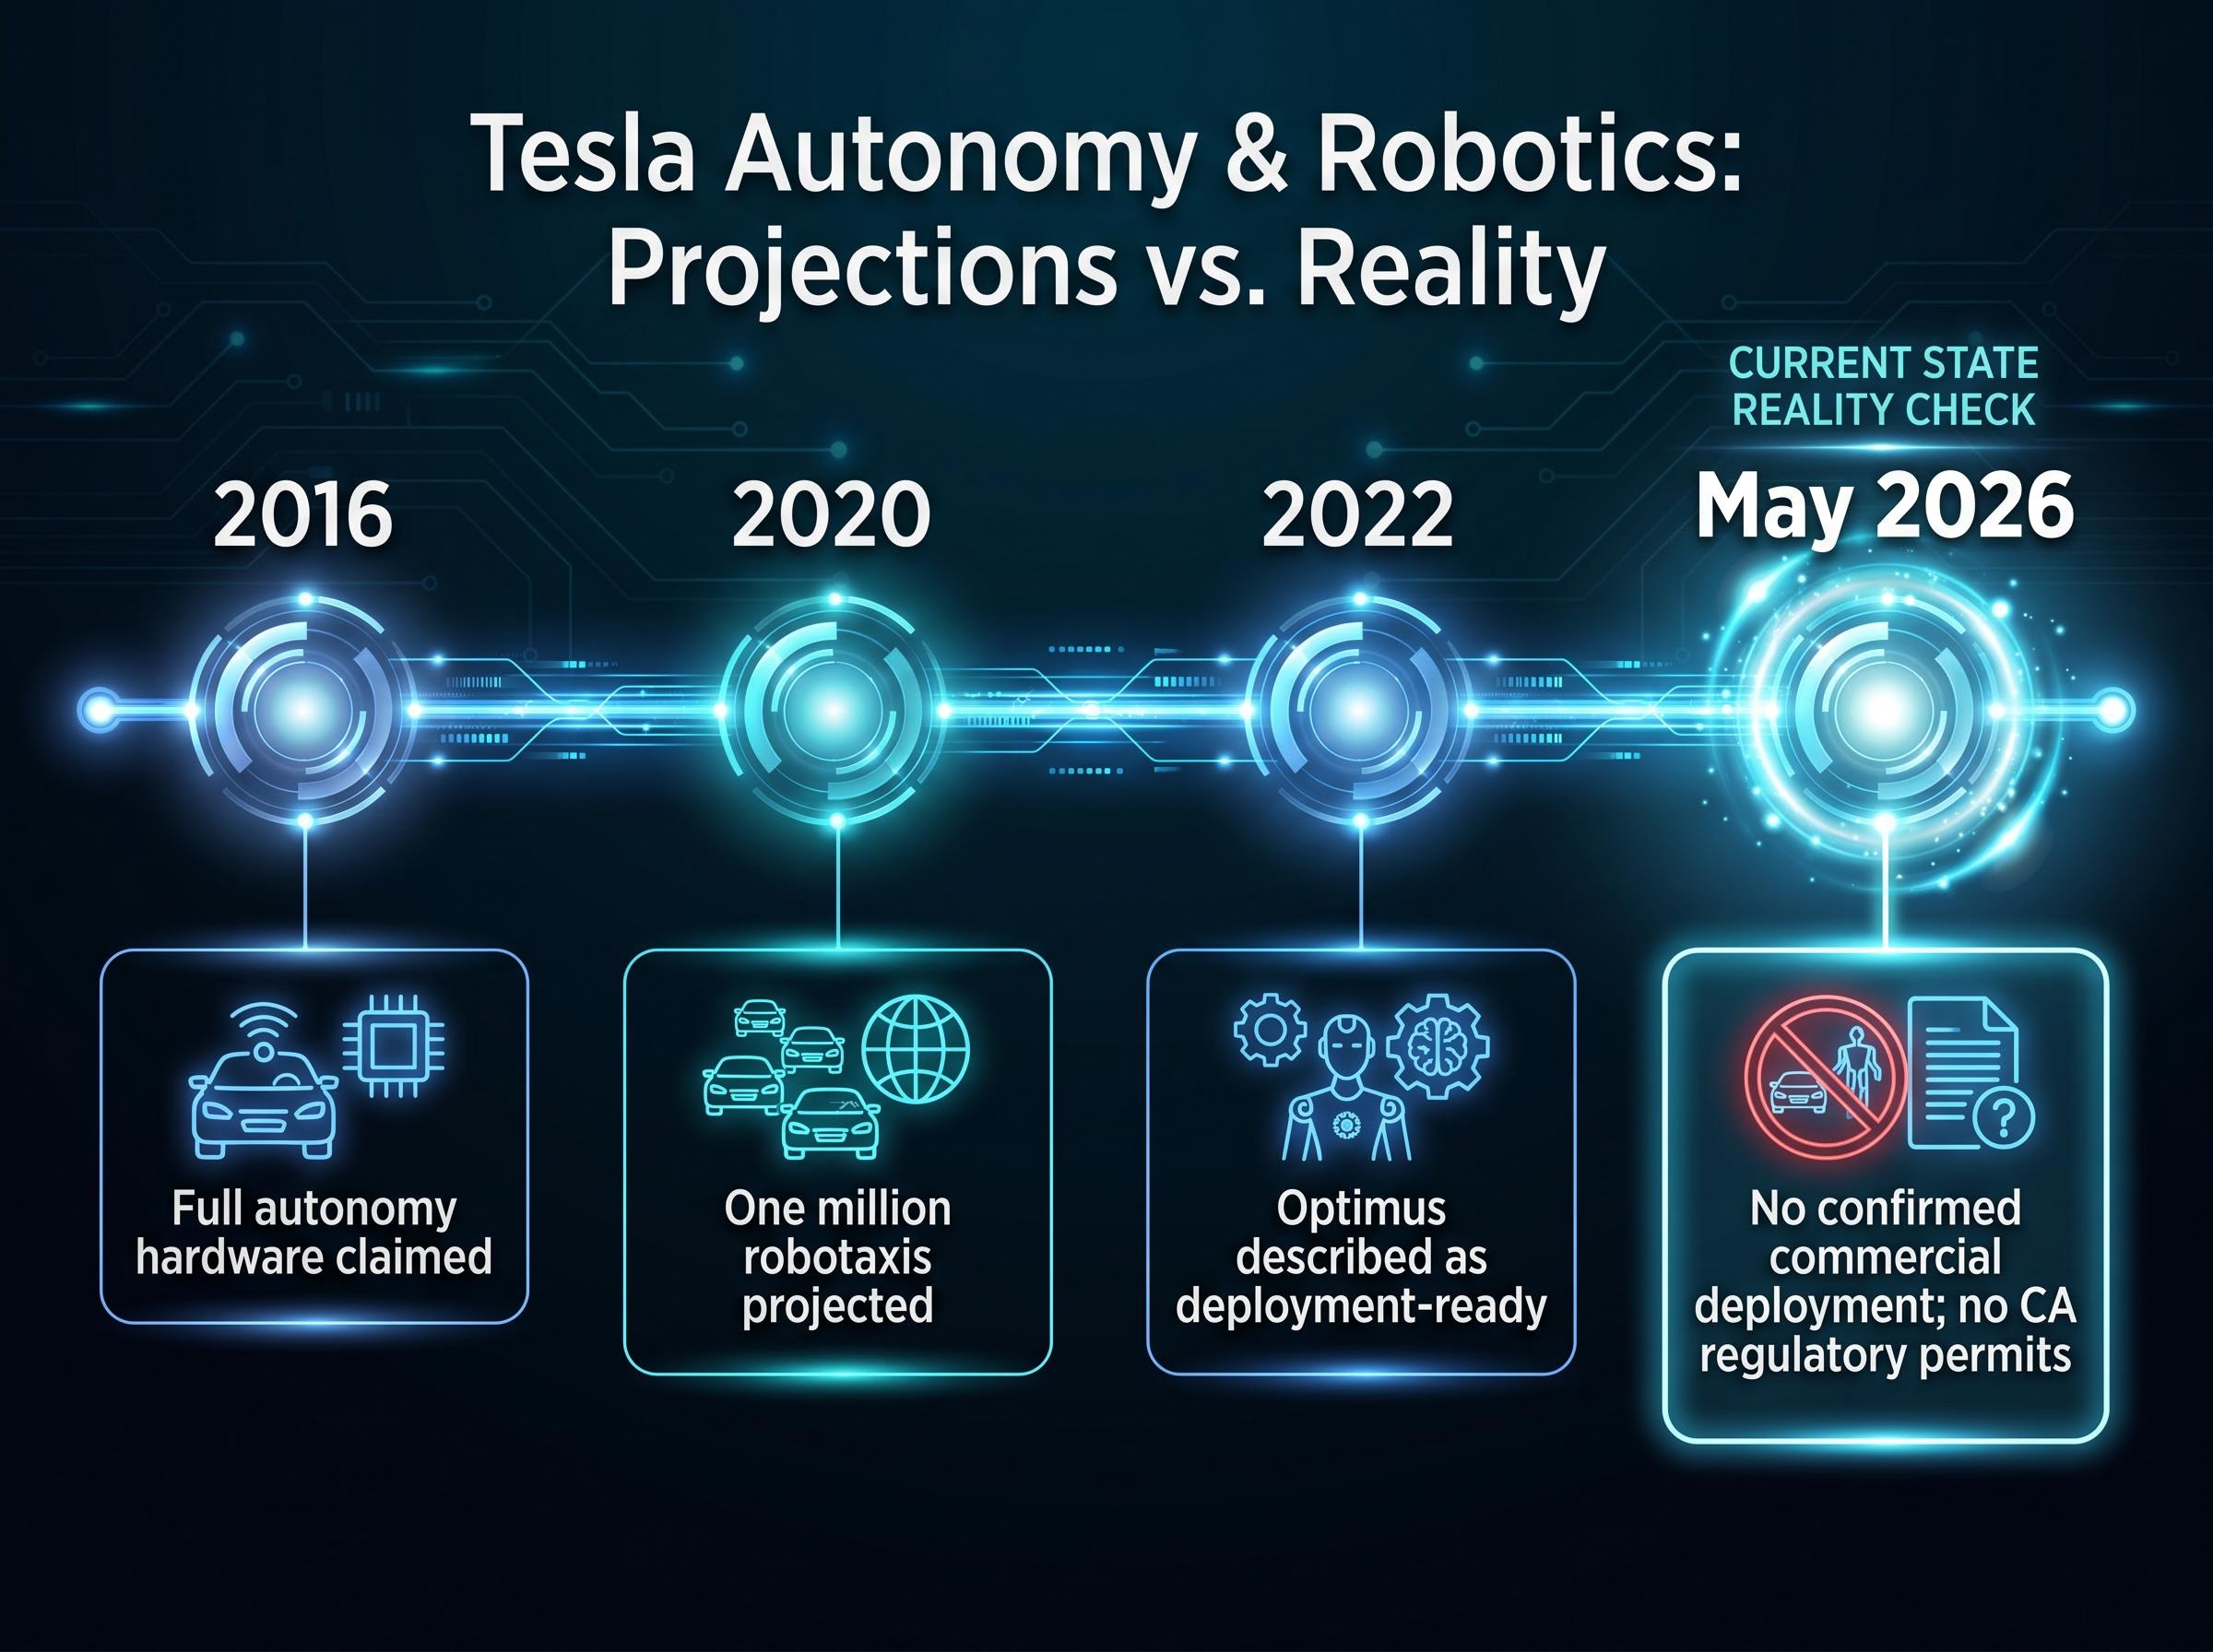
ARK Invest assigns approximately 60% of Tesla’s projected value to the robotaxi business. As of May 2026, that business has no confirmed commercial deployment and no California regulatory permits. Tesla has committed $20 billion in 2026 capital expenditure toward autonomy and robotics, a signal of conviction, but capital commitment is not revenue.
The conditions required for the full bull case to materialise include:
Elon Musk’s track record on timelines adds context. Full autonomy hardware was claimed in 2016. One million robotaxis were projected for 2020. Optimus was described as deployment-ready by 2022. None materialised on stated timelines, though several underlying technologies did eventually progress.
Analysts estimate the probability of the full bull scenario materialising at approximately 5-10%. That does not make the thesis wrong, but it means the expected value calculation is far more complex than any single headline target price suggests.
The bear case is not a collapse scenario. It assumes Tesla continues as a strong EV manufacturer with above-average margins relative to Ford or General Motors, but that the AI and robotics transformation does not contribute meaningfully to revenue within the projection window.
The bear case inputs:
These are not punitive assumptions. A company growing revenue at 9% with 11% net margins and a 20x multiple would be considered a strong performer in most sectors. The problem is the entry price.
At approximately $375-$400 per share, every projected return outcome under the bear case was negative. The current stock price fully embeds the AI and robotics transformation, meaning investors buying at these levels are not being compensated for the risk that it does not happen.
| Assumption | Bear Case | Bull Case |
|---|---|---|
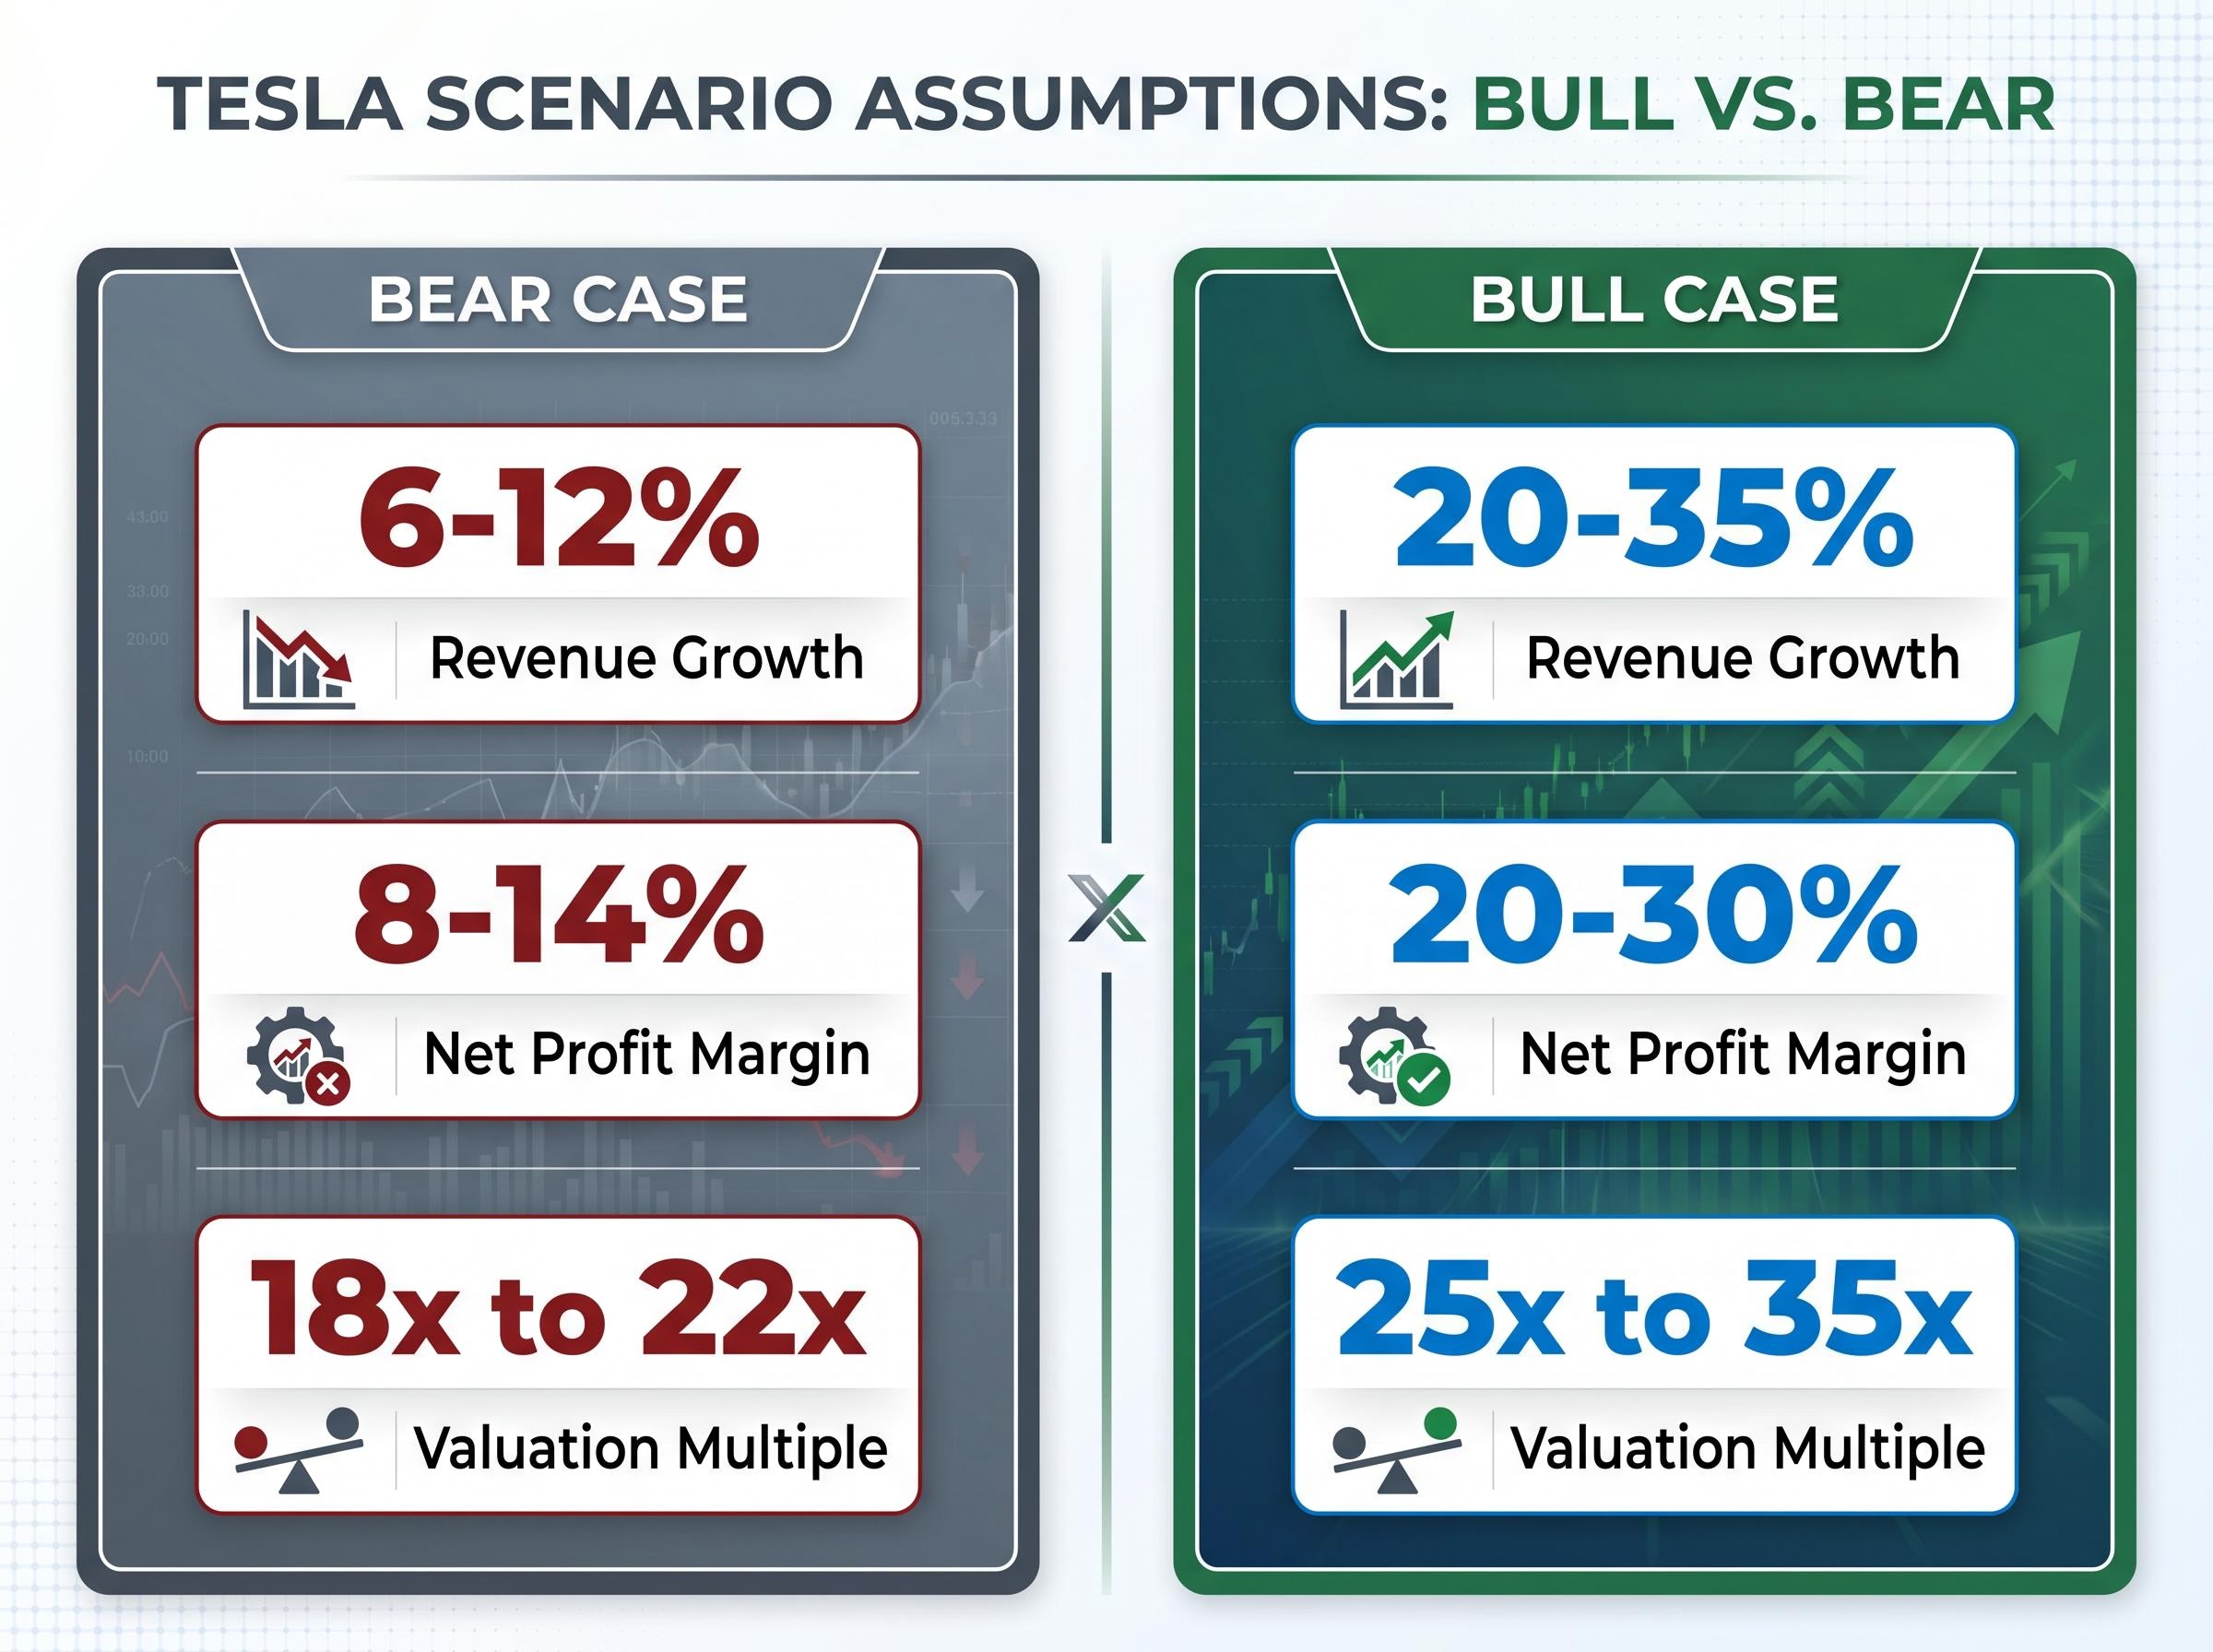
| Revenue Growth (annual) | 6-12% | 20-35% |
| Net Profit Margin | 8-14% | 20-30% |
| Valuation Multiple | 18x to 22x | 25x to 35x |
| Estimated Annualised Return | Negative at current prices | 11-35% |
Competitive pressures reinforce the bear case. Waymo (owned by Alphabet) operates commercial autonomous ride-hailing services in San Francisco and Phoenix, holding a current deployment lead. BYD’s volume advantage in EVs continues to grow. Well-capitalised humanoid robotics competitors, including Figure and Boston Dynamics, are pursuing the same market Tesla’s Optimus targets.
The competitive deployment asymmetry between Waymo and Tesla is one of the most consequential near-term variables in any autonomous revenue projection, because Waymo’s active commercial permits in California and Phoenix represent a concrete operational lead that directly compresses the probability of Tesla generating autonomous ride-hailing revenue within the next two to three years.
Tesla also reported negative free cash flow in Q1 2026, a near-term flag that the heavy capex commitment toward autonomy and robotics is drawing on operational cash before those investments generate returns.
The bear case reveals the asymmetry embedded in the current price: the downside of being wrong about the AI transition is not protected by the underlying automotive business at these valuation levels.
When Tesla trades at approximately $411 (as of 7 May 2026), that price is not neutral. It is an implicit forecast. Reverse-engineering it means asking: what revenue growth, margin trajectory, and valuation multiple does this price require to deliver an acceptable return?
At 80x to 188x implied earnings, the current price compresses future returns by the amount of performance already embedded in today’s valuation. A stock that has moved from $100 to $400 has already delivered most of the return that would have justified the $400 price. Buyers at approximately $100 per share a few years prior entered with a margin of safety that absorbed execution delays, missed timelines, and competitive setbacks. Buyers at approximately $439 in early January 2026 required near-perfect execution of the bull case from day one to generate positive returns.
The same company. Radically different investor outcomes. The only variable that changed was the entry price.
Multiple compression arithmetic adds a layer of asymmetry that entry price analysis alone can understate: a stock at 317x earnings requires substantial earnings growth simply to hold its price flat if the valuation re-rates toward historically normalised levels, meaning real investor returns only begin after that compression headwind has been absorbed.
Margin of safety is the concept that ties scenario analysis to action. It means buying at a price where even the imperfect version of the bull case still produces an acceptable return, rather than requiring the full scenario to materialise.
Forward analyst EPS estimates project more than 5x earnings growth from current levels. At what entry price does that growth produce the return an investor needs, after accounting for long-term capital gains tax considerations (assets held more than one year qualify for preferential rates of 0%, 15%, or 20% depending on income bracket for US investors)?
IRS Topic 409 capital gains rates set the preferential long-term thresholds at 0%, 15%, and 20% for assets held more than one year, with the applicable rate determined by the investor’s taxable income bracket, making the holding period a material variable in any after-tax return calculation.
TIKR’s analysis uses a 10% hurdle rate as a reference point, meaning the projected annualised return must clear 10% to justify the risk relative to a passive S&P 500 allocation. A practical framework for any stock:
Entry price is the one variable investors fully control. Understanding how to use it as a risk management tool, rather than treating it as a passive output of market timing, is one of the most transferable skills in equity analysis.
Every investment thesis is a set of assumptions about the future. The entry price determines how many of those assumptions need to be correct before the investment earns a satisfactory return.
The scenario-based methodology covered in this guide, from DCF inputs to Monte Carlo ranges to entry price sensitivity, is transferable to any company navigating a strategic transition. The next time a company announces a pivot that reframes its identity, the framework applies: build the scenarios, stress-test the assumptions, and work backward from the price to identify what the market is requiring.
Index concentration risk adds another dimension to Tesla’s valuation challenge: with the top ten S&P 500 constituents accounting for 40-43% of total index capitalisation and Tesla itself a significant component of passive benchmarks, investors who hold broad index funds carry material AI-transformation exposure even without making any active decision to do so.
The most useful question an investor can ask at any entry price is not “do I believe in this company?” but “what does this price require me to be right about, and how confident am I in that?”
Tesla’s Q2 2026 filings, autonomy milestone announcements, and regulatory developments will continue to update the scenario probabilities. Revisiting the framework with new data is the discipline that separates active investment analysis from passive speculation.
This article is for informational purposes only and should not be considered financial advice. Investors should conduct their own research and consult with financial professionals before making investment decisions. Past performance does not guarantee future results. Financial projections are subject to market conditions and various risk factors.
—
—
Scenario-based stock valuation analysis assigns explicit probabilities to multiple outcome ranges (bull, base, and bear cases) rather than relying on a single target price, helping investors understand the full distribution of possible returns before committing capital.
You work backward from the current share price through a DCF or scenario model to identify what revenue growth rate, profit margin trajectory, and exit multiple the market is embedding, then stress-test those implied assumptions against realistic bull and bear scenarios.
P/E ratios and price-to-book multiples were designed for businesses with predictable near-term earnings; for companies like Tesla, the majority of projected value comes from businesses (robotaxis, humanoid robots, software margins) that do not yet generate meaningful revenue, making current-earnings benchmarks misleading.
A margin of safety means buying at a price where even an imperfect or partial version of the bull case still produces an acceptable return, rather than requiring every optimistic assumption to materialise on schedule; it is the buffer between what the price demands and what the business can realistically deliver.
A 10% annualised hurdle rate is commonly used as a reference point, meaning the projected return must clear 10% to justify the risk relative to a passive S&P 500 allocation, as referenced in TIKR Terminal's Tesla scenario analysis.