
How to Value a Stock When Its Future Looks Nothing Like Today
29 mins ago

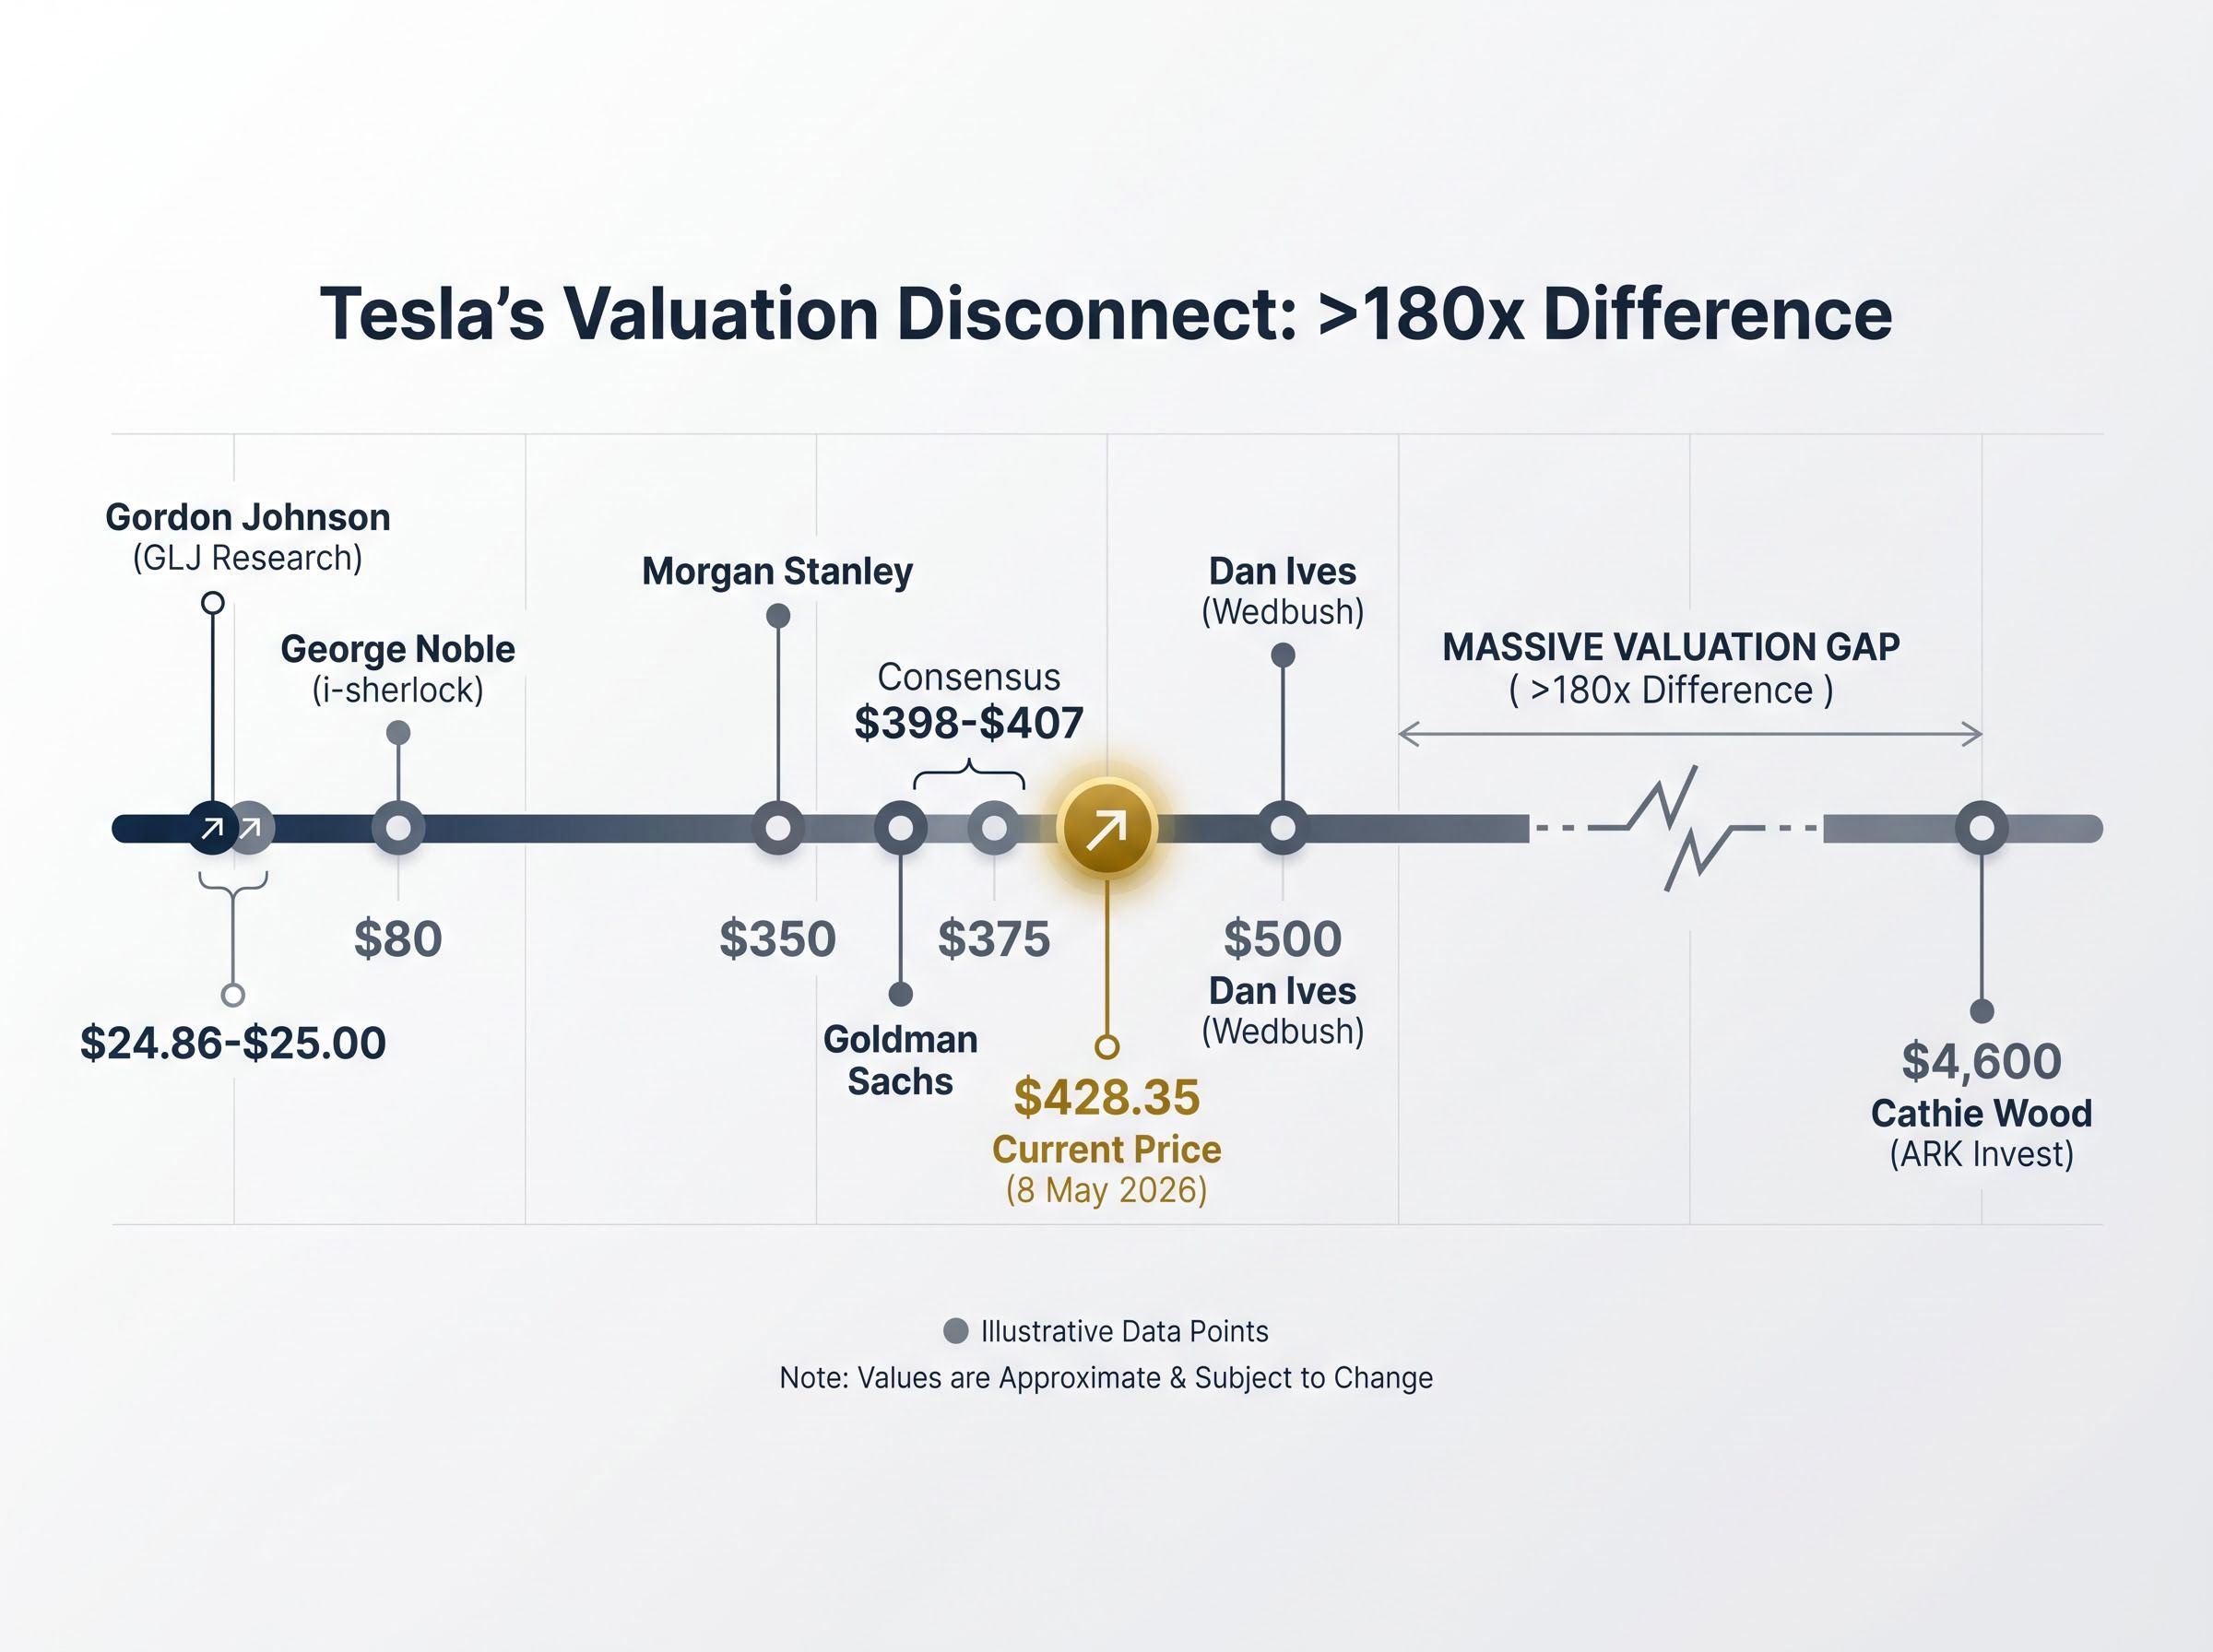
The same company can be worth $25 per share or $4,600 per share, depending entirely on which valuation framework an analyst applies. That is not a thought experiment. Those are live analyst targets for Tesla as of May 2026, produced by professionals examining identical financial data and reaching conclusions separated by a factor of more than 180.
When a company is mid-transition, standard valuation tools fracture. The business is no longer what it was, but it has not yet become what it claims it will be. Investors who rely on a single framework, whether automotive peer multiples or AI platform multiples, without understanding what assumptions they are embedding, are making a much larger bet than they realise.
This guide uses Tesla’s Q1 2026 valuation picture as a concrete case study to teach a broadly applicable investment methodology: how to construct bull and bear scenarios, how to weight them honestly, and why the price paid at entry is often more consequential than which scenario eventually materialises. The skills are portable to any company in transition.
Valuation is not a calculation. It is a framework choice, and the framework encodes assumptions about what kind of company the business will become. Two analysts can look at the same quarterly filing, the same revenue line, the same margin profile, and produce targets that differ by more than 100x.
The Tesla analyst landscape makes this visible in a way few other stocks can.
| Analyst | Firm | Price Target | Core Thesis |
|---|---|---|---|
| Gordon Johnson | GLJ Research | $24.86-$25.00 | Traditional automotive valuation metrics |
| George Noble | i-sherlock | $80 | Fair value under traditional automotive metrics |
| Morgan Stanley | Morgan Stanley | $350 | Overweight on robotaxi expansion thesis |
| Goldman Sachs | Goldman Sachs | $375 | Neutral rating, conservative blended view |
| Dan Ives | Wedbush | $500 | AI and autonomy “golden era” thesis |
| Cathie Wood | ARK Invest | $4,600 | Autonomous vehicle and AI platform upside |
Gordon Johnson’s $25 target treats Tesla as an automotive manufacturer and applies the multiples that peer group warrants. Cathie Wood’s $4,600 target treats Tesla as an AI and robotics platform and applies the multiples that peer group warrants. Both are internally consistent. The disagreement is not about arithmetic; it is about identity.
An automotive peer group (Ford, GM, Toyota) implies a fair value of $25-$80. An AI platform peer group (Nvidia, Alphabet) implies a fair value of $500-$4,600. The framework chosen determines the output before any calculation begins.
The consensus price of approximately $398-$407 is not a neutral answer. It is an implicit probability-weighted blend of these competing frameworks, though analysts rarely make the weights explicit. Tesla’s forward P/E of approximately 188-201x, compared with an automotive sector average of 17.47x, signals that the market has already placed significant weight on the AI and robotics future. The question for any investor is whether they have examined which weights they are personally accepting.
The analyst dispersion documented above is not carelessness. It is a symptom of two genuinely unresolved questions that sit beneath every transitional-company valuation:
Tesla at $428.35 (the 8 May 2026 close), with a market capitalisation of approximately $1.37 trillion and a forward P/E of 188-201x, is not priced as an automaker. The automotive sector trades at an average forward P/E of 17.47x, which means Tesla carries a roughly 10-11x premium to its sector peers. That premium is the market’s embedded confidence in the AI and autonomy transformation. Investors buying shares today are not purchasing cheap optionality on a speculative future; they are buying into a price that already assumes a substantial portion of that future has arrived.
Tesla’s forward P/E premium sits within a broader environment where broad market valuation signals, including a Buffett Indicator reading of 223.6% and a compressed earnings yield spread against Treasuries, suggest that elevated multiples are not unique to single-stock transitions but reflect a wider market condition that amplifies the risk of paying for futures that have not yet arrived.
Damodaran’s industry average forward P/E data, updated in January 2026 from NYU Stern, places the automotive sector at approximately 17x forward earnings, a benchmark that makes Tesla’s 188-201x multiple visible as a direct measure of how much AI and autonomy upside the current share price already embeds.
Dan Ives at Wedbush has made this framework explicit. His bull case assigns approximately $1 trillion in market cap to the base automotive business and an additional $1 trillion to the AI and autonomy layer, producing a combined target of approximately $500 per share, or roughly $2 trillion in total market capitalisation.
Tesla’s Q1 2026 results provide the underlying operational picture: $22.4 billion in revenue (representing 16% year-over-year growth), adjusted earnings per share of $0.40 versus a $0.35 consensus, and gross margins of 21.7% against a 17% consensus expectation.
Rather than projecting Tesla’s future and discounting backward, the reverse discounted cash flow (DCF) approach starts from the other direction. It asks a single question: what must be true about this company’s future revenue, margins, and growth for today’s price of $428.35 to represent fair value?
At $1.37 trillion in market capitalisation and nearly 200x forward earnings, the implied answer requires sustained revenue growth rates, margin expansion, and market dominance well beyond what the current automotive business alone can deliver. The reverse DCF does not tell an investor whether Tesla will succeed. It tells them exactly what they are paying for, and how much room remains if the execution falls short.
The two-question framework above leads directly to a practical exercise: building both the bull and the bear case from the same underlying company, using the same financial starting point, and watching the outputs diverge.
Three variables do the heavy lifting: the revenue growth rate assumed, the net profit margin assumed, and the valuation multiple applied at the end of the modelling period. Changing these three inputs, and nothing else, produces the full range of Tesla outcomes.
| Variable | Bull Case | Bear Case |
|---|---|---|
| Revenue growth (annual) | 20%-35% | 6%-12% |
| Net profit margin | 20%-30% | 8%-14% |
| Valuation multiple | 25x-35x | 18x-22x |
| Projected 10-year annualised return | 11%-35% | Negative |
The bull case assumes autonomy and AI succeed at scale. Revenue compounds at 20%-35% annually, margins expand to 20%-30% as software revenue layers onto the hardware business, and the market assigns a 25x-35x earnings multiple reflecting the platform’s recurring revenue characteristics. At an entry price near $375-$428, this produces annualised returns of 11%-35% over a decade. That is a strong outcome, but one estimated at only 5%-10% probability of fully materialising.
The bear case is not a collapse scenario. Revenue still grows at 6%-12% per year. Net margins of 8%-14% are already above the levels Ford and GM typically achieve. The multiple of 18x-22x is generous by automotive standards. Tesla remains, in this scenario, a strong car company with above-average profitability. And every modelled outcome at approximately $375-$428 per share entry produces negative projected returns.
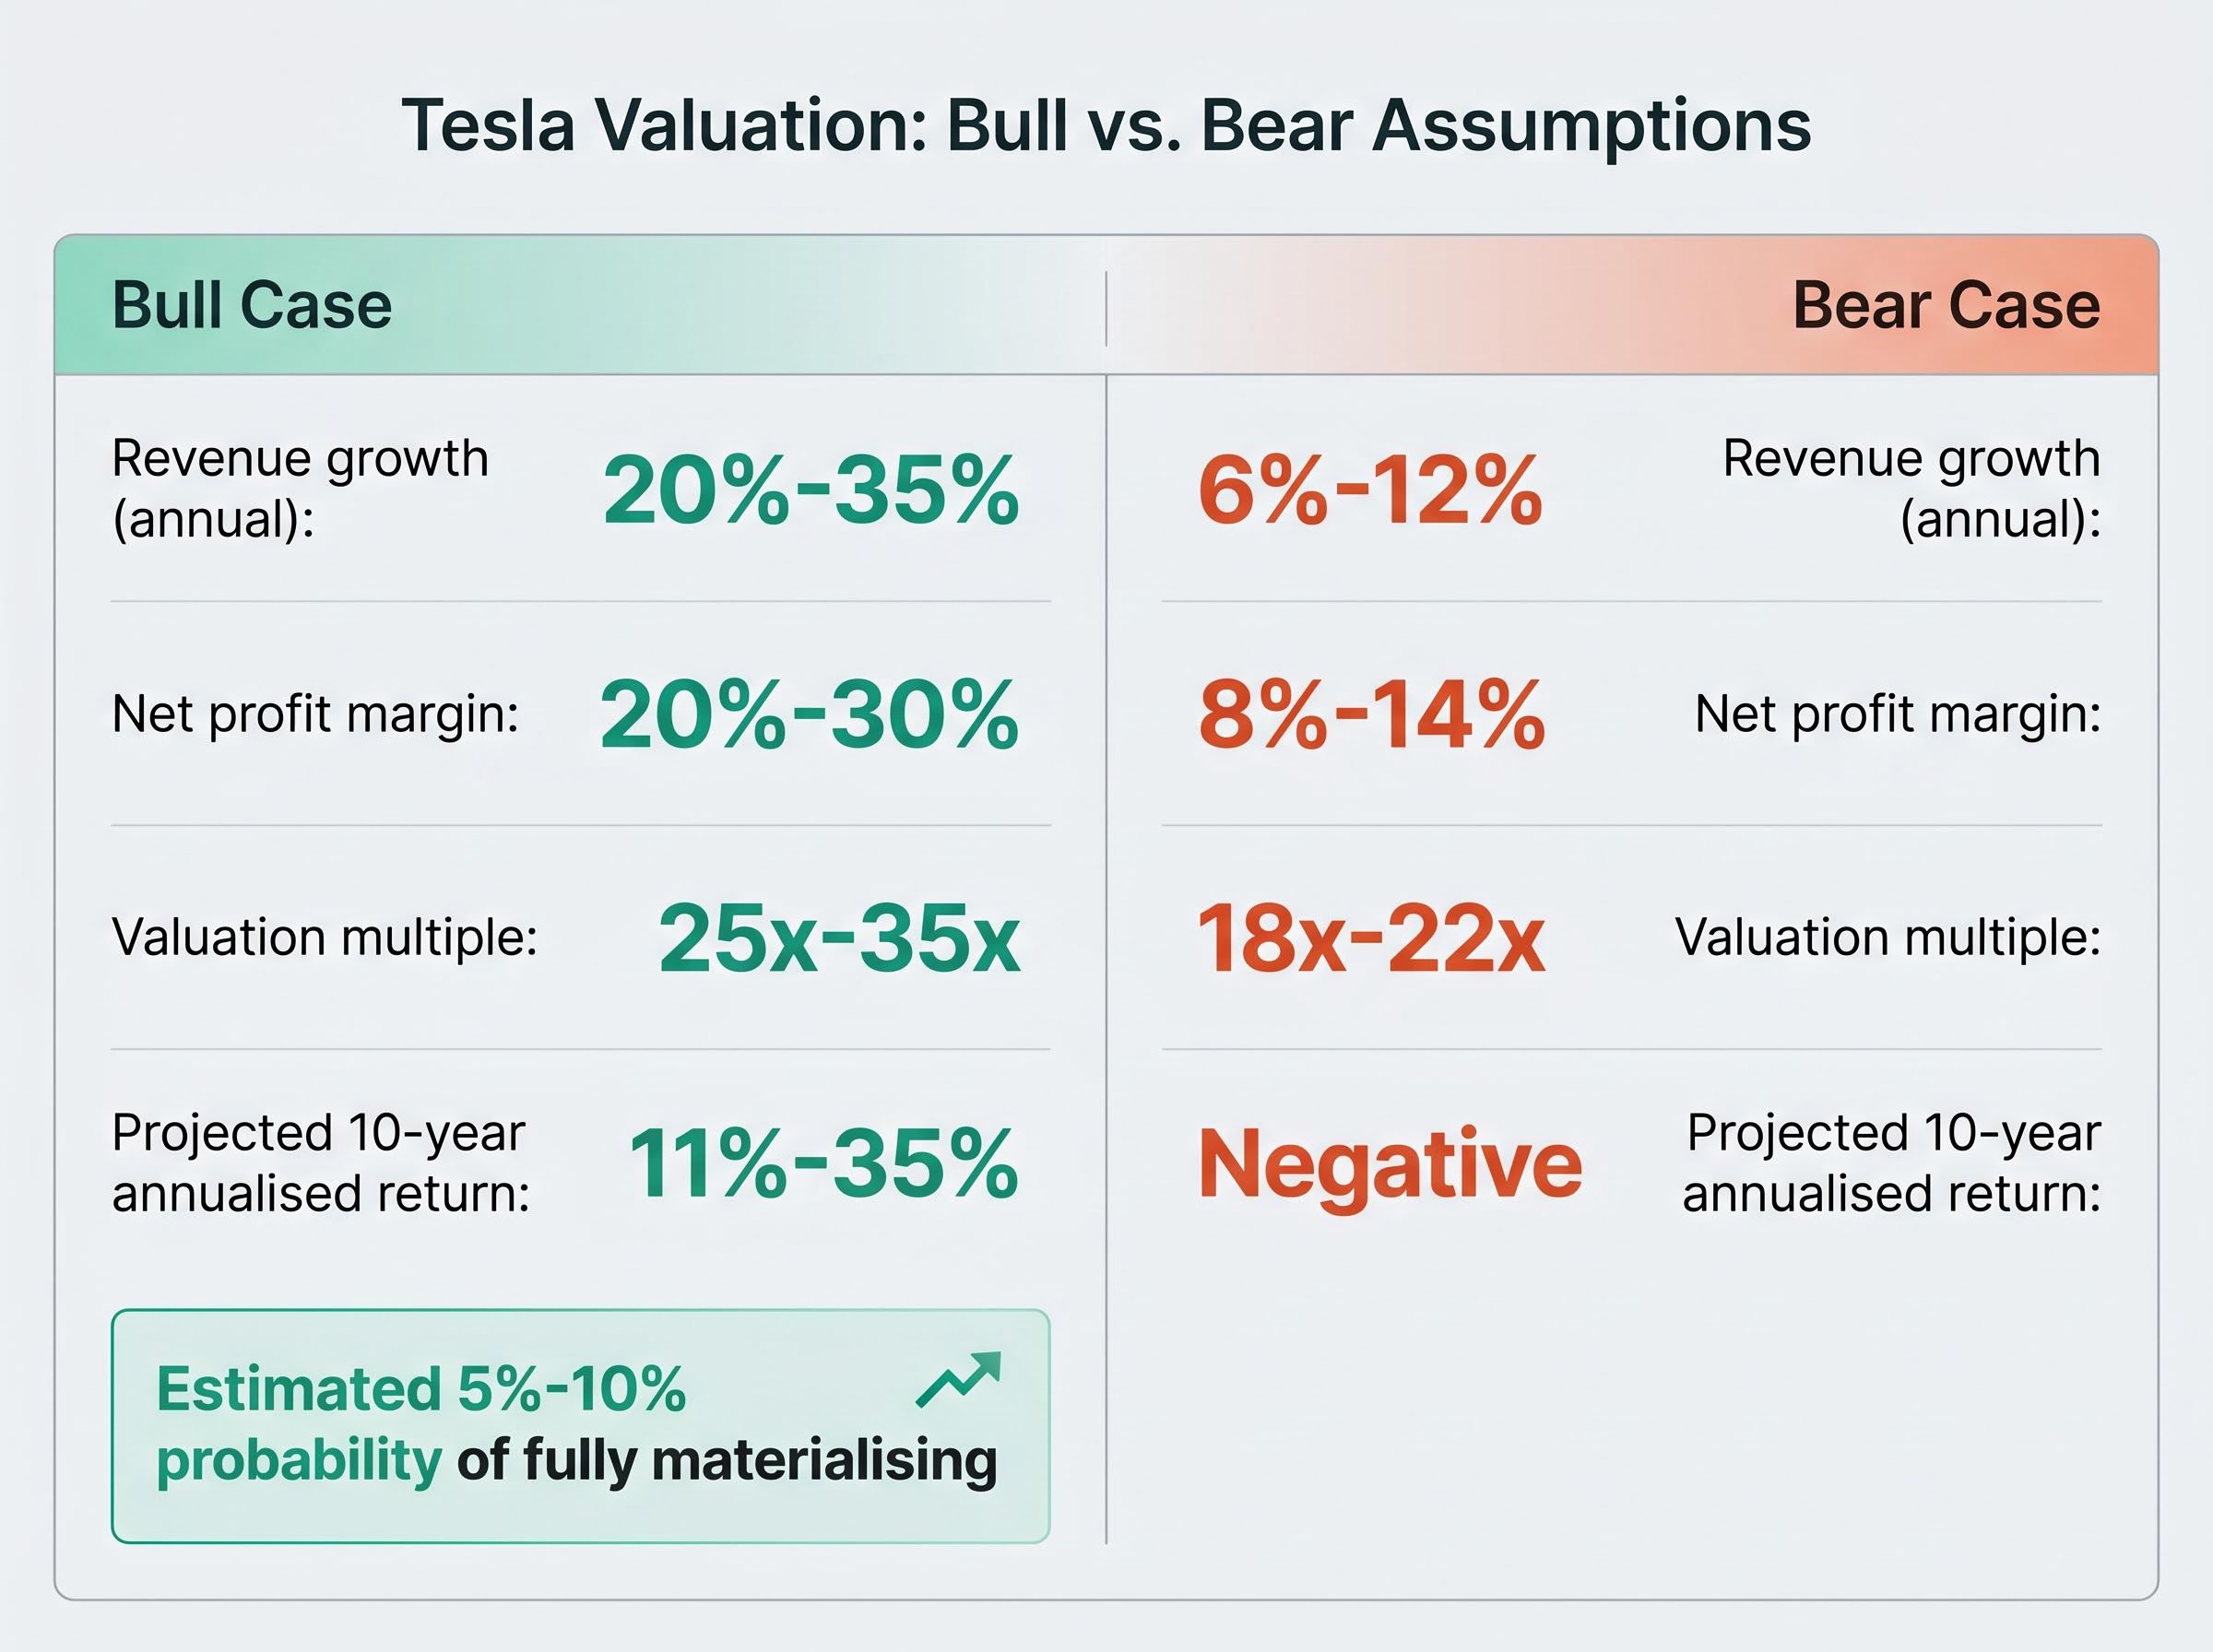
Under the bear case, an investor buying at the current price would face negative returns even with margins above Ford and GM levels. The bear case is not corporate failure; it is a strong car company that never becomes an AI platform, purchased at a price that assumed it would.
For investors wanting to apply explicit probability weights to their own high-multiple positions beyond the Tesla example, our comprehensive walkthrough of probability-weighted scenario construction covers the Damodaran and ARK Invest methodologies for computing blended expected value across bull, base, and bear outcomes, with worked examples showing how the three core variables constrain each other within a structurally consistent model.
Needham has flagged a near-term contributor to this risk, noting that Q1 margin outperformance appears partially driven by non-recurring benefits, with inventory builds and increasing competition cited as headwinds to margin sustainability. If the bear case margins prove optimistic rather than conservative, the negative return picture worsens further.
The scenario exercise above reveals an insight that many investors underestimate: the same successful company can produce dramatically different investor outcomes depending purely on the price paid at entry.
Tesla shares traded near $100 per share in the recent past. At $428.35 today, the same operational future, the same revenue trajectory, the same margin profile, carries a roughly 4x higher entry cost. An investor who bought at $100 and holds through a successful autonomy transition sits in a fundamentally different return position than one who buys today, even if the company’s story unfolds identically.
George Noble (formerly of Fidelity, where he worked as an assistant to Peter Lynch) values Tesla at $80 under traditional automotive metrics. Against the current $428.35, that implies approximately 81% downside if the automotive framework proves correct. Goldman Sachs’ $375 target, a conservative blended view, sits approximately 12% below the current price, offering limited upside even under a moderately optimistic reading.
Forward analyst earnings per share estimates project more than 5x growth from current levels, which indicates the market is already pricing in a substantial earnings recovery. Tesla’s 2026 capital expenditure is expected to exceed $25 billion, generating significant negative free cash flow during the investment phase and adding near-term financial pressure to any entry thesis.
Three questions deserve an answer before buying any transitional stock trading at an elevated multiple:
The margin of safety is not only a buffer against being wrong on price. It is a buffer against being wrong on scenario probability. When the bear case at current entry levels already produces negative returns, the margin of safety effectively vanishes. The investor is left with a position that requires the bull case to materialise simply to avoid loss, and the bull case carries an estimated 5%-10% probability of full realisation.
An adequate margin of safety for an unproven transformation means purchasing at a price where even the bear case offers a tolerable outcome, not merely one where the bull case offers an attractive one.
Margin of safety discipline at the portfolio level extends beyond any single position: Berkshire Hathaway’s $397.4 billion cash reserve and 14 consecutive quarters of net equity selling represent an institutional application of the same principle the article’s three-step framework encodes at the individual stock level, with short-duration Treasuries now yielding more than the S&P 500 earnings yield, reversing the standard opportunity cost argument against holding cash while waiting for adequate entry prices.
Scenario analysis is not a one-time exercise completed at entry. The probability weights assigned to bull and bear cases shift as competitive, regulatory, and execution variables evolve. Tesla offers unusually clear examples of what those variables look like in practice.
Waymo (a subsidiary of Alphabet) provides the most concrete benchmark for early-scale autonomous vehicle commercialisation. As of February 2026, Waymo was generating approximately $355 million in annualised revenue across roughly 10 U.S. cities with unsupervised commercial service. That figure is modest relative to the market opportunity, but it represents a functioning business with paying customers and regulatory approval in multiple jurisdictions. Tesla’s bull case requires surpassing this across far more cities and use cases.
Tesla’s own execution signals are mixed. The Cyber Cab has entered production at the Austin, Texas factory, and FSD has expanded to Dallas and Houston, with autonomous miles driven nearly doubling in Q1 2026 versus the prior period. However, Tesla does not hold California approval for commercial robotaxi operations, and the California DMV adopted new rules on 29 April 2026 governing how autonomous vehicles are cited for traffic violations, effective July 2026.
The California DMV rules on autonomous vehicle citations, adopted on 29 April 2026 and effective July 2026, treat the AV company as the liable party for moving violations, requiring incident reporting and outlining escalating consequences for repeated infractions, a regulatory framework that adds measurable compliance risk to Tesla’s commercial robotaxi rollout timeline.
Musk’s public timeline record is relevant context here. In 2016, he stated that all Tesla vehicles already contained the hardware for complete self-driving capability. In 2019, he projected one million robotaxis operating on public roads by the close of 2020, a target that was not reached. In 2021, he indicated Optimus would be deployment-ready by 2022, which also did not materialise on schedule. The pattern is consistent: genuine technological progress, but delivered later than the announced dates. Investors should treat timeline slippage as a base assumption rather than an exception when assigning probability weights to the bull case.
The four risk variables that break transition-stage bull cases, namely regulatory delay, execution risk on capital-intensive programmes, multiple compression, and management timeline slippage, are all observable and trackable without inside information, which means investors who monitor these signals systematically can update their probability weights in real time rather than waiting for the next quarterly earnings report to revise their thesis.
Monitoring a focused set of forward indicators can help investors update their scenario weights as new information arrives. On the regulatory front, the key items are California’s commercial robotaxi approval status, the enforcement implications of the July 2026 AV citation rules, and the pace of state-by-state unsupervised deployment permissions. On the competitive side, the most instructive data points are Waymo’s expanding city count and revenue trajectory alongside progress from humanoid robotics firms such as Figure and Boston Dynamics, and whether large technology platforms including Microsoft, Google, and Amazon move to enter the autonomous vehicle or robotics markets at scale. Within Tesla’s own operations, the variables that matter most are Cyber Cab ride volume and geographic rollout, the Optimus high-volume production timeline (targeted for summer 2026), the Generation 3 Optimus reveal expected later in 2026, and the progress toward third-party commercial availability projected for 2027.
Each of these variables, when it moves, should prompt a reassessment of the probability weights in the investor’s scenario model, not a new analysis from scratch.
Tesla’s $24.86-to-$4,600 analyst range is not an embarrassment for equity research. It is an honest reflection of what happens when a business sits between two identities, and the framework chosen to value it determines the output before any financial modelling begins.
The consensus of approximately $398-$407 implicitly blends these frameworks without making the weights explicit. Investors who make those weights explicit in their own analysis, stating a probability for each scenario and assessing the entry price against the probability-weighted outcome, hold a more defensible position than those who simply adopt a single target.
Tesla’s Q1 2026 results ($22.4 billion in revenue, 21.7% gross margin) confirm the base automotive business is real and above-average, which is precisely why even the bear case assigns positive margins. The dispute has never been about whether Tesla is a good company. It is about what kind of company Tesla will become, and what price fairly compensates for the uncertainty in that answer.
Paying the right price for the right scenario is the investor’s actual job, and Tesla at $428 illustrates why that job is harder than it looks when the market has already priced in a significant portion of the optimistic outcome. The company may ultimately succeed beyond even the bull case assumptions. The methodology presented here does not prevent participation in extraordinary outcomes; it requires the investor to size that bet with eyes open to the stated probabilities.
Understanding a company’s future correctly is necessary but not sufficient for generating a strong investment return. The investor who buys the right story at the wrong price can still lose. The investor who buys at a price that provides adequate margin of safety under multiple scenarios is positioned to benefit from being right and survive being wrong.
Apply this scenario construction approach to the next high-multiple company in any portfolio review. Map the frameworks, state the probabilities, and test the entry price. The discipline compounds across a lifetime of investment decisions.
This article is for informational purposes only and should not be considered financial advice. Investors should conduct their own research and consult with financial professionals before making investment decisions. Past performance does not guarantee future results. Financial projections are subject to market conditions and various risk factors.
—
A reverse discounted cash flow (DCF) starts from the current share price and works backward to reveal what future revenue growth, margins, and market dominance must materialise for that price to represent fair value. Rather than projecting a future and discounting it, it tells investors exactly what they are paying for at the current entry point.
Analyst price target differences stem from framework selection, not arithmetic errors. When a company straddles two business identities, such as automotive manufacturer and AI platform, applying each peer group's typical valuation multiple produces entirely different outputs before any financial modelling even begins.
Investors explicitly state the likelihood they assign to each scenario (bull, base, and bear), then multiply each scenario's projected return by its probability to compute a blended expected return. The article's framework flags that a position requiring the bull case simply to avoid a loss carries an inadequate margin of safety.
When a stock trades at a large premium to its sector peers, such as Tesla's forward P/E of 188-201x versus the automotive sector average of 17.47x, the share price already embeds significant confidence that the company will successfully transform into a higher-value business. Buyers at that price are paying for a bet that has already been placed on their behalf.
Revenue growth rate, net profit margin, and the valuation multiple applied at the end of the modelling period are the three inputs that, when changed in combination, produce the full range of outcomes between a bull and bear case for any transitional company.


