
Courts Gutted US Tariff Authority. Markets Barely Blinked.
1 hr ago

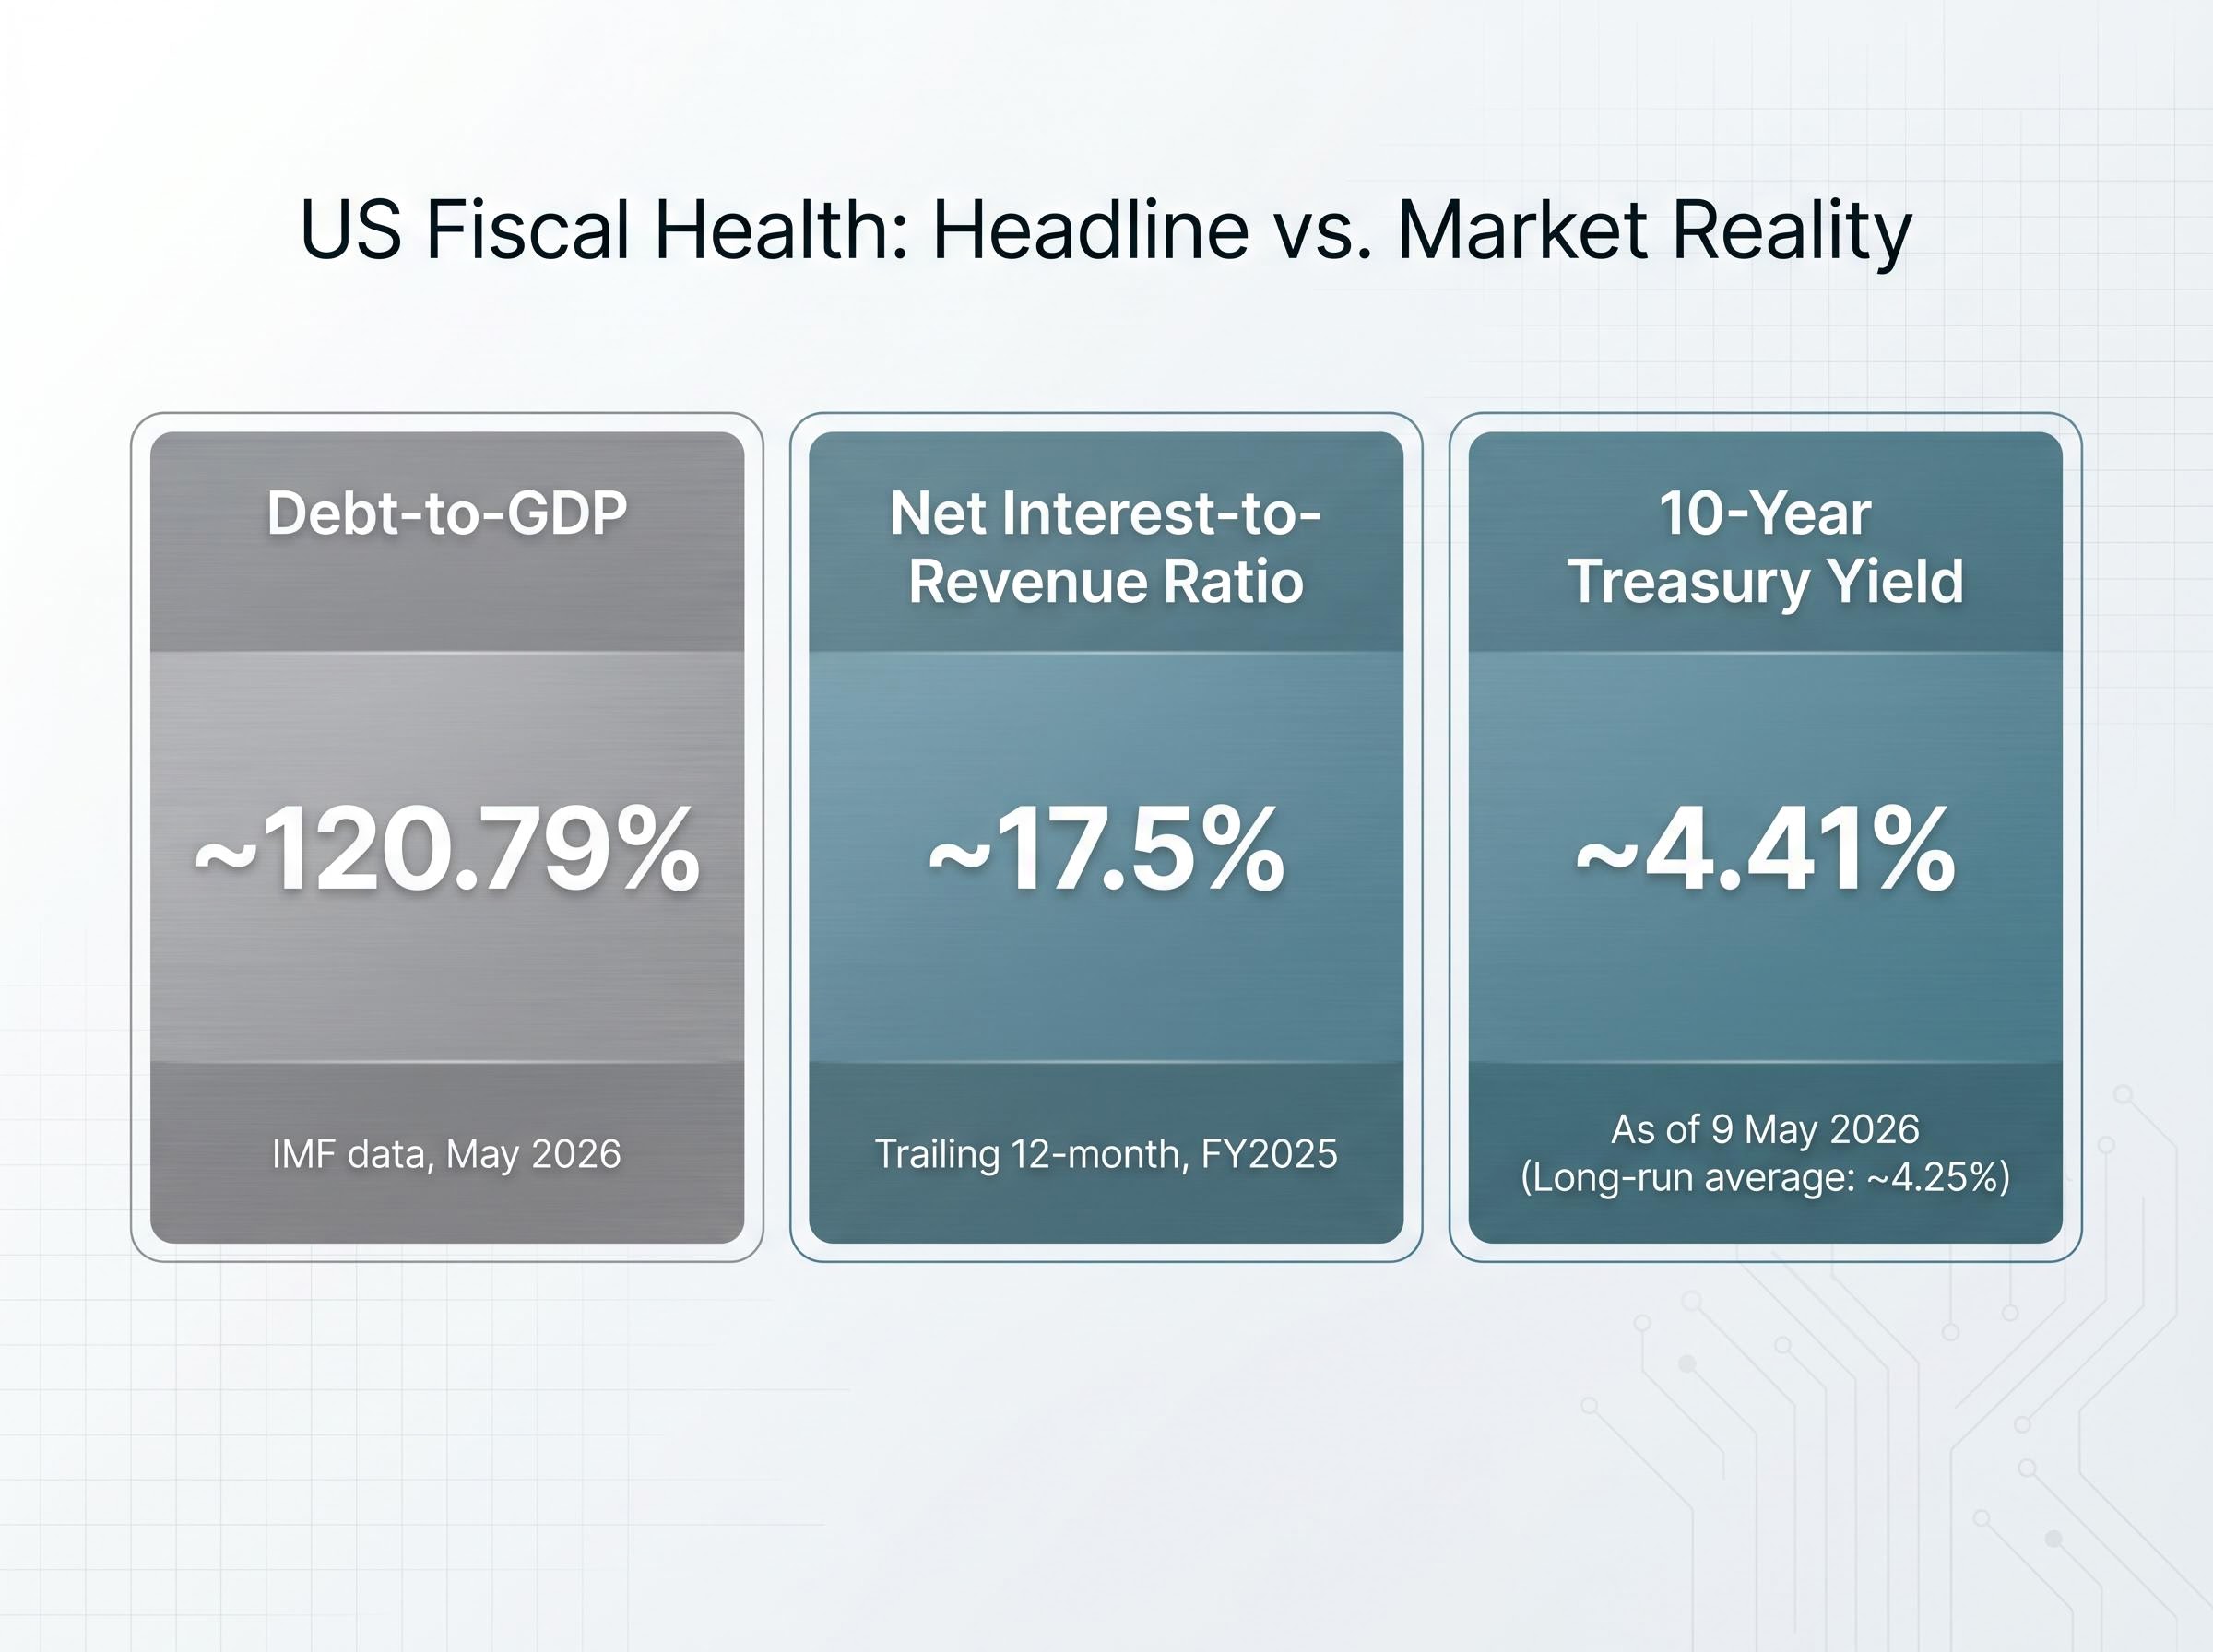
US publicly held debt has crossed 100% of gross domestic product, a milestone that generated alarm across financial media in early 2026. Yet the investors and institutions actually pricing US government bonds appear unmoved. The 10-Year Treasury yield sits near 4.41% as of 9 May 2026, showing no signs of distress pricing, and the gap between the fiscal narrative circulating in headlines and the signals embedded in bond markets has widened enough to demand explanation.
That gap is not an accident. It reflects a structural mismatch between the metric dominating public discourse and the indicators that fixed-income analysts and institutional economists rely on. What follows dissects why debt-to-GDP is a limited tool for evaluating US fiscal health, identifies the measures that bond markets and fiscal analysts actually use, and provides a framework for interpreting future debt headlines with more precision.
The intuitive appeal of debt-to-GDP is real. A single number, expressed as a percentage, that tells you how large a country’s debt pile is relative to the size of its economy. It is clean, comparable across countries, and easy to headline. When it crosses a round number, it feels like a verdict.
It is not. GDP measures the total output of the economy. It is not the government’s income. The government does not use GDP to service its obligations; it uses tax revenue. A ratio that compares debt to the entire economy tells an investor nothing about whether the government can meet its interest payments from its actual cash flows.
The same instinct that leads investors to overreact to a GDP release, treating a lagging summary statistic as a real-time signal, operates in the debt-to-GDP debate: the ratio compresses a complex dynamic into a single number and invites threshold reactions that the underlying data does not support.
“The government does not use GDP to service its obligations; it uses tax revenue.”
The US gross debt-to-GDP ratio is approximately 120.79% according to IMF data as of May 2026. The Congressional Budget Office (CBO) projects it reaching 118% by 2035 under its baseline scenario. The “100% threshold” is a milestone already surpassed, not an edge being approached.
Three structural limitations make debt-to-GDP unreliable as a standalone fiscal health indicator:
Japan has sustained a debt-to-GDP ratio above 200% for over a decade without experiencing a sovereign debt crisis. That fact alone suggests the metric is a poor predictor of fiscal outcomes.
The interest-to-revenue ratio asks a simpler, sharper question: what share of the government’s income goes to paying interest on its debt? This is the metric that captures the actual cash-flow burden.
The current US federal net interest-to-revenue ratio sits in the 17-19% range for FY2025, with the trailing 12-month figure near 17.5%. Data from the Committee for a Responsible Federal Budget (CRFB) projects the ratio reaching approximately 19.2% for FY2026. EPIC for America reports that net interest reached approximately $497 billion for the first six months of FY2025, up 13% year-over-year.
The interest-to-revenue ratio has become the preferred lens among fiscal analysts precisely because it connects the debt stock to the government’s actual cash flows; at approximately 18.5% of US tax revenue in FY2025, the figure sits below the 20% threshold that many analysts flag as an early warning level.
Those numbers are elevated. They are not unprecedented.
| Period | Approximate Interest-to-Revenue | Context |
|---|---|---|
| Late 1980s / early 1990s | ~18-20% | No fiscal crisis; acceptable equity market performance |
| FY2025 (trailing 12-month) | ~17.5% | Post-rate-hike adjustment period |
| FY2026 (CRFB projection) | ~19.2% | Continued upward trend under baseline CBO assumptions |
The late 1980s and early 1990s carried comparable debt servicing burdens. That period was not associated with fiscal crisis or sustained equity market underperformance.
The ratio has risen materially from the near-zero-rate era lows of 2020-2021, and the CRFB projection indicates the trajectory continues upward. This is a genuine fiscal development that warrants monitoring.
A rising interest-to-revenue ratio becomes a structural concern when it crowds out other government expenditure or forces debt restructuring. Current CBO baseline projections do not indicate either condition in the near term. The ratio is climbing, but it remains within a historically navigable range.
Debt-to-GDP was not designed as a crisis indicator. It was adopted by the International Monetary Fund and World Bank as a cross-country comparability tool, where consistency of measurement across dozens of economies mattered more than precision for any single one. For that purpose, it works. Comparing Japan’s fiscal position to Italy’s requires a common denominator, and GDP provides one.
The problem emerged when the metric migrated from institutional economic research into political discourse and financial media. Round-number thresholds, 100%, 120%, 150%, became crisis markers, which was never the analytical design intent. The metric tells you the size of the debt relative to the economy. It does not tell you whether the debt is sustainable.
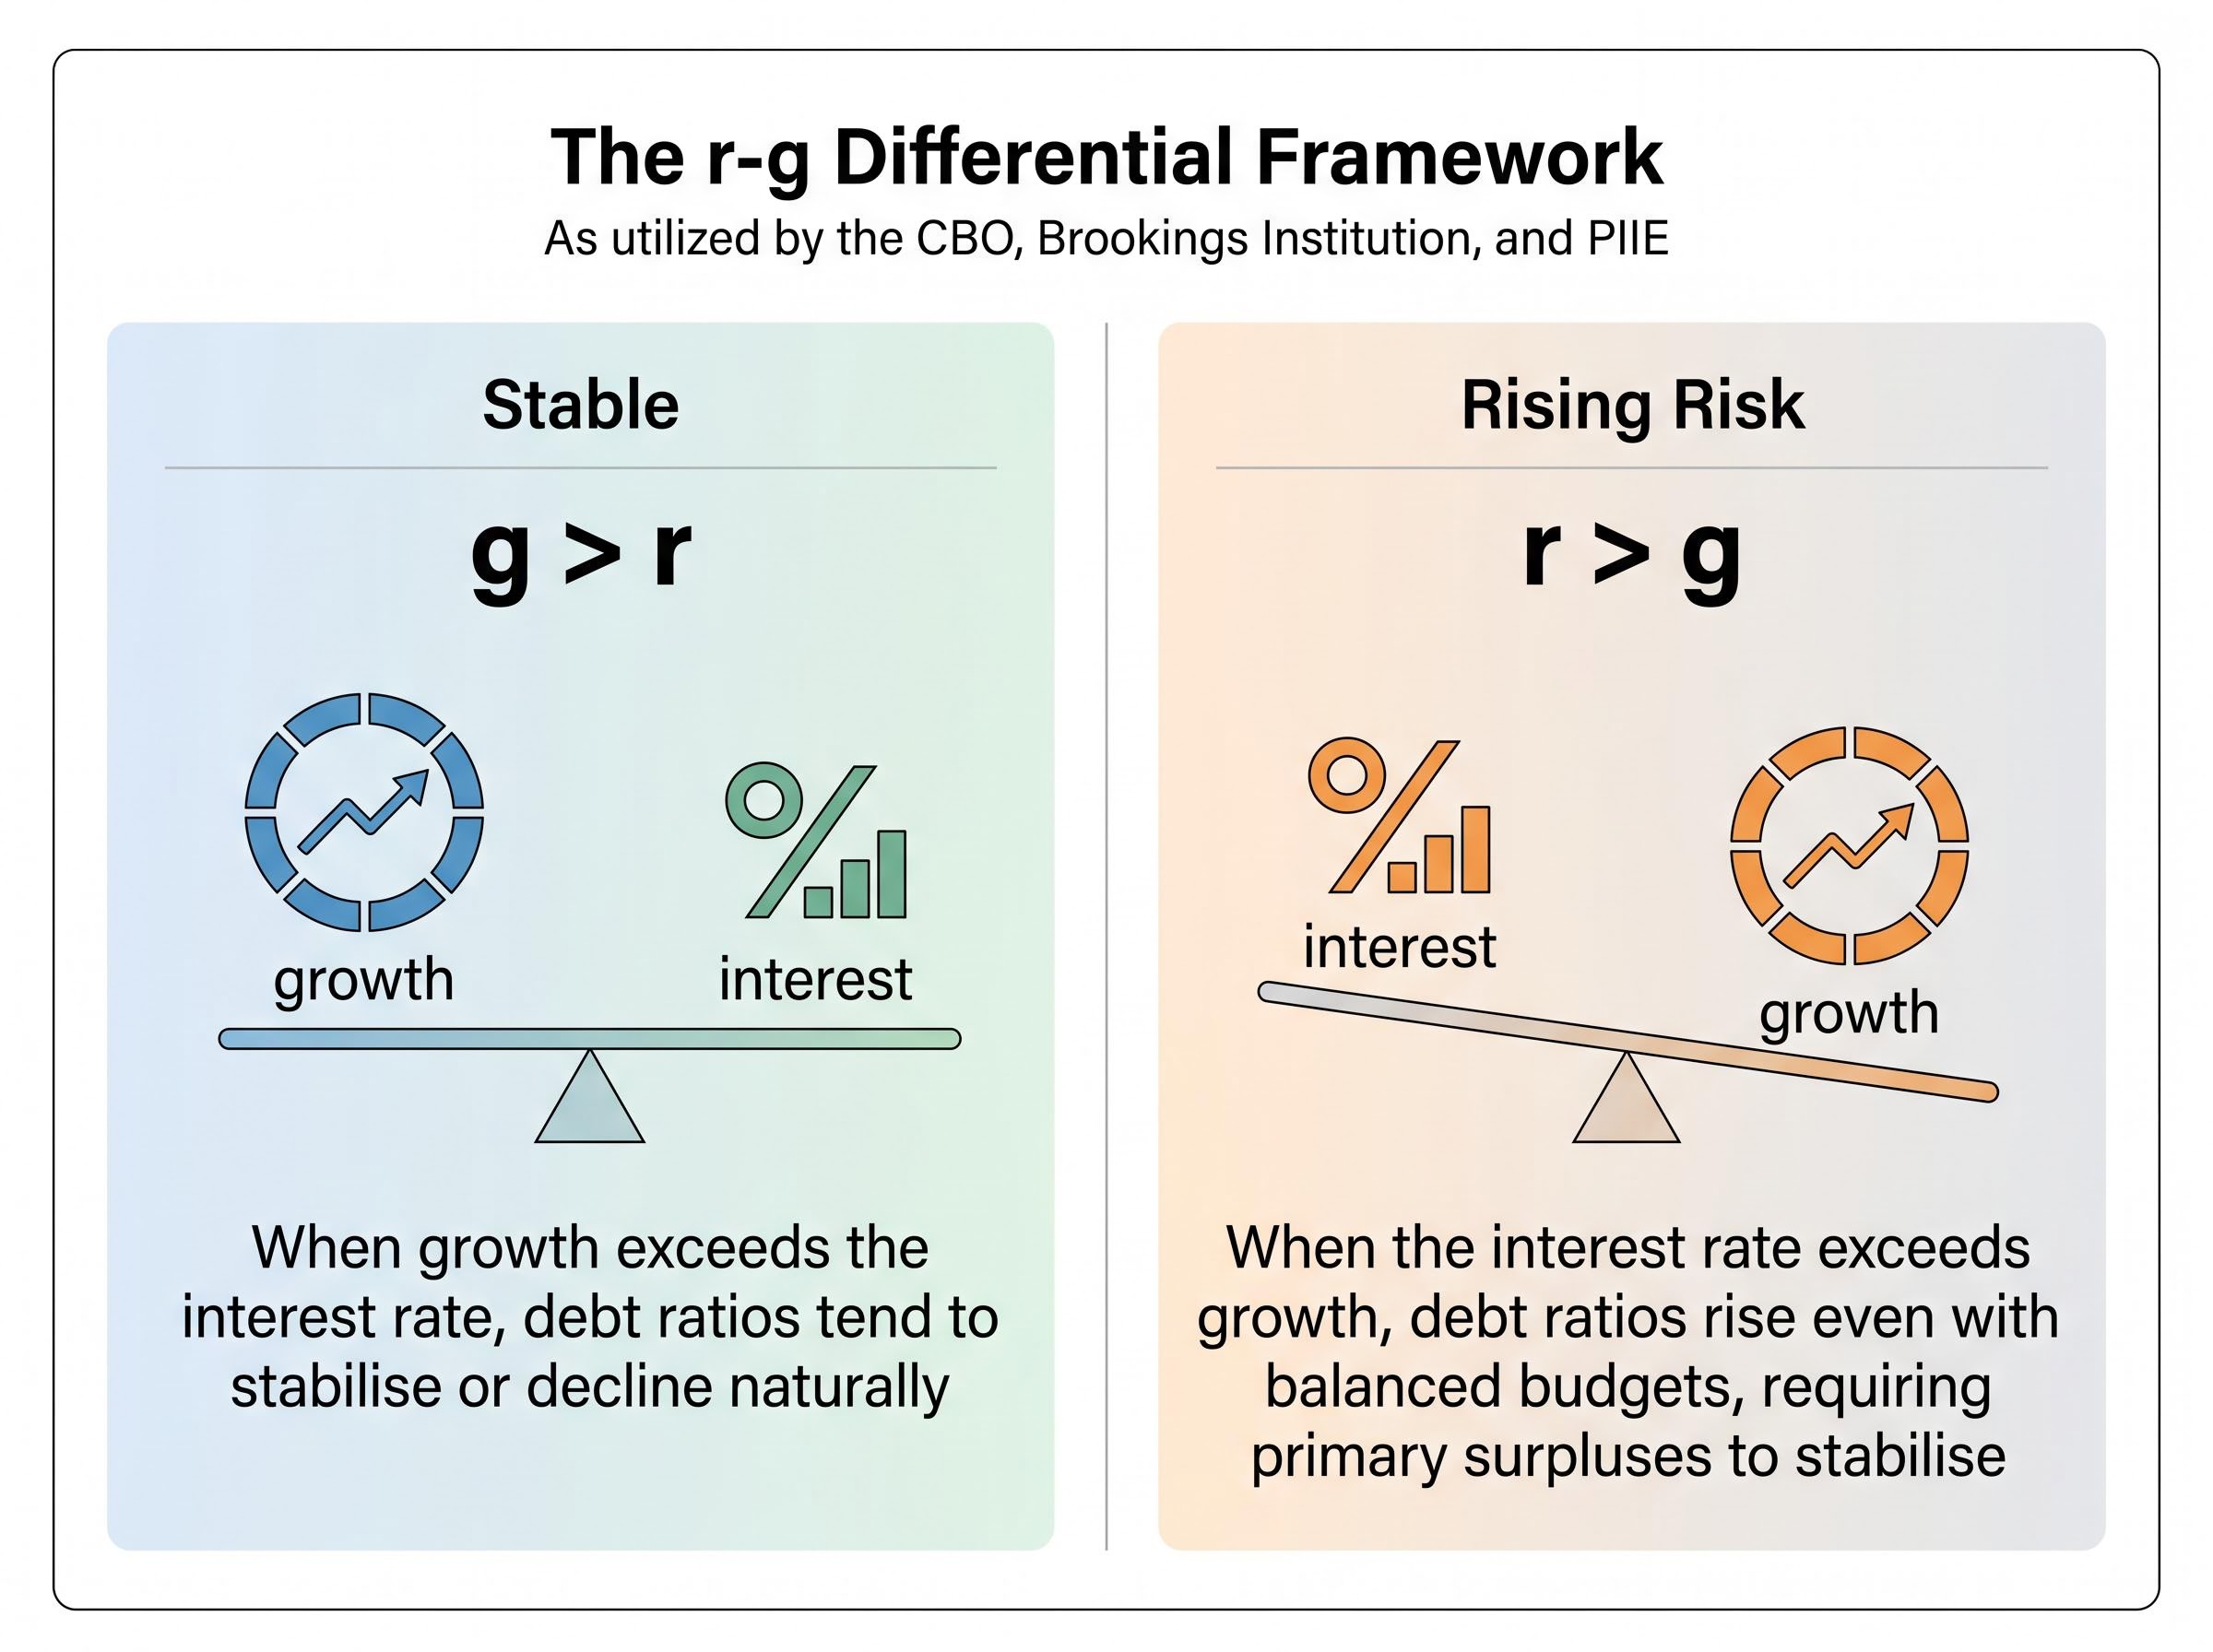
Institutional economists at the CBO, Brookings Institution, and the Peterson Institute for International Economics (PIIE) have emphasised a different framework: the r-g differential. This measures the gap between the interest rate on government debt (r) and the nominal GDP growth rate (g).
The r-g differential captures the dynamic that static ratios miss: whether growth is outpacing the cost of carrying debt, or falling behind it.
The logic operates in three steps:
The current US environment features nominal GDP growth rates that remain competitive with Treasury yields, creating conditions where debt dynamics are more stable than raw ratio comparisons imply. Understanding this framework protects investors from reacting to future threshold headlines, whether at 125%, 150%, or any other round number that generates media attention.
Bond markets are the most direct expression of how institutional investors price US sovereign credit risk. Every day, billions of dollars in Treasury transactions embed a collective verdict on the US government’s creditworthiness.
That verdict, as of 9 May 2026, is expressed in a 10-Year yield of approximately 4.41%. The long-run historical average for the 10-Year Treasury is approximately 4.25%. Current yields are near the long-run average, not dramatically elevated above it, and not suppressed below it.
This is the empirical signal that matters. If US debt levels were generating genuine market concern about fiscal credibility, the transmission mechanism would be visible: higher yields, an elevated term premium, and widening credit default swap spreads. None of those signals are present in the current data.
A sustained sharp rise in 10-Year Treasury yields is the signal that would indicate genuine market concern about US debt. The absence of that signal is itself informative.
Bond market participants focus on a different set of inputs than headline debt ratios:
Term premium dynamics add a further layer of complexity to yield interpretation: Wolfe Research’s sign-restriction model shows that only a fraction of recent yield moves are attributable to geopolitical risk, with the remainder driven by growth repricing and structural supply factors that persist regardless of near-term policy developments.
Gross debt above 120% of GDP, paired with yields near historical averages, tells a clear story: the market is not pricing fiscal distress.
If crossing 100% debt-to-GDP reliably predicted fiscal crisis, the historical record should show it. It does not.
| Country | Debt-to-GDP (2025-2026) | 10-Year Yield (May 2026) | Key Structural Factor | Crisis Status |
|---|---|---|---|---|
| Japan | ~230-236% | ~2.48-2.51% | ~90% domestically held debt | No sovereign crisis |
| Canada | ~113% | ~3.49% | Strong institutional credibility | No sovereign crisis |
| Italy | ~137.1% | Spreads ~53-100bps vs. Bunds | ECB backstop mechanisms | Contained; no acute crisis |
| United States | ~120.79% | ~4.41% | Reserve currency; deep Treasury liquidity | No sovereign crisis |
Japan is the most striking case. At 230-236% debt-to-GDP, it carries the highest ratio among advanced economies by a wide margin. Its 10-Year yield remains below 2.51%. Approximately 90% of its government debt is held domestically, a structural buffer that insulates it from foreign capital flight.
Italy, at 137.1%, operates within the eurozone, where ECB backstop mechanisms have compressed sovereign spreads to 53-100 basis points above German Bunds. Canada, at 113%, maintains market access without distress pricing.
The comparison has limits. Each country’s fiscal situation is shaped by currency regime, domestic debt ownership, and central bank structure in ways that make direct analogies imprecise. The United States holds structural advantages not captured in the raw ratio: reserve currency status, unmatched Treasury market depth, and allied-nation ownership of US debt.
The data, however, answers the threshold question directly. Advanced economies have sustained debt-to-GDP ratios well above 100% for extended periods without acute crises. The structural conditions surrounding a country’s debt matter far more than the ratio itself.
The argument presented here is not that US fiscal dynamics are without concern. The interest-to-revenue ratio is rising. The CBO projects debt reaching 118% of GDP by 2035 under baseline assumptions. Primary deficits are not shrinking. These represent a real long-run structural challenge.
The argument is that the current position, elevated but historically navigable, is distinct from a crisis-level position. Making that distinction correctly is an investor discipline question.
The CBO long-term budget projections provide the baseline scenario underlying these debt trajectory estimates, including the agency’s forecast that net interest outlays will continue climbing as a share of GDP through the 2030s under current policy assumptions.
Three conditions would warrant a reassessment of the fiscal outlook, each observable and data-driven:
The CRFB projects interest-to-revenue at approximately 19.2% for FY2026. The current trajectory does not reach the 25-30% stress threshold in near-term projections. The late 1980s and early 1990s, when comparable servicing ratios prevailed, were associated with acceptable equity market performance.
These are the tools for distinguishing between a challenging fiscal position and a crisis-level one.
Investors wanting to model what a sustained yield breakout would mean across asset classes will find our deep-dive into the 30-year Treasury yield stress threshold, which examines how a breach of 5% would transmit through mortgage markets, corporate borrowing costs, and federal debt service obligations, with historical precedents from Japan in 1989, the United States in 1999, and China in 2007.
This article is for informational purposes only and should not be considered financial advice. Investors should conduct their own research and consult with financial professionals before making investment decisions.
Past performance does not guarantee future results. Financial projections are subject to market conditions and various risk factors.
US gross debt above 120% of GDP is not a fiction. The number is real. The question is whether that number, expressed in that metric, tells investors what they need to know about the government’s capacity to service its obligations.
The evidence suggests it does not. The interest-to-revenue ratio, currently in the 17-19% range, places the US in historically navigable territory. The 10-Year Treasury yield, near its 4.25% long-run average, carries no distress signal. International precedent shows that advanced economies sustain ratios well above 100% without crisis when structural conditions support it.
The next time a debt-to-GDP milestone generates a wave of headlines, the framework is straightforward. Ask whether the metric being cited captures the government’s cash-flow capacity to service its debt. Then ask whether bond markets are pricing distress. If the answer to both is no, the headline is noise. If either answer changes, the calculus changes with it.
The interest-to-revenue ratio measures what share of government tax revenue is consumed by interest payments on its debt, making it a more precise indicator of fiscal health than debt-to-GDP because it connects the debt stock to actual government cash flows. The US ratio sits in the 17-19% range for FY2025, below the 20% threshold many analysts flag as an early warning level.
The 10-Year Treasury yield of approximately 4.41% as of May 2026 is near its long-run historical average of 4.25%, showing no signs of distress pricing despite gross debt exceeding 120% of GDP. Bond market participants would signal genuine fiscal concern through sustained yield spikes, elevated term premiums, and widening credit default swap spreads, none of which are present in current data.
Debt-to-GDP compares government debt to total economic output rather than to government revenue, meaning it reveals nothing about whether the government can actually service its interest obligations from its own cash flows. It also ignores the interest rate paid on the debt and whether economic growth is outpacing the cost of carrying that debt, both of which are critical to determining sustainability.
The r-g differential measures the gap between the interest rate on government debt (r) and the nominal GDP growth rate (g), and captures whether the economy is growing faster than interest accumulates. When growth exceeds the interest rate, debt ratios can stabilise or decline naturally; the current US environment features nominal GDP growth rates that remain competitive with Treasury yields, creating more stable debt dynamics than raw ratio comparisons imply.
Investors should watch for a sustained move in 10-Year Treasury yields above 5.5-6%, the interest-to-revenue ratio breaking above 25%, or a CBO projection showing the interest rate on debt persistently outpacing economic growth. Current data places the interest-to-revenue ratio at approximately 19.2% for FY2026, well below the 25-30% stress threshold associated with fiscal distress in advanced economies.


