VAS vs VHY: Why the Lower-Yield ETF Wins in Retirement
4 hrs ago
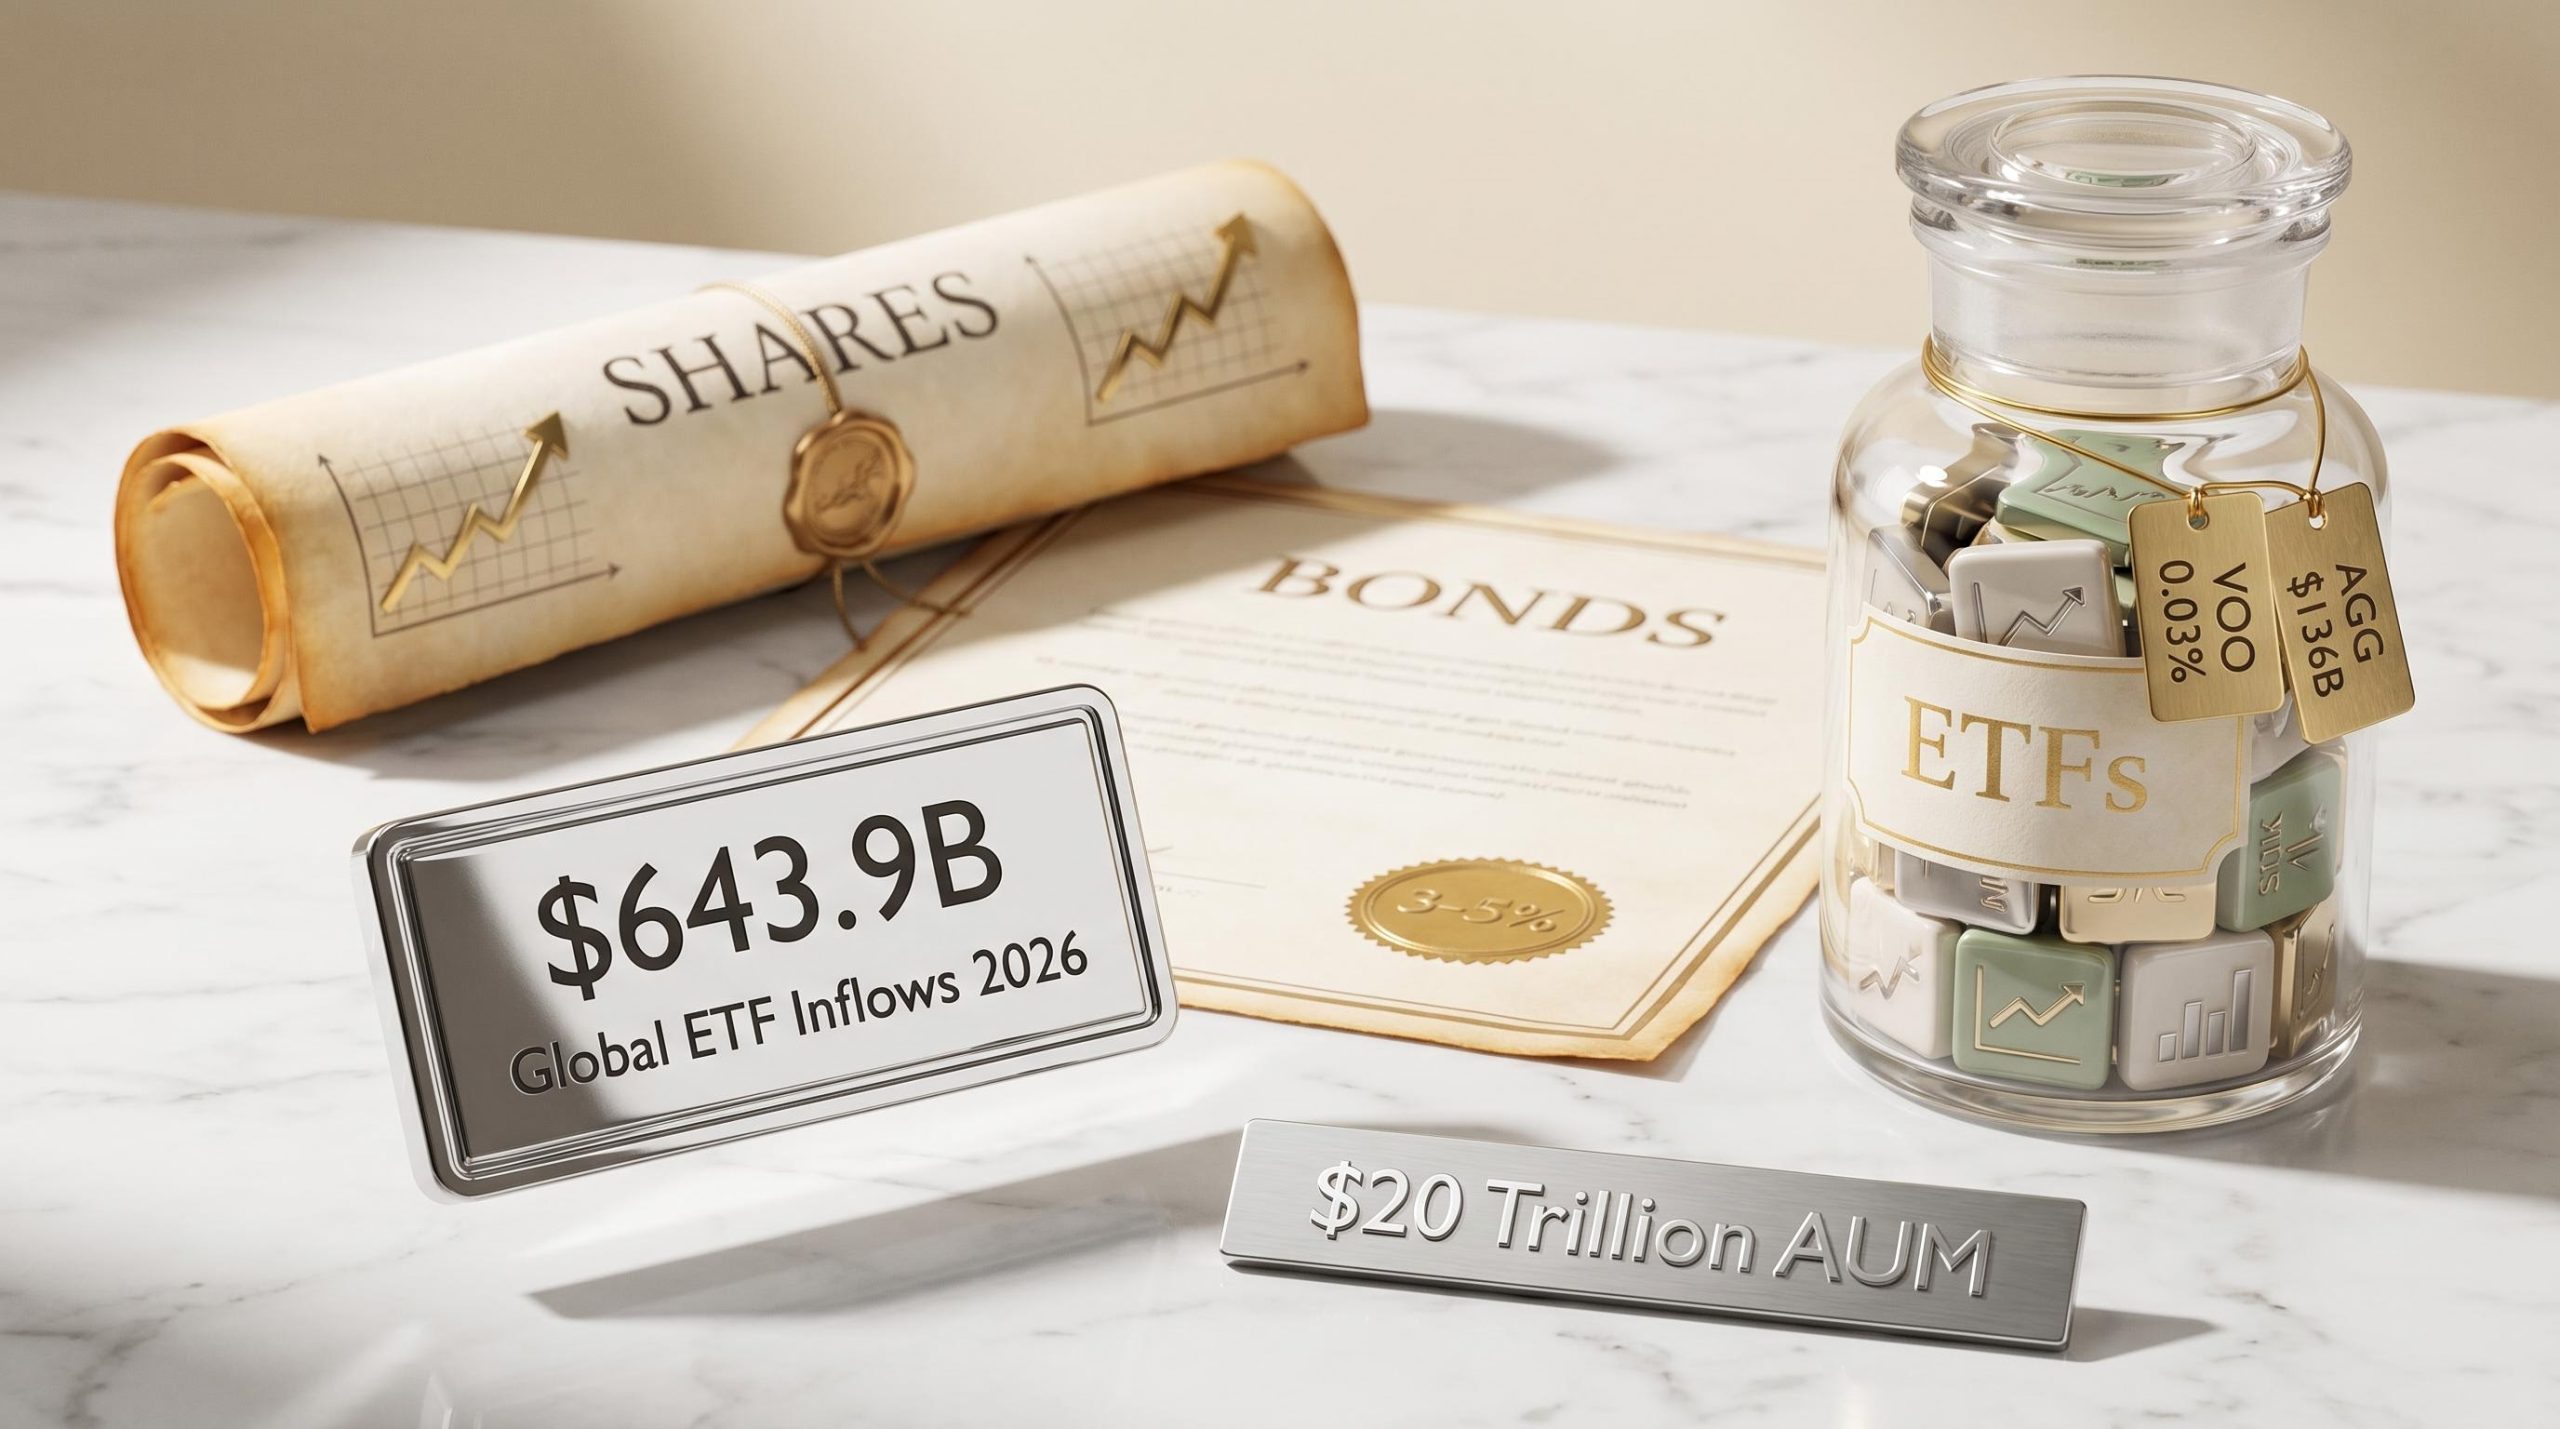
Global ETF inflows hit $643.9 billion in the opening months of 2026 alone, yet most first-time investors still struggle to answer a basic question: what exactly am I buying when I invest? The gap between wanting to invest and understanding what that means has never mattered more, with retail participation in capital markets running at record levels this year. Choosing the wrong vehicle for a given goal, risk tolerance, or time horizon remains one of the most common and most avoidable early mistakes. This article breaks down the three instruments most first-time investors encounter first: shares, bonds, and exchange-traded funds (ETFs). It explains what each one actually is, how each generates returns, and which type of investor each suits best, so readers can make an informed first decision rather than a guessed one.
The single most important distinction between these three instruments is what the investor literally holds.
None of the three is universally superior. Each is a different tool designed for a different job, and the ownership structure determines both how returns are generated and what risks the investor absorbs.
| Instrument | What you own | How returns are generated |
|---|---|---|
| Shares | A fractional stake in a company | Price appreciation and dividends |
| Bonds | A loan contract with fixed terms | Regular coupon (interest) payments and return of principal |
| ETFs | A share of a pooled basket of assets | Price movement of underlying holdings plus distributions |
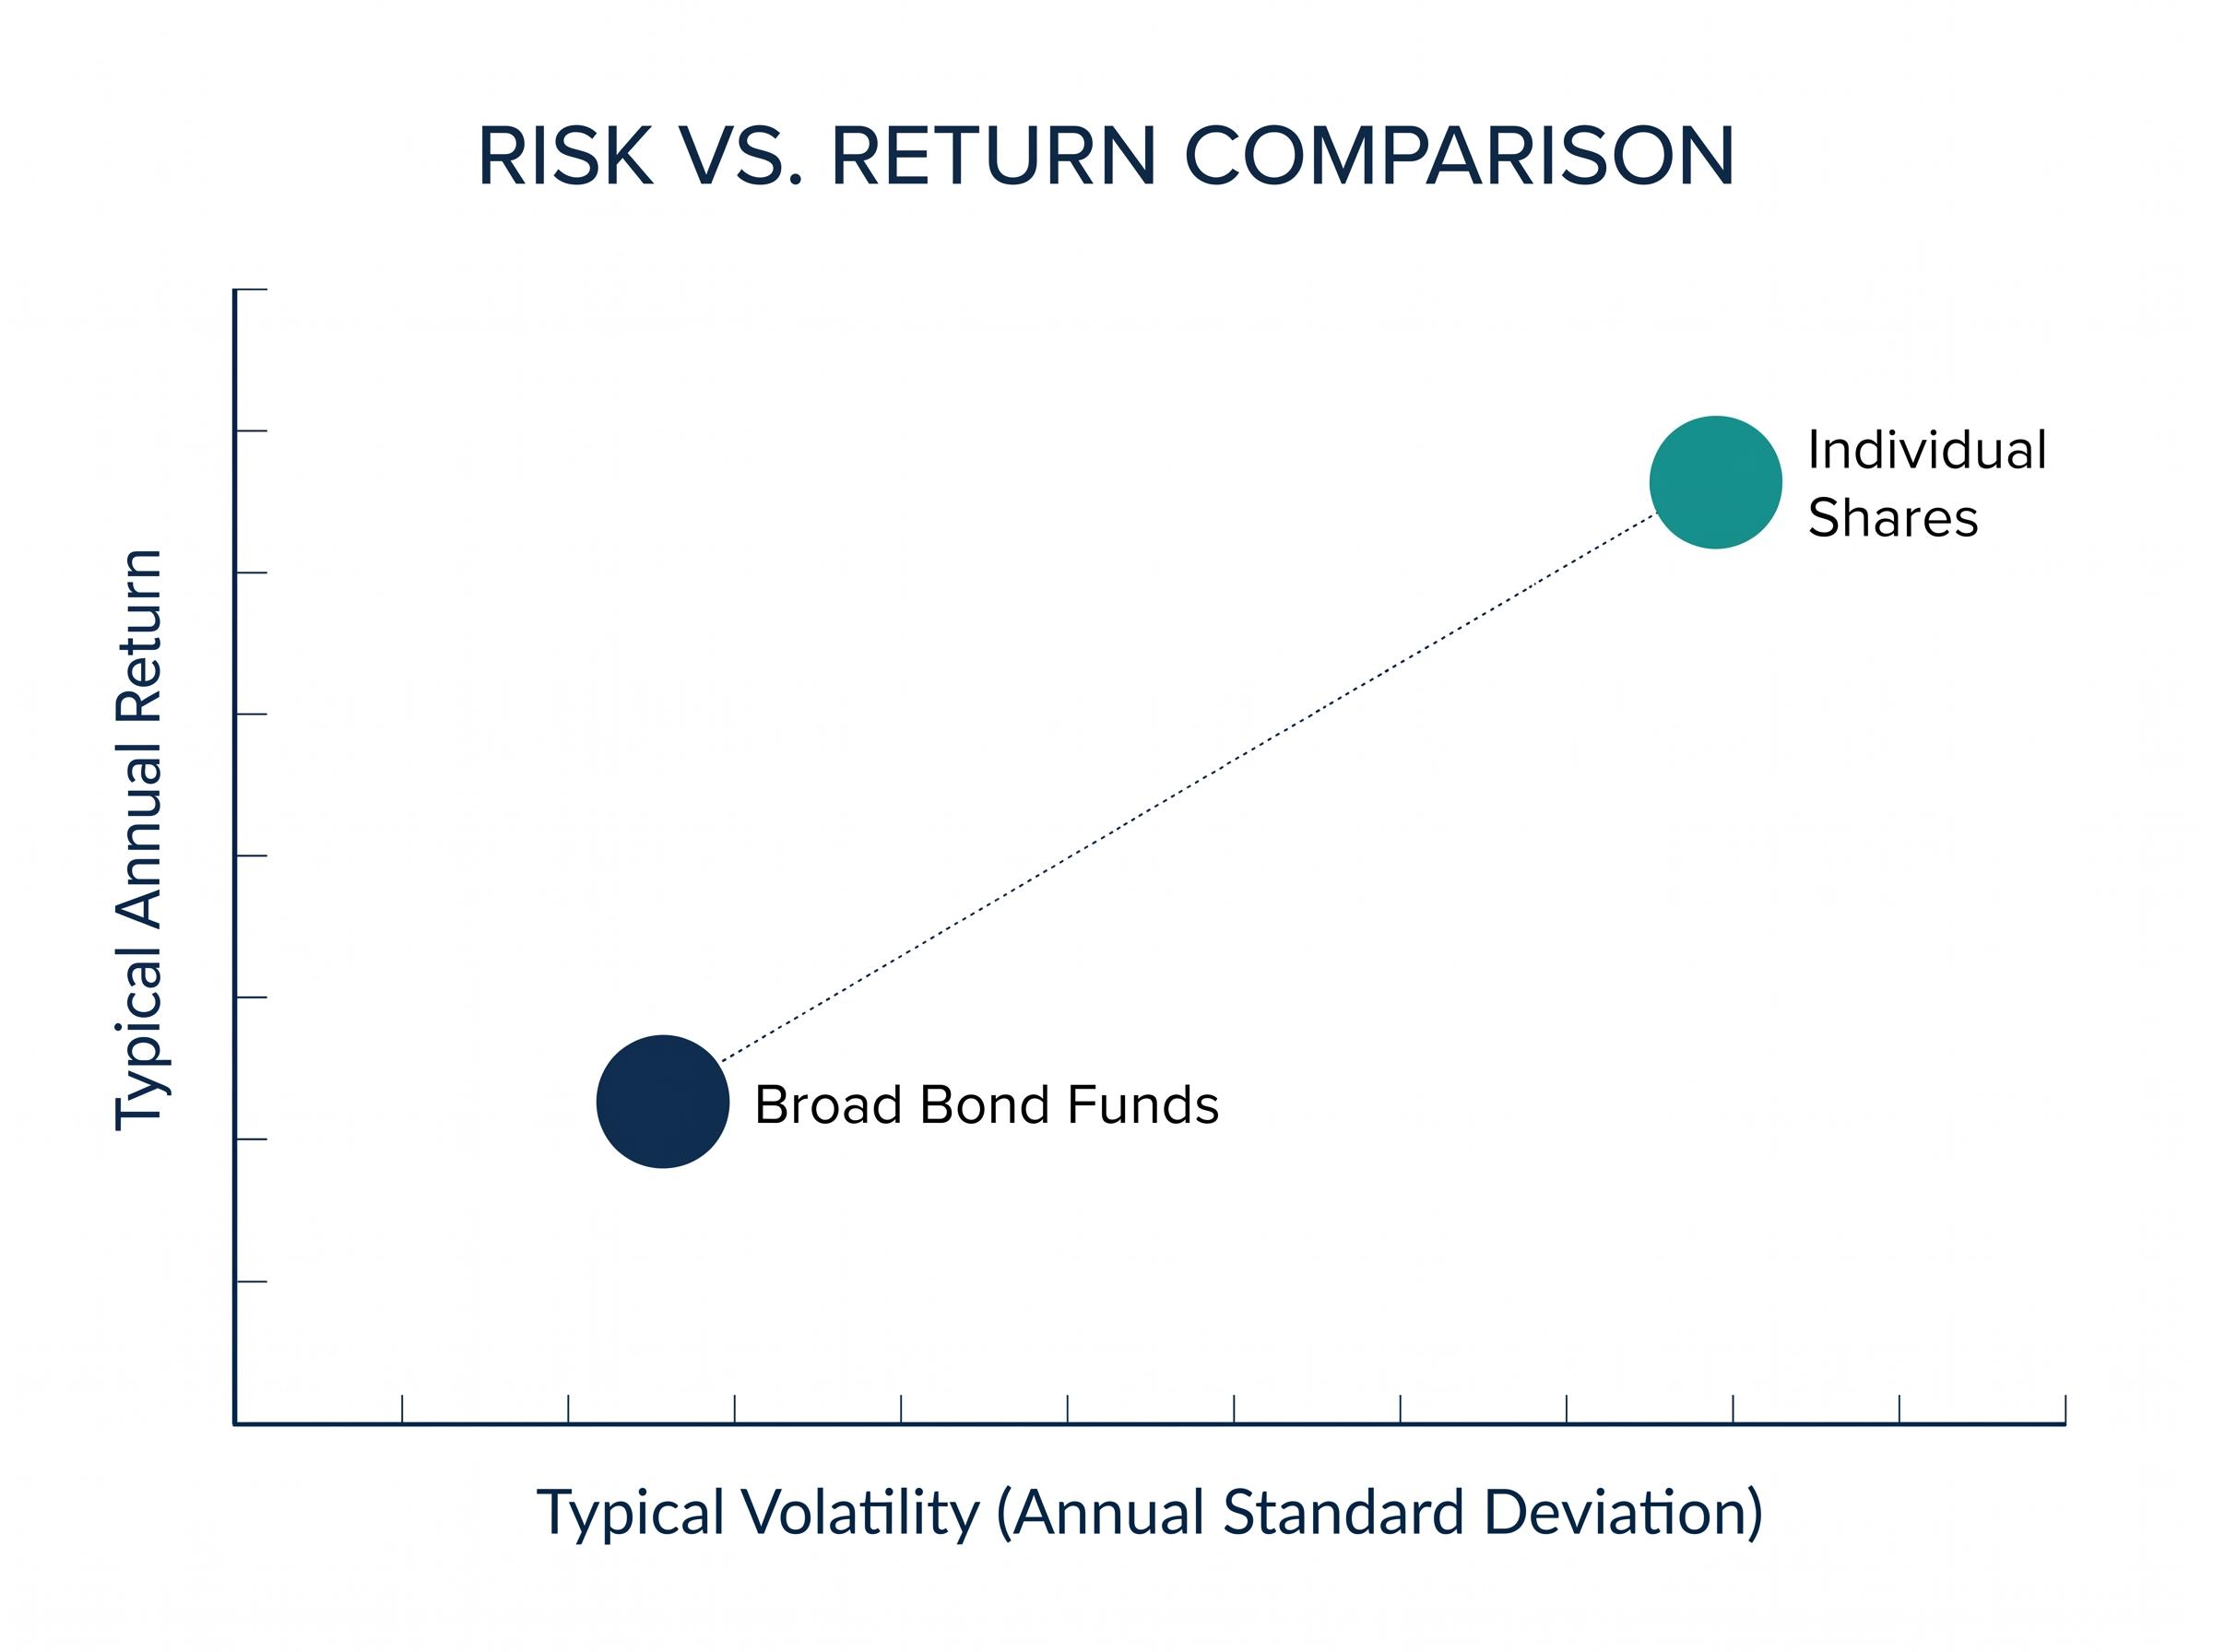
Historically, shares have delivered approximately 7-10% average annual returns globally, accompanied by higher volatility (roughly 15-20% annual standard deviation). Bonds have returned approximately 3-5% with significantly lower volatility (5-10% standard deviation). ETF returns mirror whatever asset class they track: a broad equity ETF tracks share-market-level returns, while a bond ETF tracks fixed income returns. By the end of 2025, global ETF assets under management had reached $20 trillion, according to State Street Global Advisors, establishing ETFs firmly as a mainstream instrument rather than a niche product.
Without understanding what is actually owned, every subsequent decision about risk, fees, and time horizon is built on sand.
Returns arrive through two channels: capital appreciation (the price goes up) and income (the asset pays out cash while it is held). The balance between these two channels differs by instrument, and understanding the difference is what separates informed risk-taking from speculation.
Broad S&P 500 ETFs VOO and VTI returned approximately 17.72-17.82% in 2025, with expense ratios of just 0.03%. Strong single-year returns of this magnitude do not imply equivalent forward expectations.
The second half of the equation, how quickly returns can disappear, is where the instruments diverge most sharply. Individual shares carry annual standard deviation of roughly 15-20%. A 20% drawdown in a single stock requires a 25% recovery just to return to breakeven. Broad bond funds, by contrast, typically exhibit 5-10% annual volatility, and diversified equity ETFs sit in between, absorbing individual company failures within the larger basket.
| Instrument | Typical annual return | Typical volatility (std dev) | Sharpe ratio context |
|---|---|---|---|
| Individual shares | ~7-10% | ~15-20% | Varies widely |
| Broad bond funds | ~3-5% | ~5-10% | ~0.5 (5-year) |
| Broad market equity ETFs (e.g., VOO) | ~7-10% | Moderate | ~0.8-1.0 (5-year) |
The Sharpe ratio, which measures return per unit of risk taken, reinforces the picture. According to Morningstar data, VOO has maintained a five-year Sharpe ratio of approximately 0.8-1.0, compared with roughly 0.5 for broad bond funds. First-time investors often fixate on headline return figures without accounting for the probability of loss. Understanding how returns are built, and how fast they can unravel, is the foundation of sensible risk calibration.
Diversification is not a bonus feature of ETFs. It is the structural reason they exist, and it addresses the two largest disadvantages facing first-time investors: limited capital and limited research capacity.
Concentration risk is the simplest way to understand the problem. Owning five individual shares means a single company’s failure can materially damage the portfolio. If one of those five companies collapses, the portfolio absorbs a 20% loss before any price movement in the remaining four. A broad market ETF spreads that same capital across hundreds or thousands of positions, diluting any single failure to a fraction of a percentage point.
The practical consequence of concentration risk in individual stocks is quantifiable: real 2025 data shows single-stock declines of up to 68.9% wiping out most of a concentrated investor’s capital, while an equivalent decline in a position representing 1% of a broad ETF produced only a 0.69% portfolio drag, a ratio that illustrates why the ownership structure matters as much as the asset selection itself.
The three specific risks that diversification within an ETF directly reduces:
Global ETF inflows reached $643.9 billion year-to-date through early May 2026, according to ETF Database, reflecting the scale of retail and institutional adoption of the ETF structure.
VOO holds approximately 500 US companies across every major sector. Replicating that breadth through direct share purchases at equivalent cost would be impractical for most retail investors. Bond ETFs solve an equivalent problem in fixed income: AGG (iShares Core U.S. Aggregate Bond ETF) provides exposure to thousands of individual bond issues, with $136 billion in assets under management and a 0.03% expense ratio, eliminating both the minimum investment and the research barriers that direct bond purchasing imposes.
Average expense ratios for index equity ETFs stood at 0.14% in 2025, according to the Investment Company Institute, with flagship products like VOO and VTI charging just 0.03%. SGOV (iShares 0-3 Month Treasury Bond ETF), oriented toward capital preservation, held approximately $83.6 billion in AUM with a 0.09% expense ratio and a yield of roughly 3.91-3.94%. These cost structures mean that ETFs are not merely convenient; they are structurally the most accessible route into diversified investing for anyone starting with limited capital.
The ICI 2025 Fact Book confirms that the asset-weighted average expense ratio for index equity ETFs reached 0.14% in 2025, with net share issuance surging to a record $1.5 trillion, underscoring how fee compression and record inflows have combined to make the ETF structure the dominant entry point for retail investors.
Understanding the instruments is half the equation. The other half is knowing which one fits the individual investor’s circumstances. Three variables determine the match:
The right instrument is not the one with the highest recent return. It is the one that matches how the investor will actually behave when markets decline.
The compounding mechanics across decades are less intuitive than most first-time investors expect: the second decade of a compounding investment generates nearly double the dollar gains of the first decade on the same initial capital, which is why uninterrupted time in the market consistently ranks as the single most important variable in long-term wealth building.
| Investor profile | Risk tolerance | Time horizon | Suggested instrument | Example product |
|---|---|---|---|---|
| Capital preserver | Low | Short (0-2 years) | Short-duration bond ETF | SGOV (~3.91-3.94% yield, 0.09% ER) |
| Balanced beginner | Moderate | Medium-long (5+ years) | Broad market equity ETF | VOO or VTI (0.03% ER) |
| Growth-oriented | High | Long (7+ years) | Growth-tilted equity ETF | QQQ (0.20% ER, 20.77% 2025 return) |
| Experienced stock picker | High | Long (7+ years) | Individual shares | Sector-specific selections |
The strategic posture gaining traction in 2026, described by ETF Trends as “boring is beautiful,” specifically favours low-cost index ETFs over thematic or speculative bets for new market entrants. The logic is straightforward: simplicity, low fees, and long-term fundamentals outperform excitement for investors who have not yet experienced a full market cycle.
Fees are not an administrative detail. They are a compounding cost that erodes returns invisibly over time, and the difference between a cheap instrument and an expensive one widens every year.
Three steps to evaluate an ETF’s total cost before purchasing:
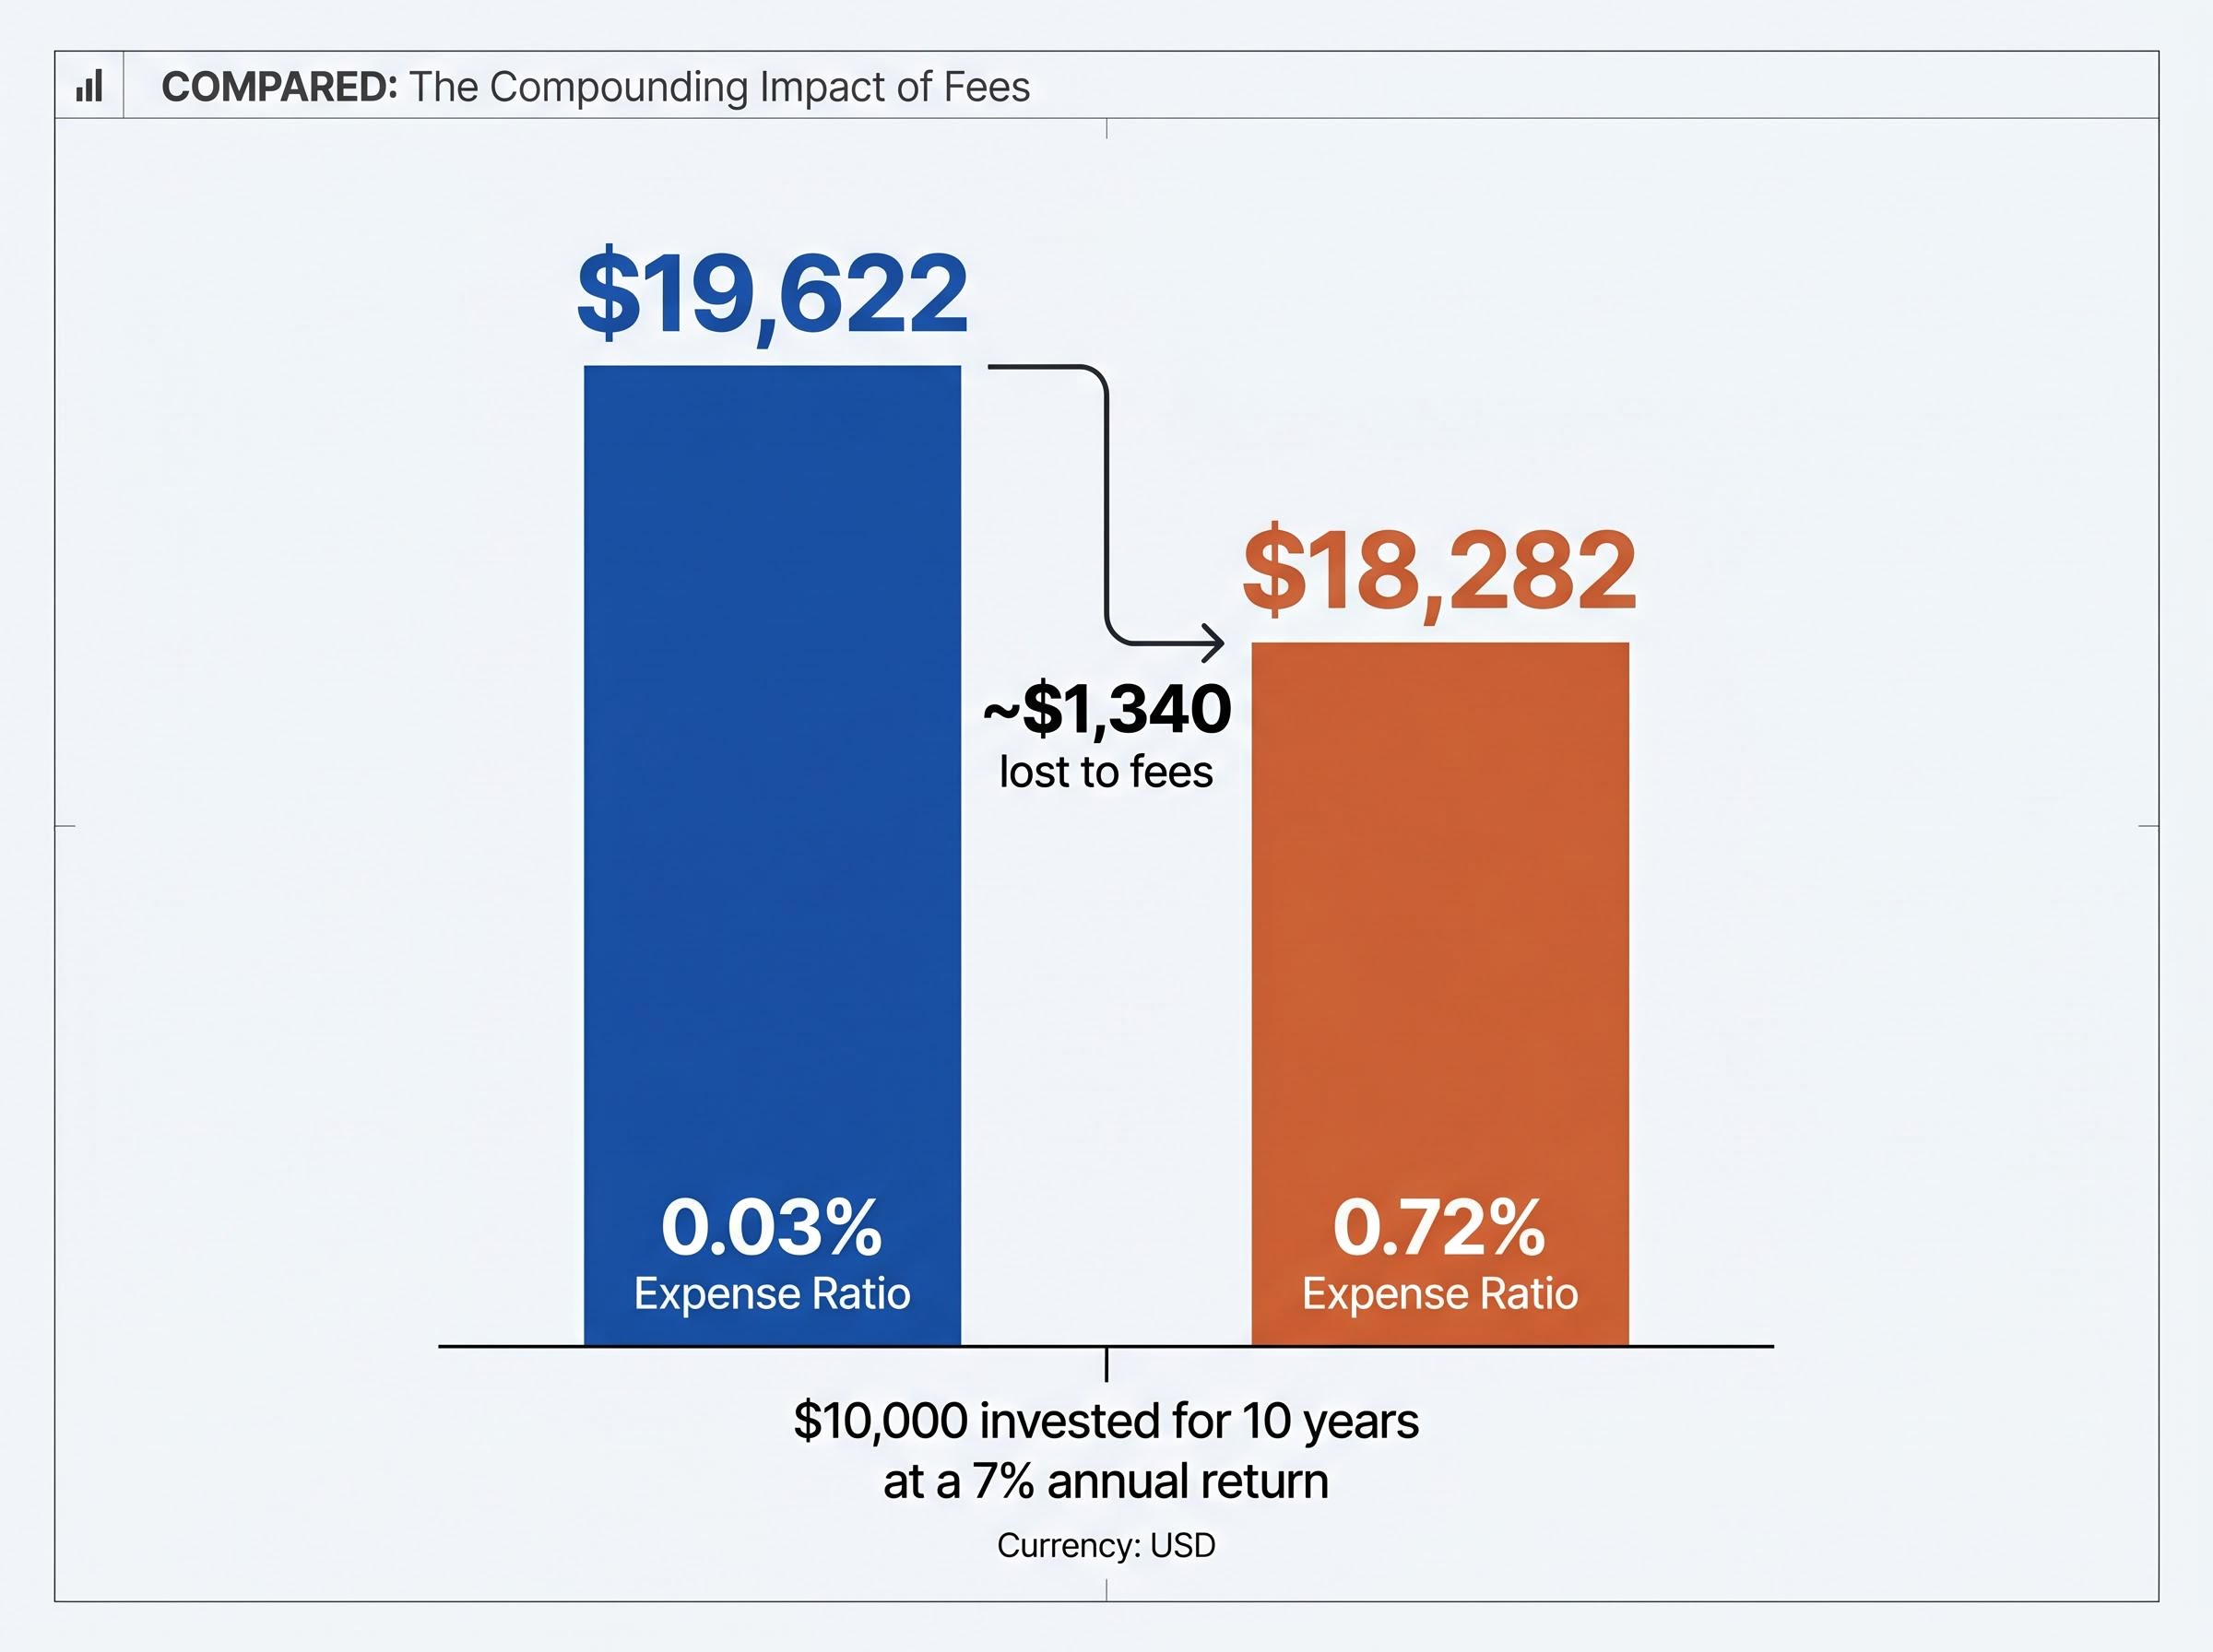
On a $10,000 investment held for 10 years at a 7% annual return, a 0.03% expense ratio leaves approximately $19,622. A 0.72% expense ratio on the same investment leaves approximately $18,282, a difference of roughly $1,340 lost purely to fees. Over longer time horizons and larger sums, fee drag compounds further.
Liquidity varies between instruments. ETFs and shares trade on exchanges throughout the day, allowing investors to buy and sell at market prices during trading hours. Bonds are often less liquid at the retail level, with direct purchases typically requiring meaningful minimum capital and specialist brokerage access. Bond ETFs solve this friction: products like AGG and SGOV wrap diversified fixed income exposure in a structure that trades as easily as a share.
According to data from Natixis Investment Managers, active fixed income ETFs have become cost-competitive with passive alternatives as fee compression narrows the gap, giving retail investors access to professional bond management at historically low cost. ICI data confirms that ETF fees remained near historic lows in 2025, with index bond ETF average expense ratios declining a further 1 basis point.
For investors wanting to apply a structured cost framework beyond the headline expense ratio, our dedicated guide to ETF fee screening walks through how Morningstar’s Price Score benchmarks individual ETF costs against category peers and why a fee difference of less than 1% per annum can compound into a terminal wealth divergence exceeding $575,000 over a 30-year horizon.
Everything covered in this article converges on a practical starting point. For most first-time investors entering in 2026, the default recommendation is straightforward:
A low-cost broad market equity ETF, such as VOO or VTI at 0.03% expense ratio, held for the long term, represents the most commonly recommended starting position. As capital grows, layering in bond ETF exposure (through products like AGG or SGOV) builds portfolio balance. According to State Street Global Advisors, global ETF assets under management reached $20 trillion by the end of 2025, and expense ratios sit at historic lows. The structural conditions for first-time investors have arguably never been better.
The core-and-satellite framework, typically structured as 75% broad index ETFs and 25% individual stock positions, gives investors a principled way to capture diversified market returns while retaining targeted exposure to higher-conviction opportunities as their research capacity and capital base grow.
Individual shares become relevant once an investor has built a diversified base and has the time and inclination to research specific companies. They are a supplement to a portfolio, not a starting point for one.
Thematic ETFs, covering areas such as artificial intelligence, renewable energy, or specific sectors, are appropriate for supplementary allocations rather than core positions. They carry higher expense ratios and greater concentration risk than broad index products. According to Natixis Investment Managers, active fixed income ETFs are growing as an accessible route to professional bond management, but these products similarly suit investors who have already established a diversified foundation.
The ETF Trends 2026 strategic posture applies directly: prioritise simplicity, low fees, and long-term fundamentals. Speculative and thematic products earn their place later, after the fundamentals are in position.
This article is for informational purposes only and should not be considered financial advice. Investors should conduct their own research and consult with financial professionals before making investment decisions. Past performance does not guarantee future results. Financial projections are subject to market conditions and various risk factors.
Shares represent partial ownership of a company, bonds are loan contracts that pay fixed interest, and ETFs are pooled baskets of assets traded on an exchange. Each instrument generates returns differently and carries a distinct risk profile suited to different investor goals.
An expense ratio is the annual management fee charged as a percentage of your investment in an ETF. On a $10,000 investment held for 10 years at 7% annual return, the difference between a 0.03% and a 0.72% expense ratio amounts to roughly $1,340 lost purely to fees, a gap that compounds further over longer time horizons.
For most first-time investors, a low-cost broad market equity ETF such as VOO or VTI at a 0.03% expense ratio is the most commonly recommended starting point, offering built-in diversification across hundreds of companies. Bonds or short-duration bond ETFs suit investors with shorter time horizons or lower risk tolerance, while individual shares are better suited as a supplement once a diversified base is established.
A broad market ETF spreads capital across hundreds or thousands of positions, so a single company's collapse produces only a fraction-of-a-percentage-point drag on the portfolio. By contrast, owning five individual shares means one company failure can immediately wipe out 20% of the portfolio's value.
Broad S&P 500 ETFs VOO and VTI returned approximately 17.72-17.82% in 2025, with expense ratios of just 0.03%. The article notes that strong single-year returns of this magnitude do not imply equivalent forward expectations.