Global ETF assets crossed $19.44 trillion in 2025, yet millions of investors still wrestle with a deceptively simple question: should they be picking individual stocks instead? Both instruments trade on exchanges, both can compound wealth over decades, and both belong in the vocabulary of any serious investor. The difference lies in what each one actually does inside a portfolio, and choosing the wrong tool for the job carries quantifiable costs.
The decision is not abstract. Expense ratios compound over decades and quietly erode returns. Capital gains tax treatment shapes the net figure that actually lands in an investor’s account. Concentration risk in individual stocks can erase years of gains in a matter of weeks. The question is not which vehicle is universally superior but which one belongs in a specific investor’s portfolio, given their goals, time horizon, and tolerance for volatility.
By the end of this guide, readers will have a clear framework for evaluating stocks versus ETFs across costs, taxes, risk, and personal circumstances, including a ready-to-use model for combining both.
What you actually own when you buy a stock or an ETF
A share of stock is a fractional ownership stake in a single company. The holder participates directly in that company’s fortunes: its revenue growth, its earnings misses, its dividend decisions, and its shareholder votes. That directness is the point. It is also the risk.
An ETF (exchange-traded fund) is a pooled investment vehicle holding a basket of assets. One share purchases proportional exposure to every underlying holding simultaneously, spreading risk across the entire basket rather than concentrating it in a single name.
One ETF share, 500 companies. A single share of an S&P 500 ETF grants simultaneous exposure to 500 of the largest US-listed companies, offering immediate diversification that would require hundreds of individual transactions to replicate through direct stock purchases.
The structural differences extend beyond diversification:
- Ownership type: Stocks confer direct ownership and voting rights in a single company. ETF shareholders generally do not hold voting rights over underlying companies.
- Diversification: A single stock concentrates risk in one entity. An ETF distributes it across dozens, hundreds, or thousands of holdings.
- Management approach: Over 85% of ETF assets under management as of 2025 are passively managed, designed to replicate benchmark performance rather than beat it.
- Transparency: Most ETFs disclose holdings daily. Mutual funds, by comparison, typically disclose quarterly.
Understanding what each instrument actually represents is the foundation for every cost, tax, and strategy decision that follows. Investors who skip this step often misattribute ETF performance or tax outcomes to the wrong cause.
When big ASX news breaks, our subscribers know first
The real cost of each instrument, beyond the headline price
Most investors already know that major brokers now offer commission-free trading on US-listed equities. That headline cost of zero obscures the real question: what does each instrument cost to hold over time?
Individual stocks carry no ongoing management fee. Once purchased, they sit in a portfolio without any annual charge deducted from their value. ETFs, by contrast, carry an expense ratio, a small annual percentage automatically deducted from fund assets. The fee is invisible on any given day. Over decades, it compounds into a meaningful drag on returns.
| Vehicle | Average Expense Ratio | Typical Use Case |
|---|---|---|
| Index equity ETF (industry avg.) | 0.14% | Broad market exposure |
| Vanguard ETFs (avg.) | 0.07% | Low-cost passive indexing |
| iShares core index products | 0.15-0.20% | Core portfolio building blocks |
| Actively managed ETFs | 0.60-0.75% | Active strategy within ETF structure |
| Mutual funds (avg.) | 0.44% | Traditional managed funds |
| Individual stocks | 0.00% | Direct company ownership |
The gap between index ETFs and mutual funds remains wide. The gap between index ETFs and individual stocks is narrower but still real, and it compounds. Here is how a 0.14% expense ratio plays out on a $100,000 investment growing at 8% annually:
- After 10 years: The fee drag reduces the portfolio by approximately $2,000 compared to a zero-fee equivalent.
- After 20 years: The cumulative drag grows to roughly $7,000 in foregone wealth.
- After 30 years: The compounding effect pushes total foregone wealth past $16,000, all from a fee that appears negligible in any single year.
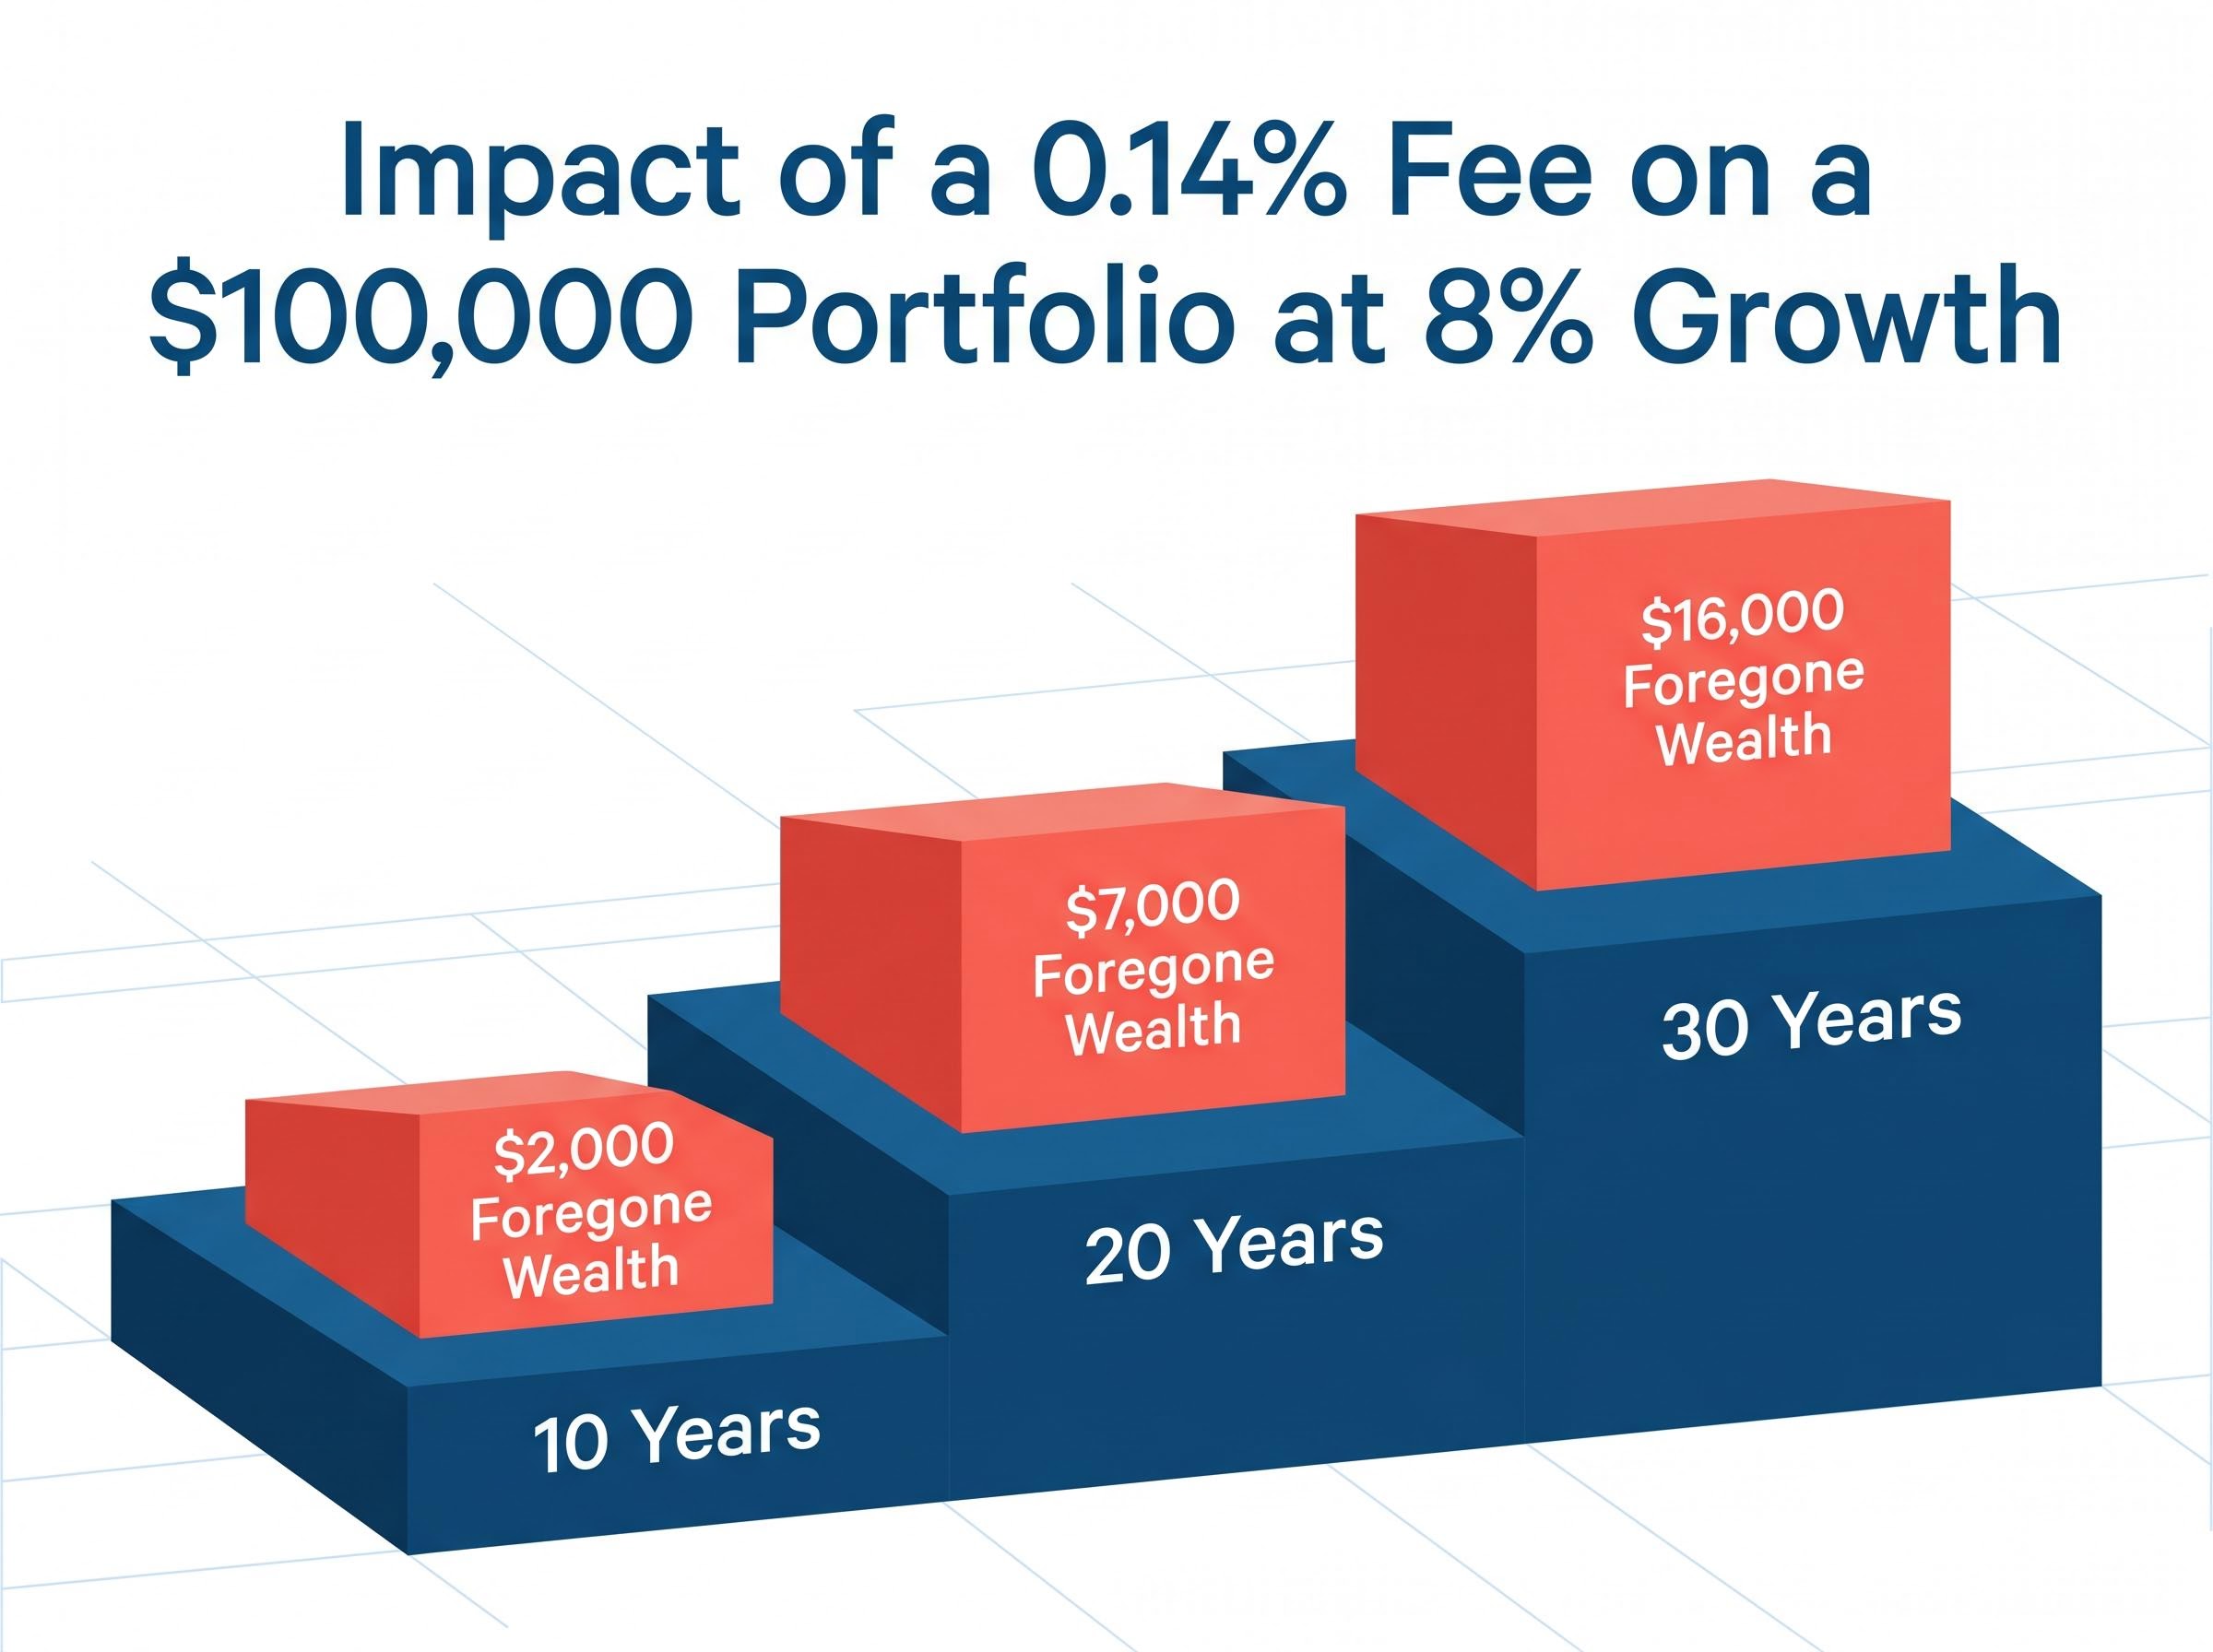
Investors who treat expense ratios as rounding errors are making a quantifiable mistake. A 0.14% fee is low by any historical standard, but it is not zero, and over an investing lifetime the difference is real.
The expense ratio compounding examples in this article assume an 8% annual growth rate, a figure consistent with the historical record: long-term investment strategies built around low-cost index exposure have delivered approximately 9.43% annualised over 150 years of S&P 500 data, which is the baseline against which any fee drag should be measured.
How taxes treat stocks and ETFs (and where the ETF advantage is often misunderstood)
A common belief among retail investors is that ETFs carry an inherent tax advantage over individual stocks. This is not accurate. Under US tax rules, ETFs and stocks receive identical capital gains tax treatment.
| Holding Period | US Tax Rate | Applies To |
|---|---|---|
| Short-term (one year or less) | Ordinary income rates, up to 37% | Stocks and ETFs equally |
| Long-term (more than one year) | 0%, 15%, or 20% depending on income | Stocks and ETFs equally |
| NIIT surcharge | Additional 3.8% (above $200,000 single / $250,000 joint) | Stocks and ETFs equally |
Dividend taxation is similarly equivalent. Qualified dividends are taxed at long-term capital gains rates for both ETFs and individual stocks.
IRS Topic 409 on capital gains confirms that long-term rates of 0%, 15%, or 20% apply equally to gains realised on individual stocks and ETF shares, with the applicable rate determined by the taxpayer’s taxable income for the year.
Where ETFs do hold a genuine structural tax advantage is over mutual funds, not stocks. The in-kind creation and redemption mechanism allows ETF providers to rebalance portfolios without triggering taxable events at the fund level. The practical effect is significant.
In 2025, only 2% of ETFs distributed capital gains exceeding 1% of net asset value. Mutual funds, by contrast, routinely distribute capital gains to shareholders, creating taxable events even for investors who did not sell.
This distinction matters. Investors who structure their portfolios around a belief that ETFs deliver automatic tax savings over direct stock ownership may be operating on a misconception. The accurate comparison is ETFs versus mutual funds, and on that front the ETF advantage is well documented.
Tax treatment varies materially by jurisdiction. In the UK, for example, capital gains tax rates as of 2026 range from 10% to 20% depending on the taxpayer’s rate band, with separate dividend allowances. Non-US investors should consult jurisdiction-specific guidance before drawing conclusions from US tax frameworks.
Risk, return, and what diversification actually costs you
Diversification is often presented as an unqualified benefit. It is more accurately described as a trade-off, and quantifying both sides of that trade-off helps investors make an honest assessment of which risk profile fits their circumstances.
Broad index ETFs carry meaningfully lower volatility than concentrated stock portfolios. A broad index ETF showed an approximate standard deviation of 15% in 2025, compared with roughly 25% for a concentrated individual stock portfolio. That gap represents the diversification benefit in action: spreading exposure across hundreds of holdings dampens the impact of any single company’s adverse event.
The cost of that protection is capped upside. In a diversified basket, no single holding can dominate returns. The S&P 500 returned approximately 17.4% in 2025, tracked by broad index ETFs such as VOO. Global ex-US world stock ETFs gained approximately 20% over the same period.
The diversification benefit of broad index ETFs carries a caveat that most passive investors overlook: index fund concentration risk has reached historic extremes, with five mega-cap stocks controlling approximately 23% of the broad US market index as of mid-2026, meaning a single-sector shock can still inflict outsized damage on a supposedly diversified portfolio.
Individual stock returns varied far more widely. High-profile outperformers such as NVIDIA delivered substantial gains, but many individual stocks underperformed the index by a considerable margin. That dispersion is concentration risk in its purest form.
- Concentration risk vs. capped upside: Individual stocks offer unlimited upside on a single position but carry the full weight of company-specific failure. ETFs average returns across the basket, capping both extremes.
- Lower volatility vs. averaged returns: A 15% standard deviation provides a smoother ride than 25%, but the smoother ride comes at the cost of muted outperformance potential.
- Full company transparency vs. basket exposure: Stock investors know exactly what they own and why. ETF investors own a basket selected by an index methodology or fund manager.
Passive index ETFs outperformed approximately 80% of active funds in 2025 on a net-of-fees basis.
That figure quantifies the difficulty of sustained stock-picking alpha. The index itself was a high bar in 2025, and most active approaches did not clear it.
Active stock-picking and where it can still make sense
Individual stock selection becomes more defensible in less efficient market segments, where information advantages are more achievable. Investors with genuine sector expertise or access to differentiated research may identify mispriced opportunities that a passive index cannot capture.
Even in these cases, position sizing and risk management discipline remain critical. A concentrated conviction position can generate outsized returns, but it can also inflict outsized damage on a portfolio if the thesis proves wrong.
Matching the right instrument to your investor profile
The preceding sections covered costs, taxes, and risk in the abstract. The practical question is which instrument, or combination of instruments, fits a specific investor’s circumstances. Three variables drive that decision: time available for research, risk tolerance, and investment goal horizon.
Jonathan Swanburg, a certified financial planner, described ETFs as “the golden child” for beginning investors in July 2025, citing their liquidity, low fees, and built-in diversification, according to USA Today. That assessment applies to several investor profiles:
- Beginners and passive investors: ETFs provide immediate market exposure without requiring company-level research. Low expense ratios and built-in diversification reduce the probability of catastrophic single-position losses.
- Time-constrained professionals: Investors who lack the hours for ongoing stock analysis benefit from the “set and rebalance” nature of an ETF-centric portfolio.
- Experienced investors with sector expertise: Individual stocks may add value for investors who have a genuine informational advantage in specific industries and are willing to actively monitor concentrated positions.
The core-and-satellite framework resolves the binary framing for investors who see merit in both instruments.
The core-and-satellite approach in practice
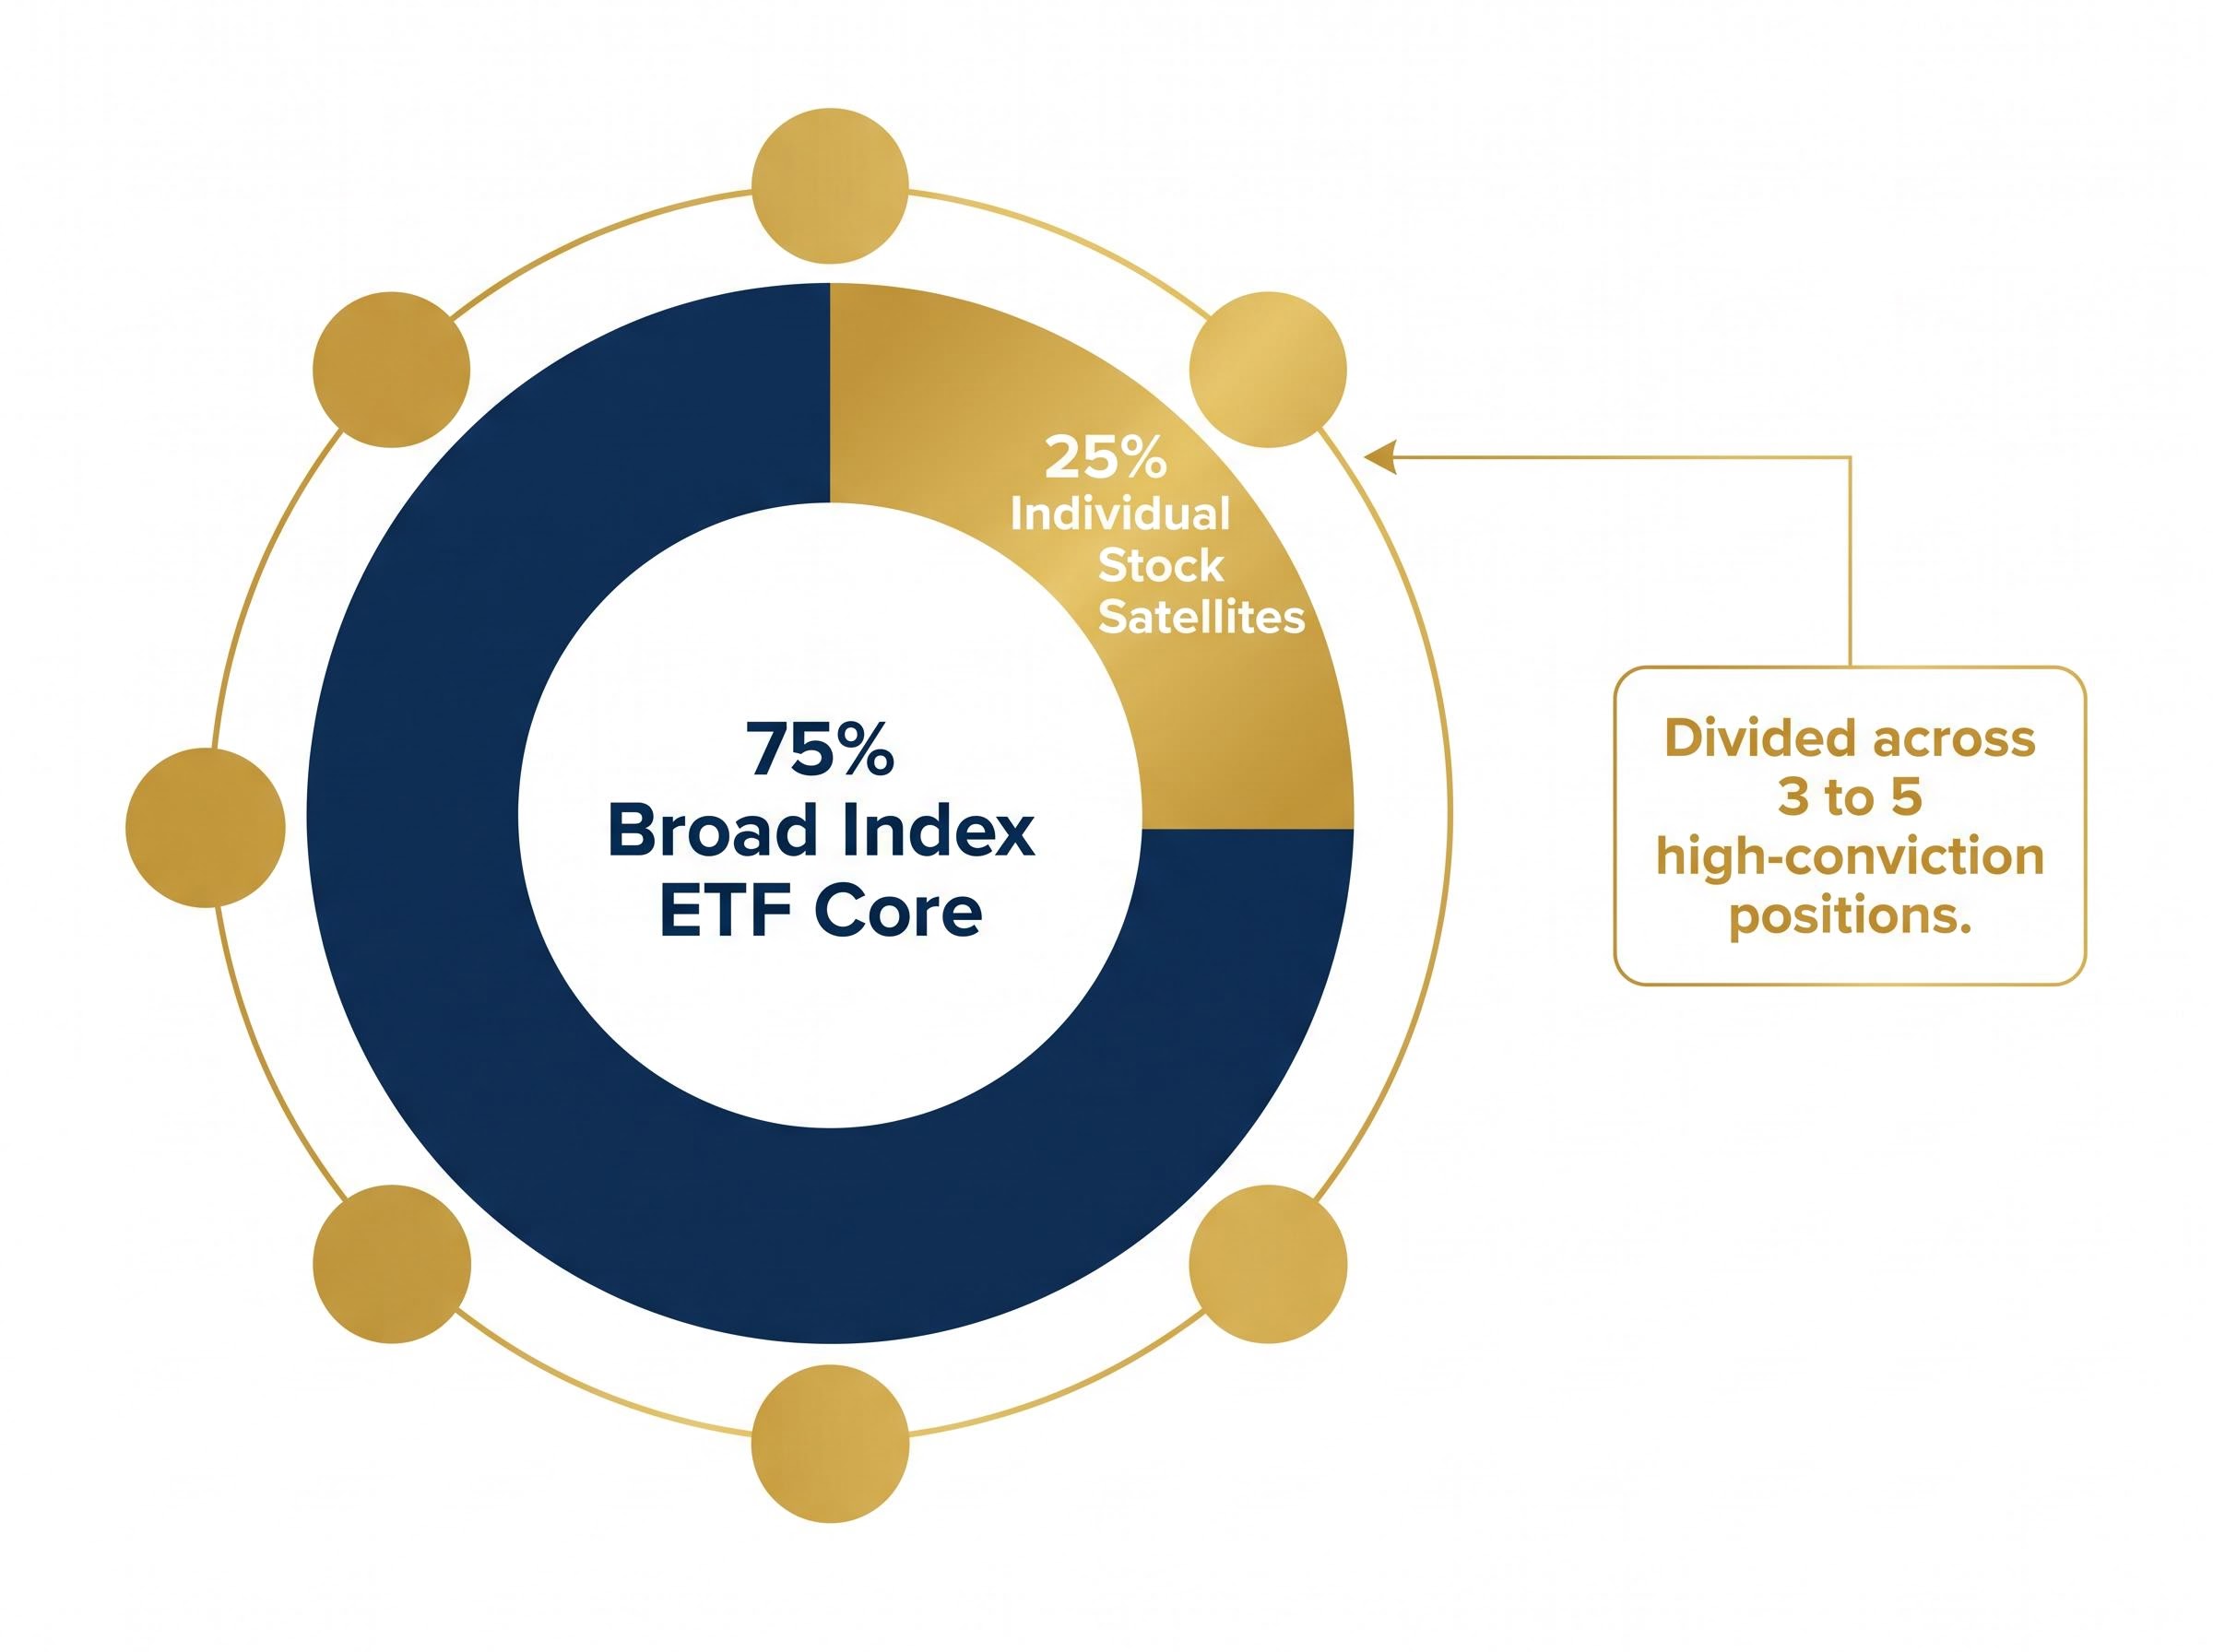
The core-and-satellite model uses ETFs as the portfolio core, typically representing 70-80% of holdings, providing broad, low-cost market exposure. Individual stocks serve as satellite positions for conviction bets, thematic expression, or alpha generation.
A hypothetical allocation might place 75% in a broad index ETF core and 25% across three to five high-conviction individual stock positions. The core delivers diversified market returns while the satellites offer personalised exposure to specific opportunities.
Satellite positions require active monitoring. They should be sized so that even a total loss in a single satellite does not materially impair the broader portfolio’s trajectory.
The choice is a framework, not a formula
The stocks versus ETFs decision rests on four factors: cost (expense ratios versus zero ongoing management fees), tax accuracy (the ETF structural advantage applies to mutual funds, not individual stocks), risk tolerance (diversification protects but also caps upside), and investor profile (time, expertise, and goal horizon).
For most investors, the hybrid core-and-satellite approach resolves the debate. ETFs deliver the base of diversified, low-cost market exposure. Individual stocks, sized appropriately, provide the satellite positions for conviction and personalisation.
Global ETF assets under management reached $19.44 trillion by end-2025, up 31% year-on-year. Active ETF assets crossed $1 trillion for the first time in the same year. The product landscape continues to expand, meaning the evaluation framework in this guide will remain applicable regardless of which instruments an investor ultimately selects.
A practical next step for readers reviewing their current holdings:
For investors who have settled on an ETF-core allocation, the next consequential decision is how to deploy capital: dollar-cost averaging spreads purchase price risk across time and reduces behavioural drag, though the historical data shows lump-sum investing outperforms it in roughly 68-73% of periods when capital is available upfront.
- Assess available time for ongoing research and position monitoring.
- Calculate the total expense ratio drag across current holdings.
- Clarify investment time horizon: short-term income needs versus long-term wealth accumulation.
- Decide on a core-satellite allocation that reflects both risk tolerance and personal conviction.
This article is for informational purposes only and should not be considered financial advice. Investors should conduct their own research and consult with financial professionals before making investment decisions. Past performance does not guarantee future results.