Why Governance and Communication Drive Post-IPO Value
8 hrs ago
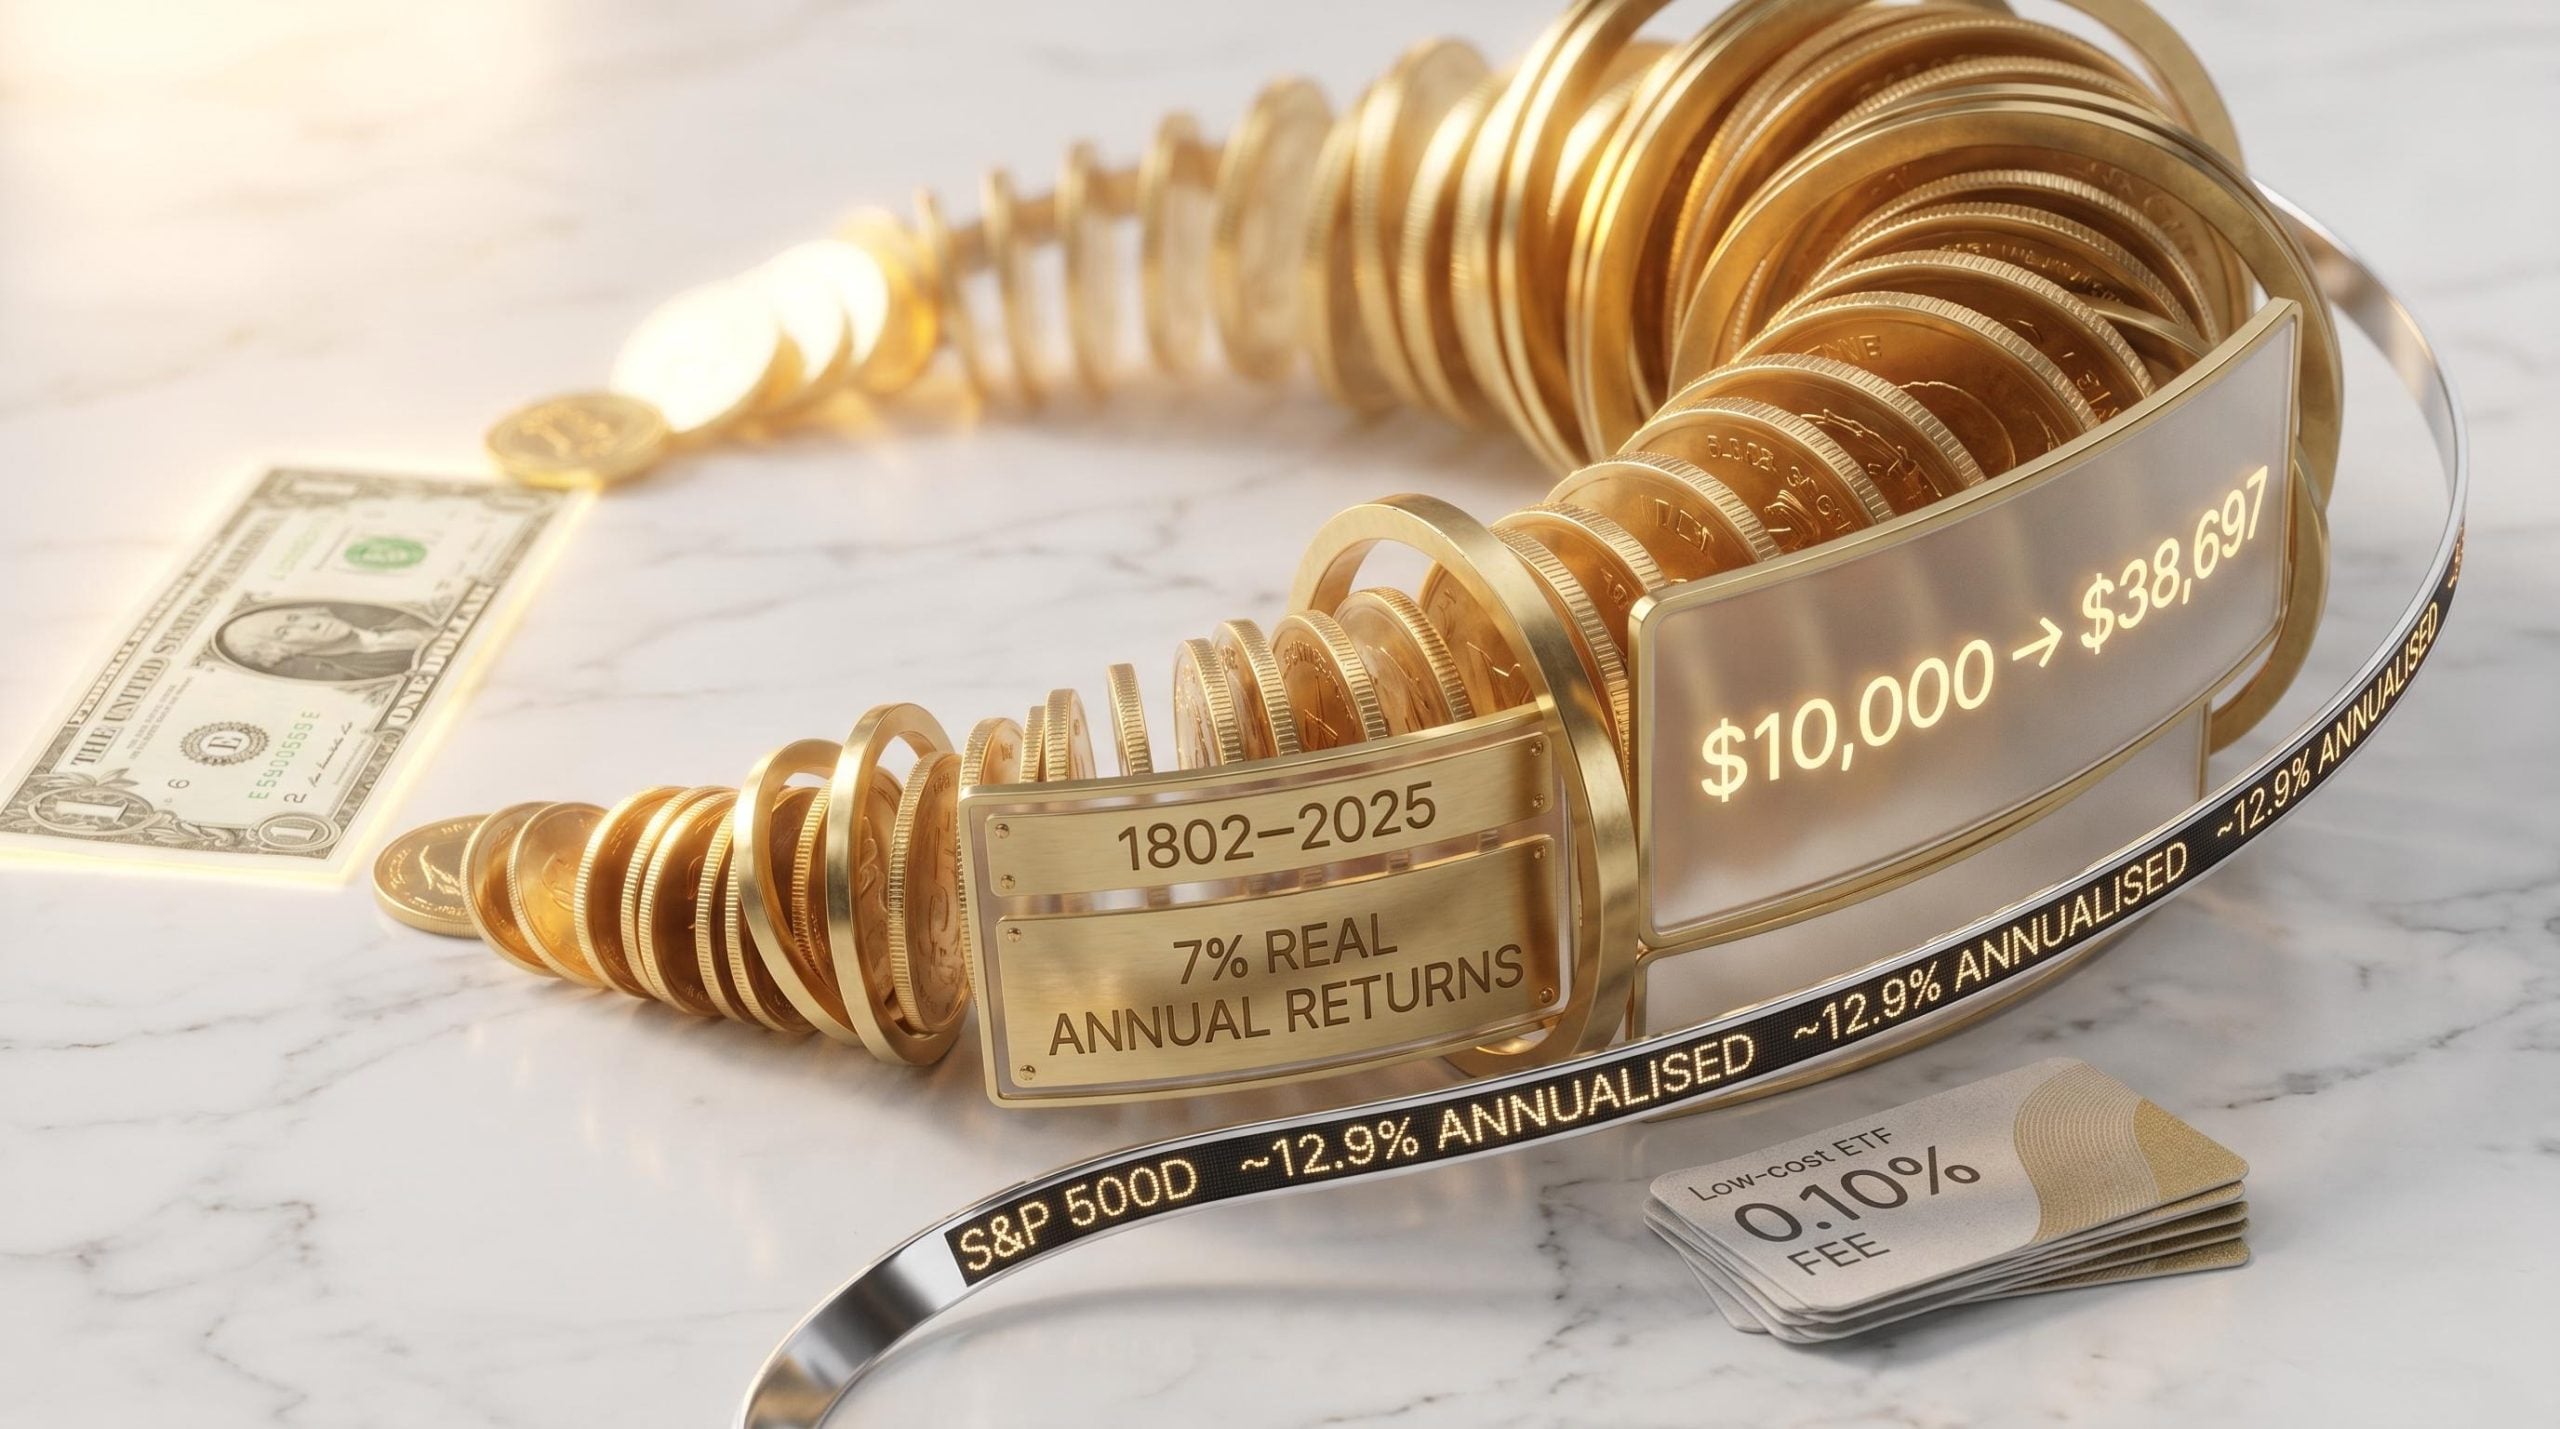
A single dollar invested in diversified equities in 1802 would have compounded into a sum that dwarfs any comparable allocation to bonds, gold, or cash by 2025, with approximately 7% real annual returns sustained across more than two centuries of data. The figure is striking, but the mechanism behind it is what matters. Most investors understand that long-term investing works. Far fewer understand the specific mechanics, asset selection principles, and structural decisions that determine whether a 20-year portfolio compounds efficiently or leaks value through poor allocation, mistimed deployment, or unnecessary tax drag.
This guide unpacks the core mechanics of long-term wealth accumulation: how equities, ETFs, and property compound over 10-20 year horizons, why reinvestment and deployment discipline matter more than most investors realise, and how tax-efficient structures amplify every percentage point of return. Six strategic pillars, each backed by verified data, form a sequential framework that any investor can map to their own situation.
Compounding is not linear growth. It is exponential growth, and the distinction is not semantic. In a simple-return scenario, a $10,000 investment earning 7% annually generates $700 each year, the same dollar amount in year one as in year twenty. In a compound-return scenario, that $700 is reinvested and itself begins earning 7%, meaning the base on which future returns are calculated grows every year.
The result is a growth curve that feels sluggish early and then steepens dramatically in the back half of the holding period.
According to WisdomTree’s synthesis of data spanning 1802 to April 2025, diversified equities have delivered approximately 7% real annual returns, with positive real returns in every rolling 20-year period on record.
Jeremy Siegel’s long-run equity return research places the real annualised return from US equities since 1802 at approximately 6.7%, a figure that has remained remarkably stable across wars, depressions, and technological disruptions, reinforcing the structural case for equities as the primary compounding vehicle over multi-decade horizons.
The S&P 500 delivered approximately 12.9% annualised total return over the 10 years ending December 2025. That figure is not a promise about the next decade, but it illustrates the compounding capacity of equities when measured over meaningful timeframes.
Consider $10,000 compounding at 7% real annually. After 10 years, the investment grows to roughly $19,672, a gain of approximately $9,672. Over the following 10 years (years 11-20), it grows from $19,672 to roughly $38,697, a gain of approximately $19,025. The second decade produced nearly double the dollar gain of the first, on the same initial capital with the same annual return rate.
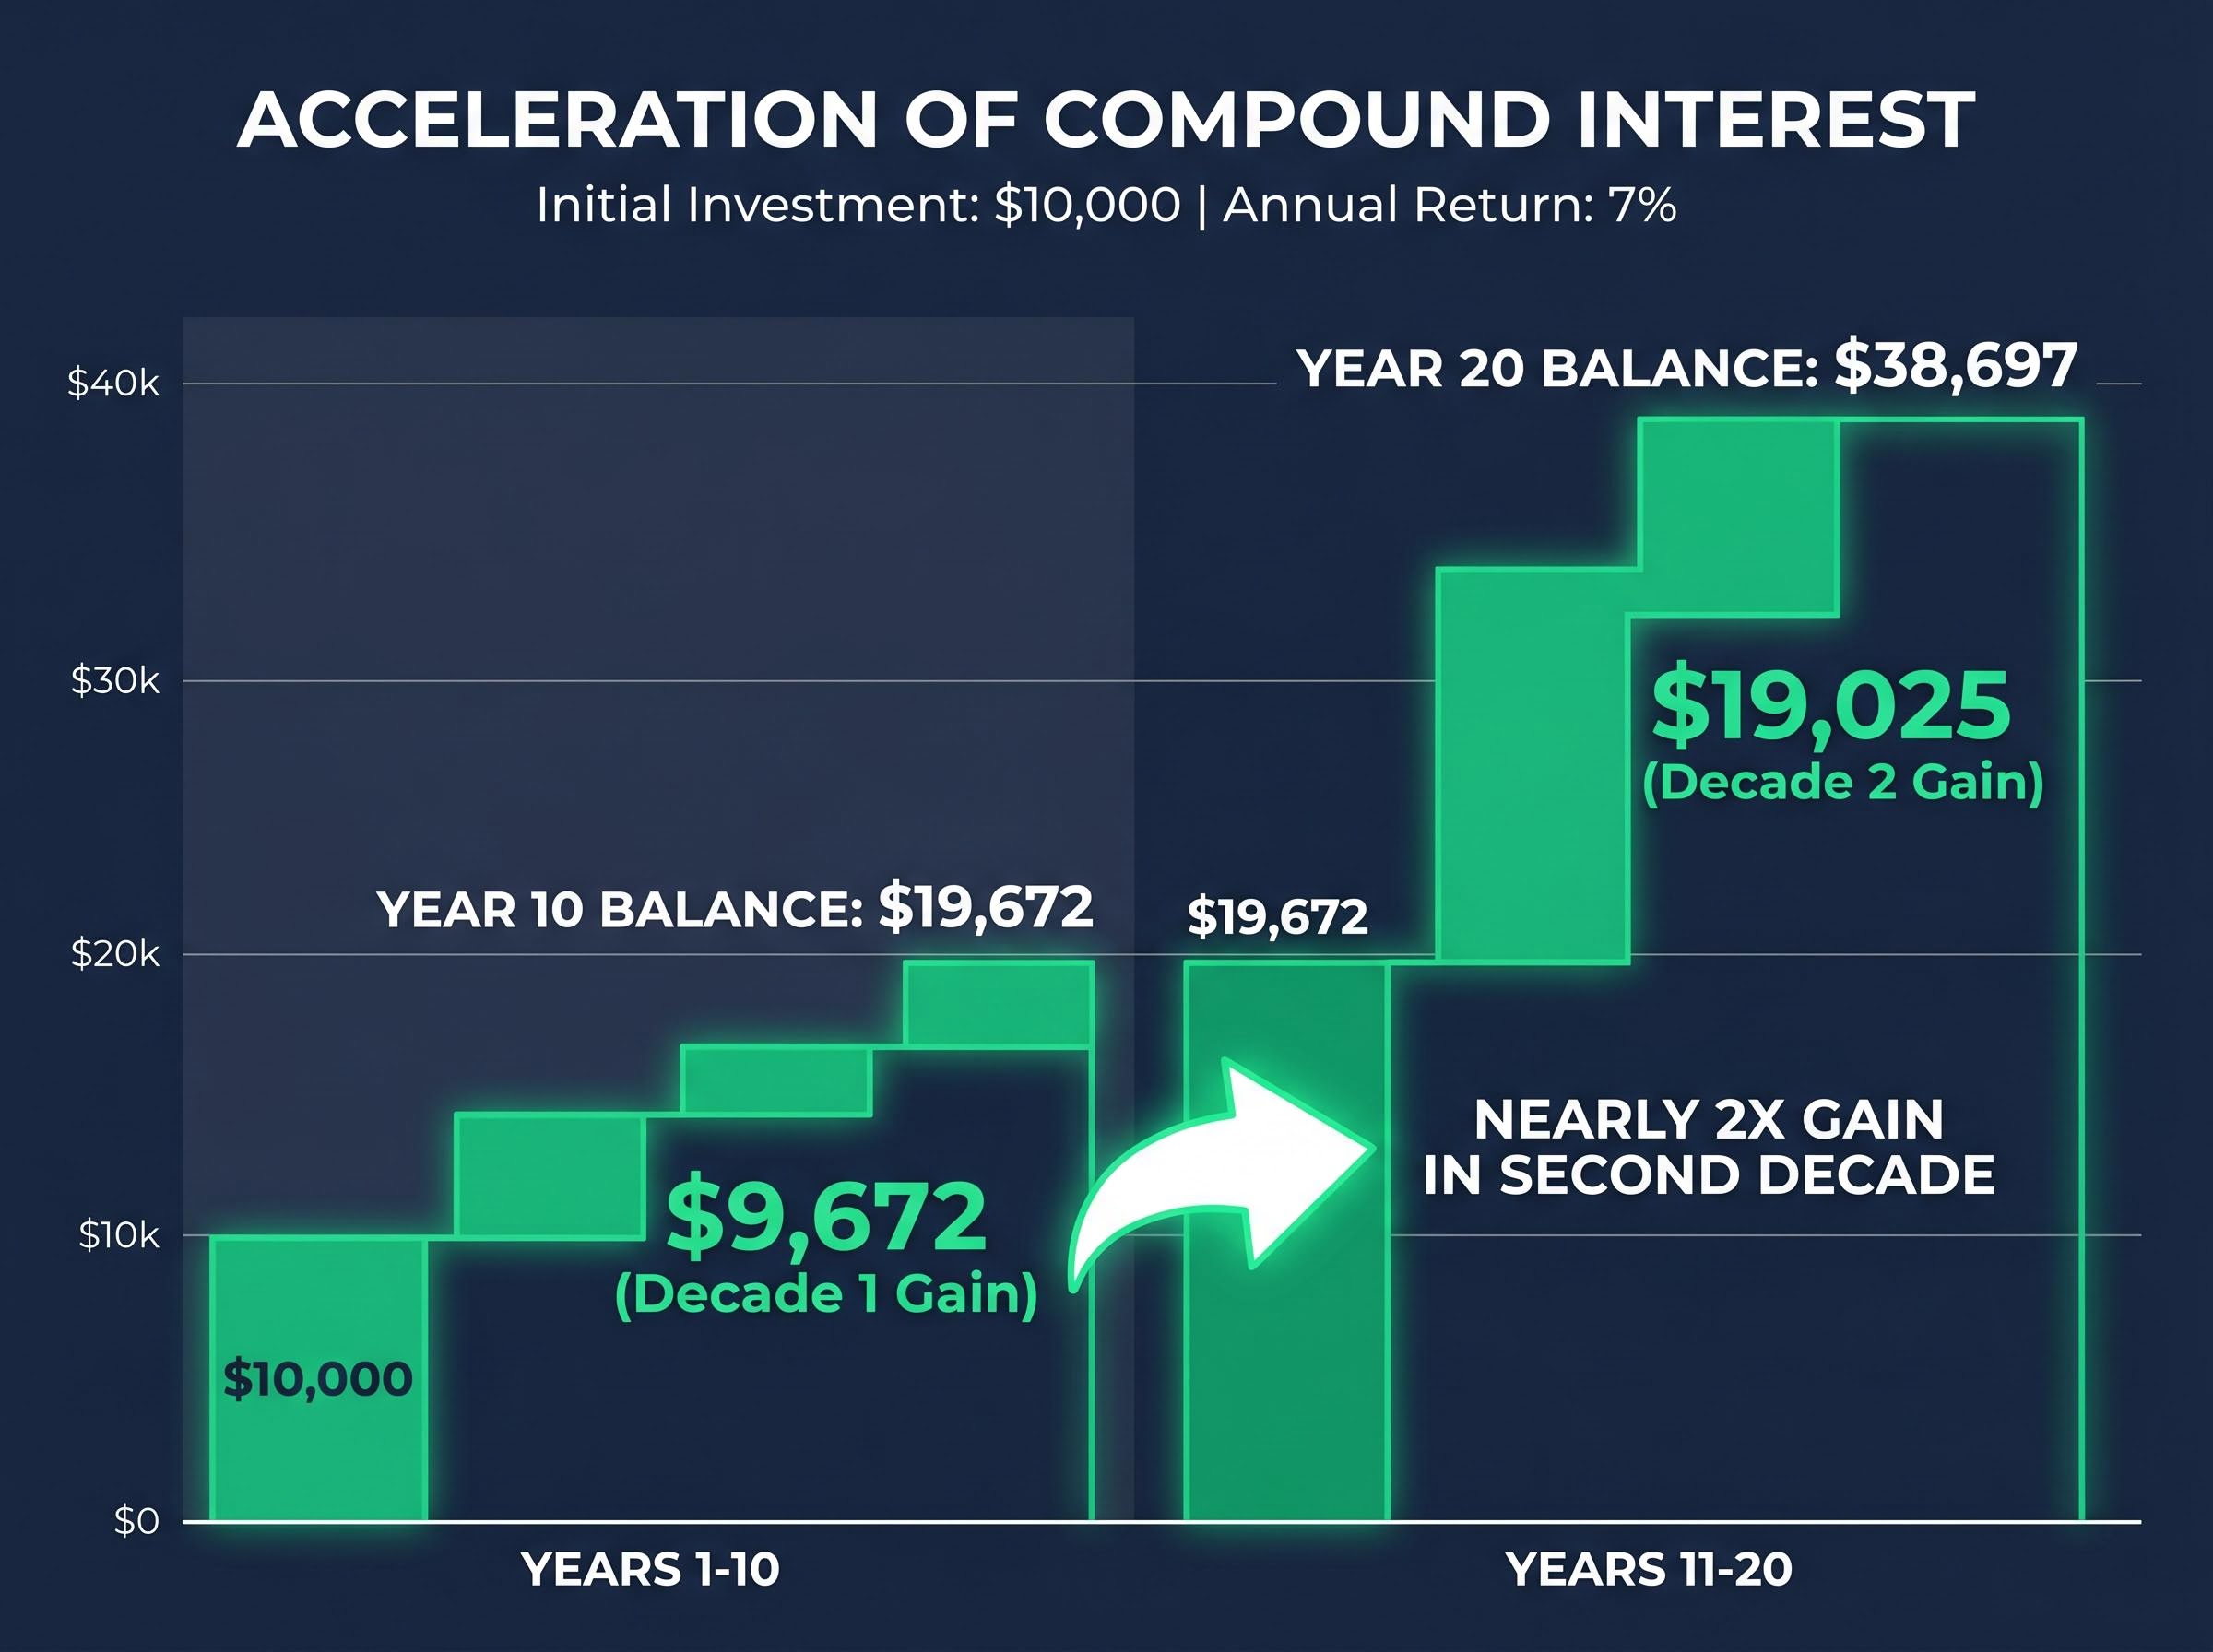
This back-weighted acceleration is the single strongest argument for starting early and staying invested. Investors who grasp it stop treating short-term volatility as a reason to pause and start treating time in market as the irreplaceable ingredient.
The structural case for equities rests on one of the most consistently documented relationships in finance: risk and return over time move together, and investors who reduce volatility exposure in the early years of a long horizon also reduce the compounding base that does the heaviest lifting in the final decade.
The compounding engine in equities is structural, not incidental. Three mechanisms drive it:
These mechanisms are absent or structurally limited in bonds (fixed coupon), gold (no yield), and cash (no growth participation). That structural difference explains why equities have outperformed every major asset class over every sufficiently long period on record.
The return differential between asset classes over the past decade is not a matter of interpretation. The data reaches its own verdict.
| Asset Class | Approximate 10-Year Annualised Return | Key Compounding Driver |
|---|---|---|
| US Equities (S&P 500) | ~12.9% | Earnings growth, reinvested dividends, innovation |
| Commodities | ~6% | Supply/demand cycles, inflation hedging |
| Australian Residential Property | ~5.2% | Rental yield, capital appreciation |
| UK Residential Property | ~4.5% | Rental yield, capital appreciation |
| European Residential Property | ~3.8% | Rental yield, capital appreciation |
Between Q2 2024 and Q2 2025, US household equity holdings grew by $5.5 trillion while real estate holdings increased by $1.3 trillion, a ratio of approximately 4.2:1. That divergence is not a single-year anomaly. It reflects the structural compounding advantage equities hold over property across extended periods.
Property does, however, offer features equities cannot replicate:
For some investors, these features offset the return gap. The decision is not irrational, but it should be made with full awareness of the data rather than the assumption that property and equities compete on equal terms.
Three specific problems destroy long-term returns in equity portfolios. Broad-market ETFs solve all three simultaneously.
Over the 10 years ending December 2025, the S&P 500 delivered approximately 12.9% annualised total return, a figure that broadly proxies the performance of a low-cost US large-cap ETF tracking the same index. For non-US exposure, Vanguard Global Equity ETF reports provide comparable benchmarks, though global funds generally lagged US-only funds over the past decade.
Citi’s 2025 wealth outlook advised broadening portfolios beyond concentrated positions, a recommendation that aligns with the structural case for diversified index exposure over single-name concentration.
One of the most consequential structural choices for ETF investors is the distinction between total-return ETFs, which automatically reinvest dividends back into the fund, and distributing ETFs, which pay dividends to the investor as cash. Total-return ETFs automate the compounding decision. Distributing ETFs require the investor to manually reinvest, and many do not.
For most long-horizon investors, a low-cost, total-return broad-market ETF is the most efficient vehicle for capturing equity compounding without the costs and behavioural pitfalls that erode returns over time.
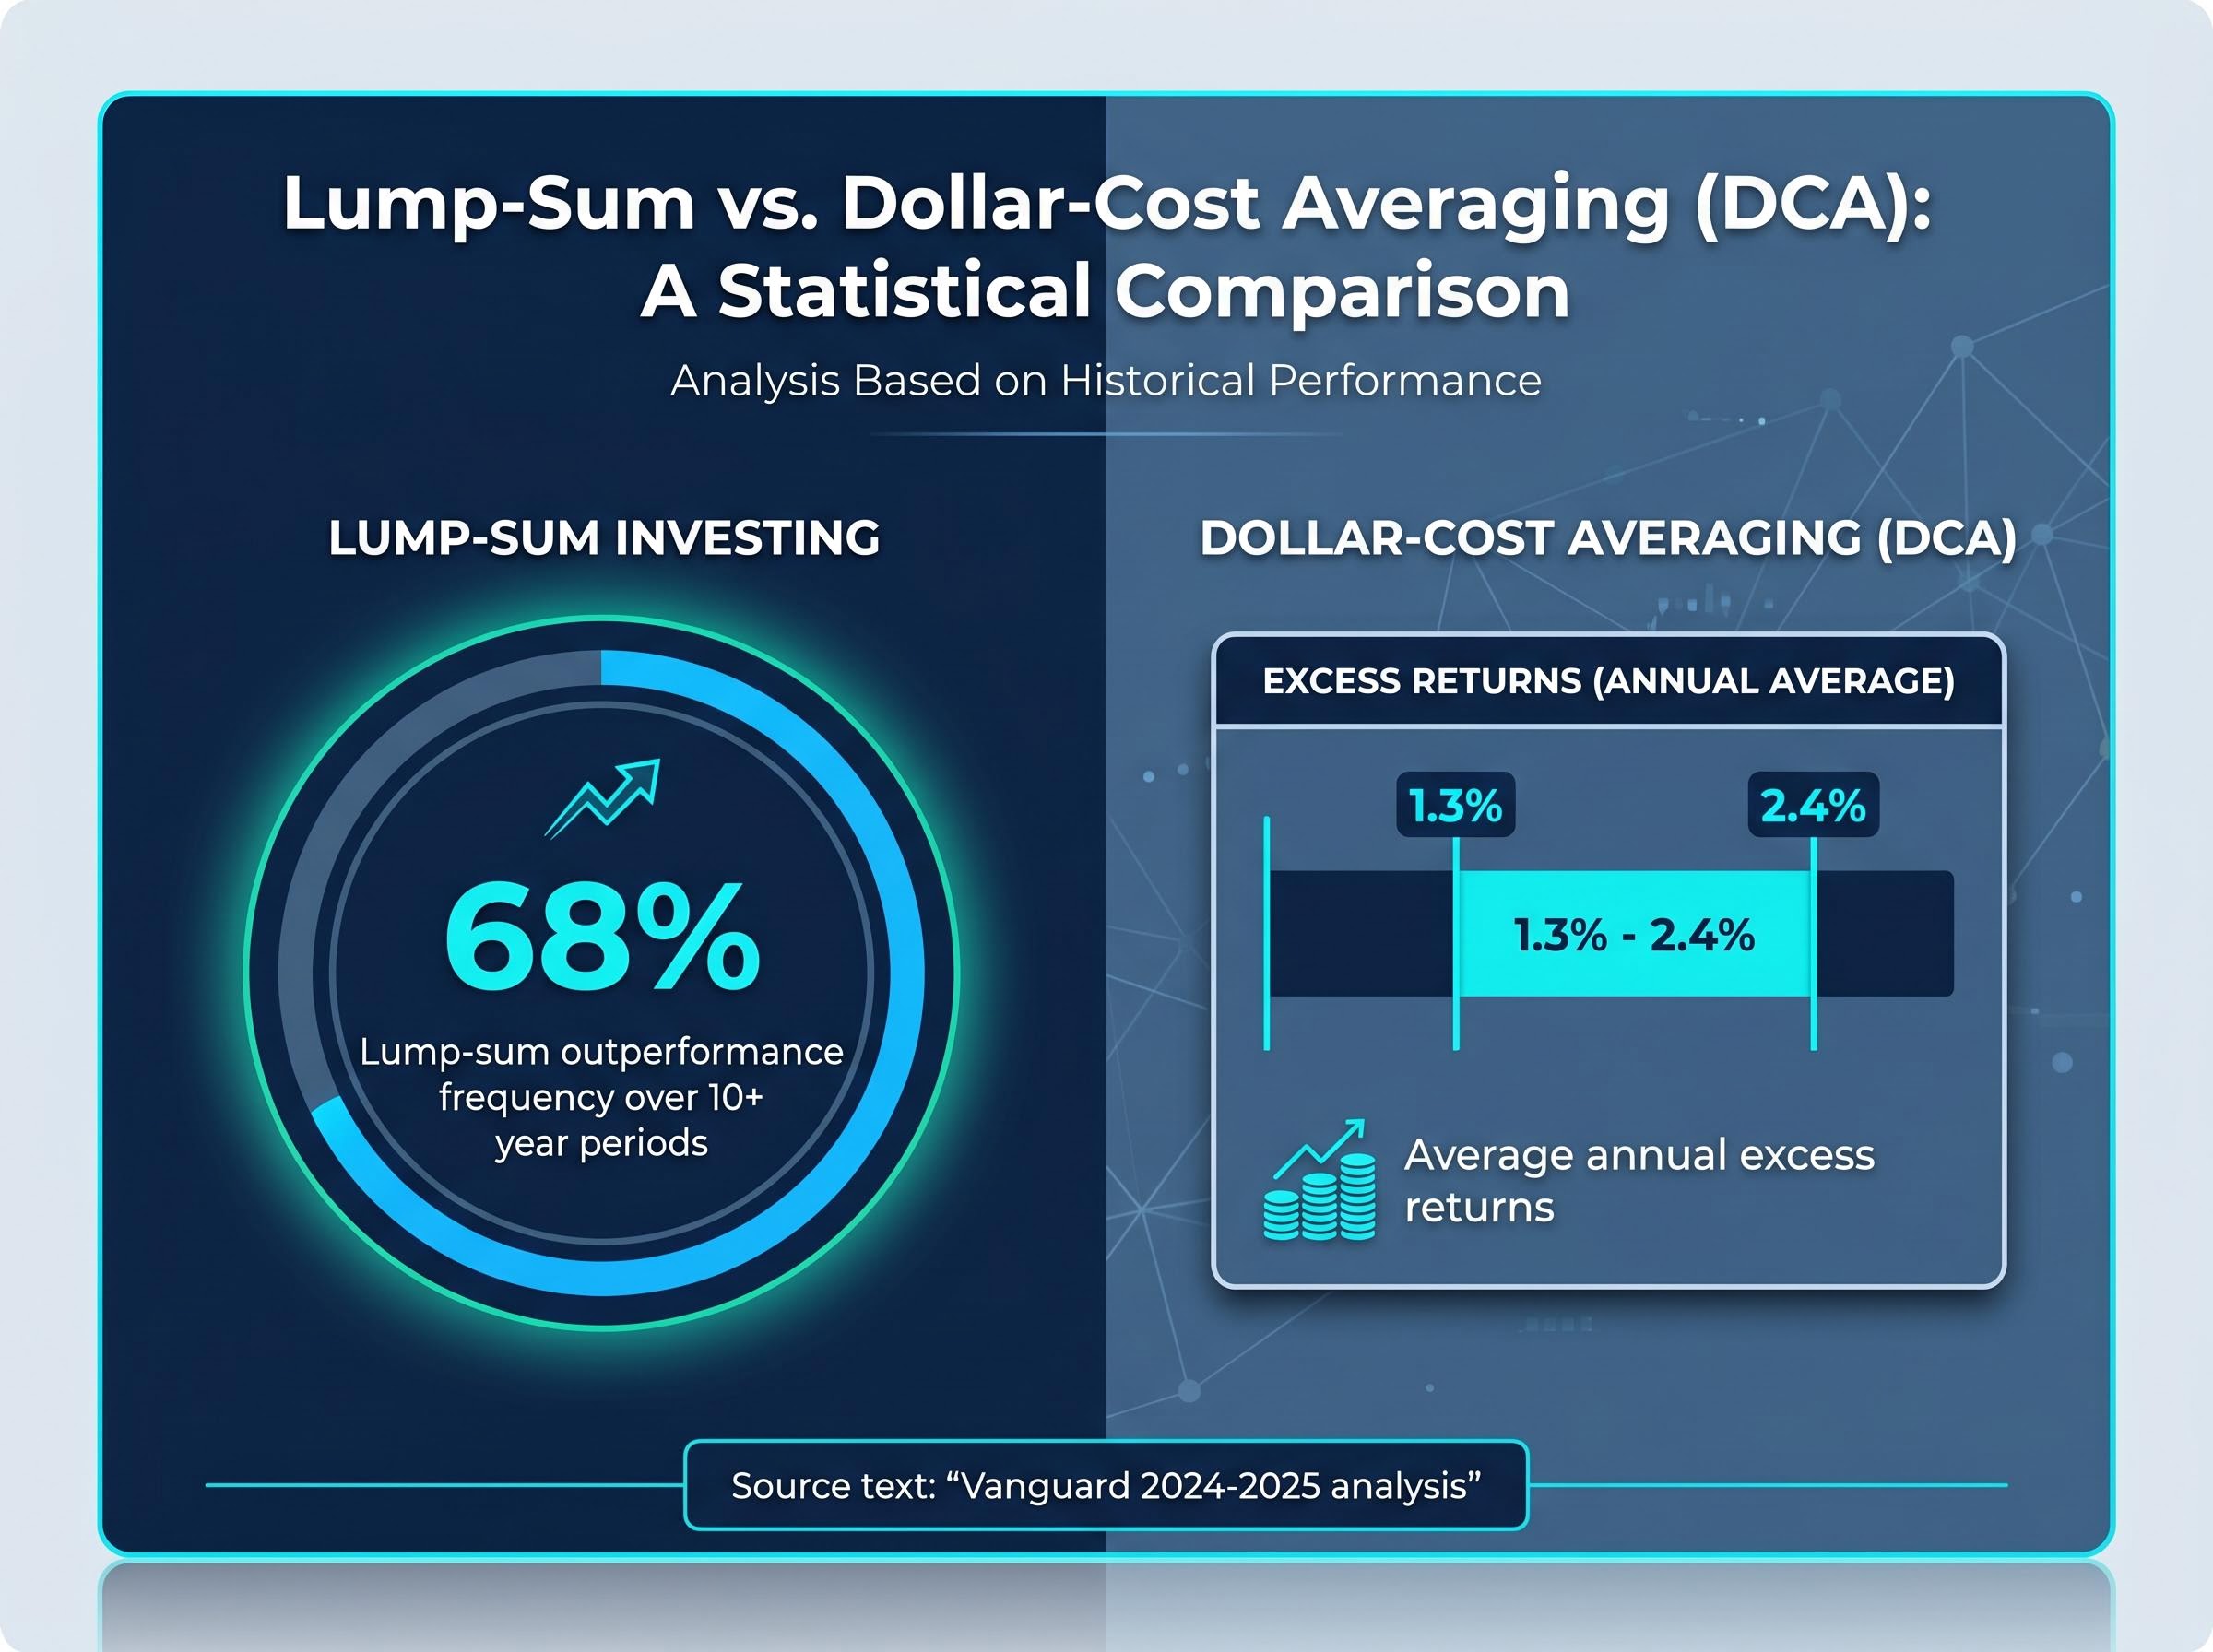
Lump-sum investing outperforms dollar-cost averaging (DCA) more often than not, and the margin is not trivial.
Vanguard’s 2024-2025 analysis found that lump-sum investing outperformed DCA in approximately 68% of historical periods spanning 10-plus years, with average excess returns of 1.3-2.4% annually across global markets.
The mechanism is straightforward. Every day that capital sits in cash or low-return equivalents during a DCA deployment window is a day it is not compounding at the equity return rate. Over a 20-year holding period, those early months of delayed deployment represent a permanent opportunity cost.
JP Morgan’s 2025 outlook urged “balanced positioning” amid volatility, while Citi’s 2025 outlook favoured steady allocation across asset classes. Neither institution explicitly endorsed DCA over lump-sum deployment, but both emphasised consistent market participation over timing.
DCA’s value is honest but limited. It is a behavioural tool, not a mathematically superior strategy. For investors who would otherwise remain entirely in cash because of valuation anxiety or fear of poor entry timing, DCA provides a structured mechanism for market participation. Its greatest virtue is that it ensures the capital actually gets invested.
Behavioural return drag, estimated at approximately 1.5% per annum on average, is the hidden cost that makes DCA genuinely valuable for a specific investor profile: not the one who understands the mathematics, but the one who would otherwise stay in cash indefinitely waiting for conditions that never feel right.
The decision framework reduces to two scenarios:
The hierarchy is clear. Lump sum wins the data. DCA wins the behaviour. Either is superior to remaining in cash.
Dividend reinvestment is not a strategy in the conventional sense. It is a structural decision about whether the capital base grows or stays fixed, and the consequences of that decision compound silently across the entire holding period.
The reinvestment loop operates in four steps:
While no recent institutional study isolates the precise percentage uplift from reinvestment versus non-reinvestment over a verified 10-20 year period, the total return data for equities (approximately 7% real annually from 1802 to April 2025, according to WisdomTree) is substantially driven by reinvestment compounding. That 7% figure embeds the effect of reinvested dividends alongside earnings growth and productivity gains. Strip reinvestment out, and the figure falls materially.
WisdomTree’s institutional research highlights that the compounding engine in equities, built on reinvestment, growth, and innovation, is structurally absent in gold, bonds, and cash. Vanguard and Morningstar reports remain the recommended resource for precise dividend reinvestment uplift quantification across specific timeframes.
Total-return ETFs reinvest dividends automatically. No action is required from the investor, and no dividends sit in cash between distribution and redeployment.
Distributing ETFs and direct equity holdings, by contrast, pay dividends to the investor as cash. The investor must actively elect to reinvest, and many do not, either through inattention or because the cash is redirected to spending. Over 20 years, the difference between automatic reinvestment and manual (or absent) reinvestment compounds into a meaningful wealth gap.
The choice between total-return and distributing formats is effectively a permanent compounding decision for the holding period. It deserves as much deliberation as the asset selection itself.
The debate between total return versus dividend strategies resolves differently depending on the investor’s tax position and income needs; in a taxable account, dividend-focused portfolios face a forced annual tax event regardless of whether the investor needs the cash, while a total-return approach preserves control over when capital gains are realised.
Returns compounding inside a tax-sheltered vehicle accumulate on the gross return each year. Returns in a taxable account compound on the post-tax return. Over 20 years, this difference produces a material wealth gap, even when the underlying assets and return rates are identical.
The principle is straightforward: a 7% gross return compounding tax-free outpaces a 7% gross return taxed annually at 20-30% on dividends and capital gains. The gap widens with every year the compounding cycle runs.
Three major global structures provide this shelter:
| Country | Structure | Annual Contribution Limit (2024-2025) | Key Tax Advantage |
|---|---|---|---|
| United Kingdom | ISA (Individual Savings Account) | $20,000 (plus $5,000 British ISA for UK-listed assets from April 2025) | Returns fully sheltered from income tax and capital gains tax |
| Australia | Superannuation | $30,000 concessional cap | Earnings taxed at concessional 15% in accumulation phase |
| United States | 401(k) / IRA | $23,500 (401k) / $7,000 (IRA); catch-up contributions available for age 50+ | Tax-deferred growth (traditional) or tax-free withdrawals (Roth) |
The strategic hierarchy for capital deployment follows three steps:
The IRS contribution limits for 401(k) plans and IRAs are updated annually and represent the ceiling on tax-sheltered capital that US investors can deploy each year, making it essential to verify current figures when building a multi-year contribution strategy.
The compounding advantage of equities is magnified when sheltered from annual taxation. Over a 20-year horizon, structural decisions about where capital is held can matter as much as decisions about what it is invested in.
The six principles covered in this guide collapse into a single sequential decision framework:
The wealth gap between disciplined long-horizon investors and undisciplined ones is not primarily explained by asset selection or market timing. It is explained by time in market, reinvestment discipline, and structural efficiency.
These principles are independent of market cycles, geographic location, or current valuation levels. They apply to any investor beginning or reorienting a long-horizon strategy, whether deploying the first $10,000 or restructuring an existing portfolio for the next two decades.
The six-pillar framework outlined here connects to the broader landscape of long-term investment strategies, including the role of international diversification, dividend equity selection, and the current valuation gap between US and international developed markets that has widened to roughly 20x versus 15x price-to-earnings.
This article is for informational purposes only and should not be considered financial advice. Past performance does not guarantee future results. Investors should conduct their own research and consult with financial professionals before making investment decisions.
Long term wealth accumulation is the process of growing capital over extended horizons, typically 10-20 years or more, by allowing returns to compound on an expanding base. Equities have delivered approximately 7% real annual returns since 1802, with the back half of any holding period generating nearly double the dollar gains of the first half due to exponential growth.
Tax-sheltered structures allow compounding to occur on the full gross return each year, whereas taxable accounts compound on the post-tax return after annual dividends and capital gains taxes are applied. Over a 20-year horizon, this structural difference produces a material wealth gap even when the underlying assets and return rates are identical.
Vanguard's 2024-2025 analysis found that lump-sum investing outperformed dollar-cost averaging in approximately 68% of historical periods spanning 10 or more years, with average excess returns of 1.3-2.4% annually. Dollar-cost averaging remains a useful behavioural tool for investors who would otherwise hold cash indefinitely due to valuation anxiety.
Broad-market ETFs eliminate three major return-destroying problems: cost drag from high expense ratios, concentration risk from individual stock selection, and overtrading temptation that generates transaction costs and tax events. A low-cost ETF with fees below 0.10% preserves nearly all of the underlying index return across the full holding period.
A total-return ETF automatically reinvests dividends back into the fund, ensuring the compounding cycle runs without interruption or investor action. A distributing ETF pays dividends as cash, requiring the investor to manually reinvest, and over a 20-year period the difference between automatic and absent reinvestment compounds into a meaningful wealth gap.