CURE and CLNE: the ASX ETFs Returning 25% in 2026
7 hrs ago
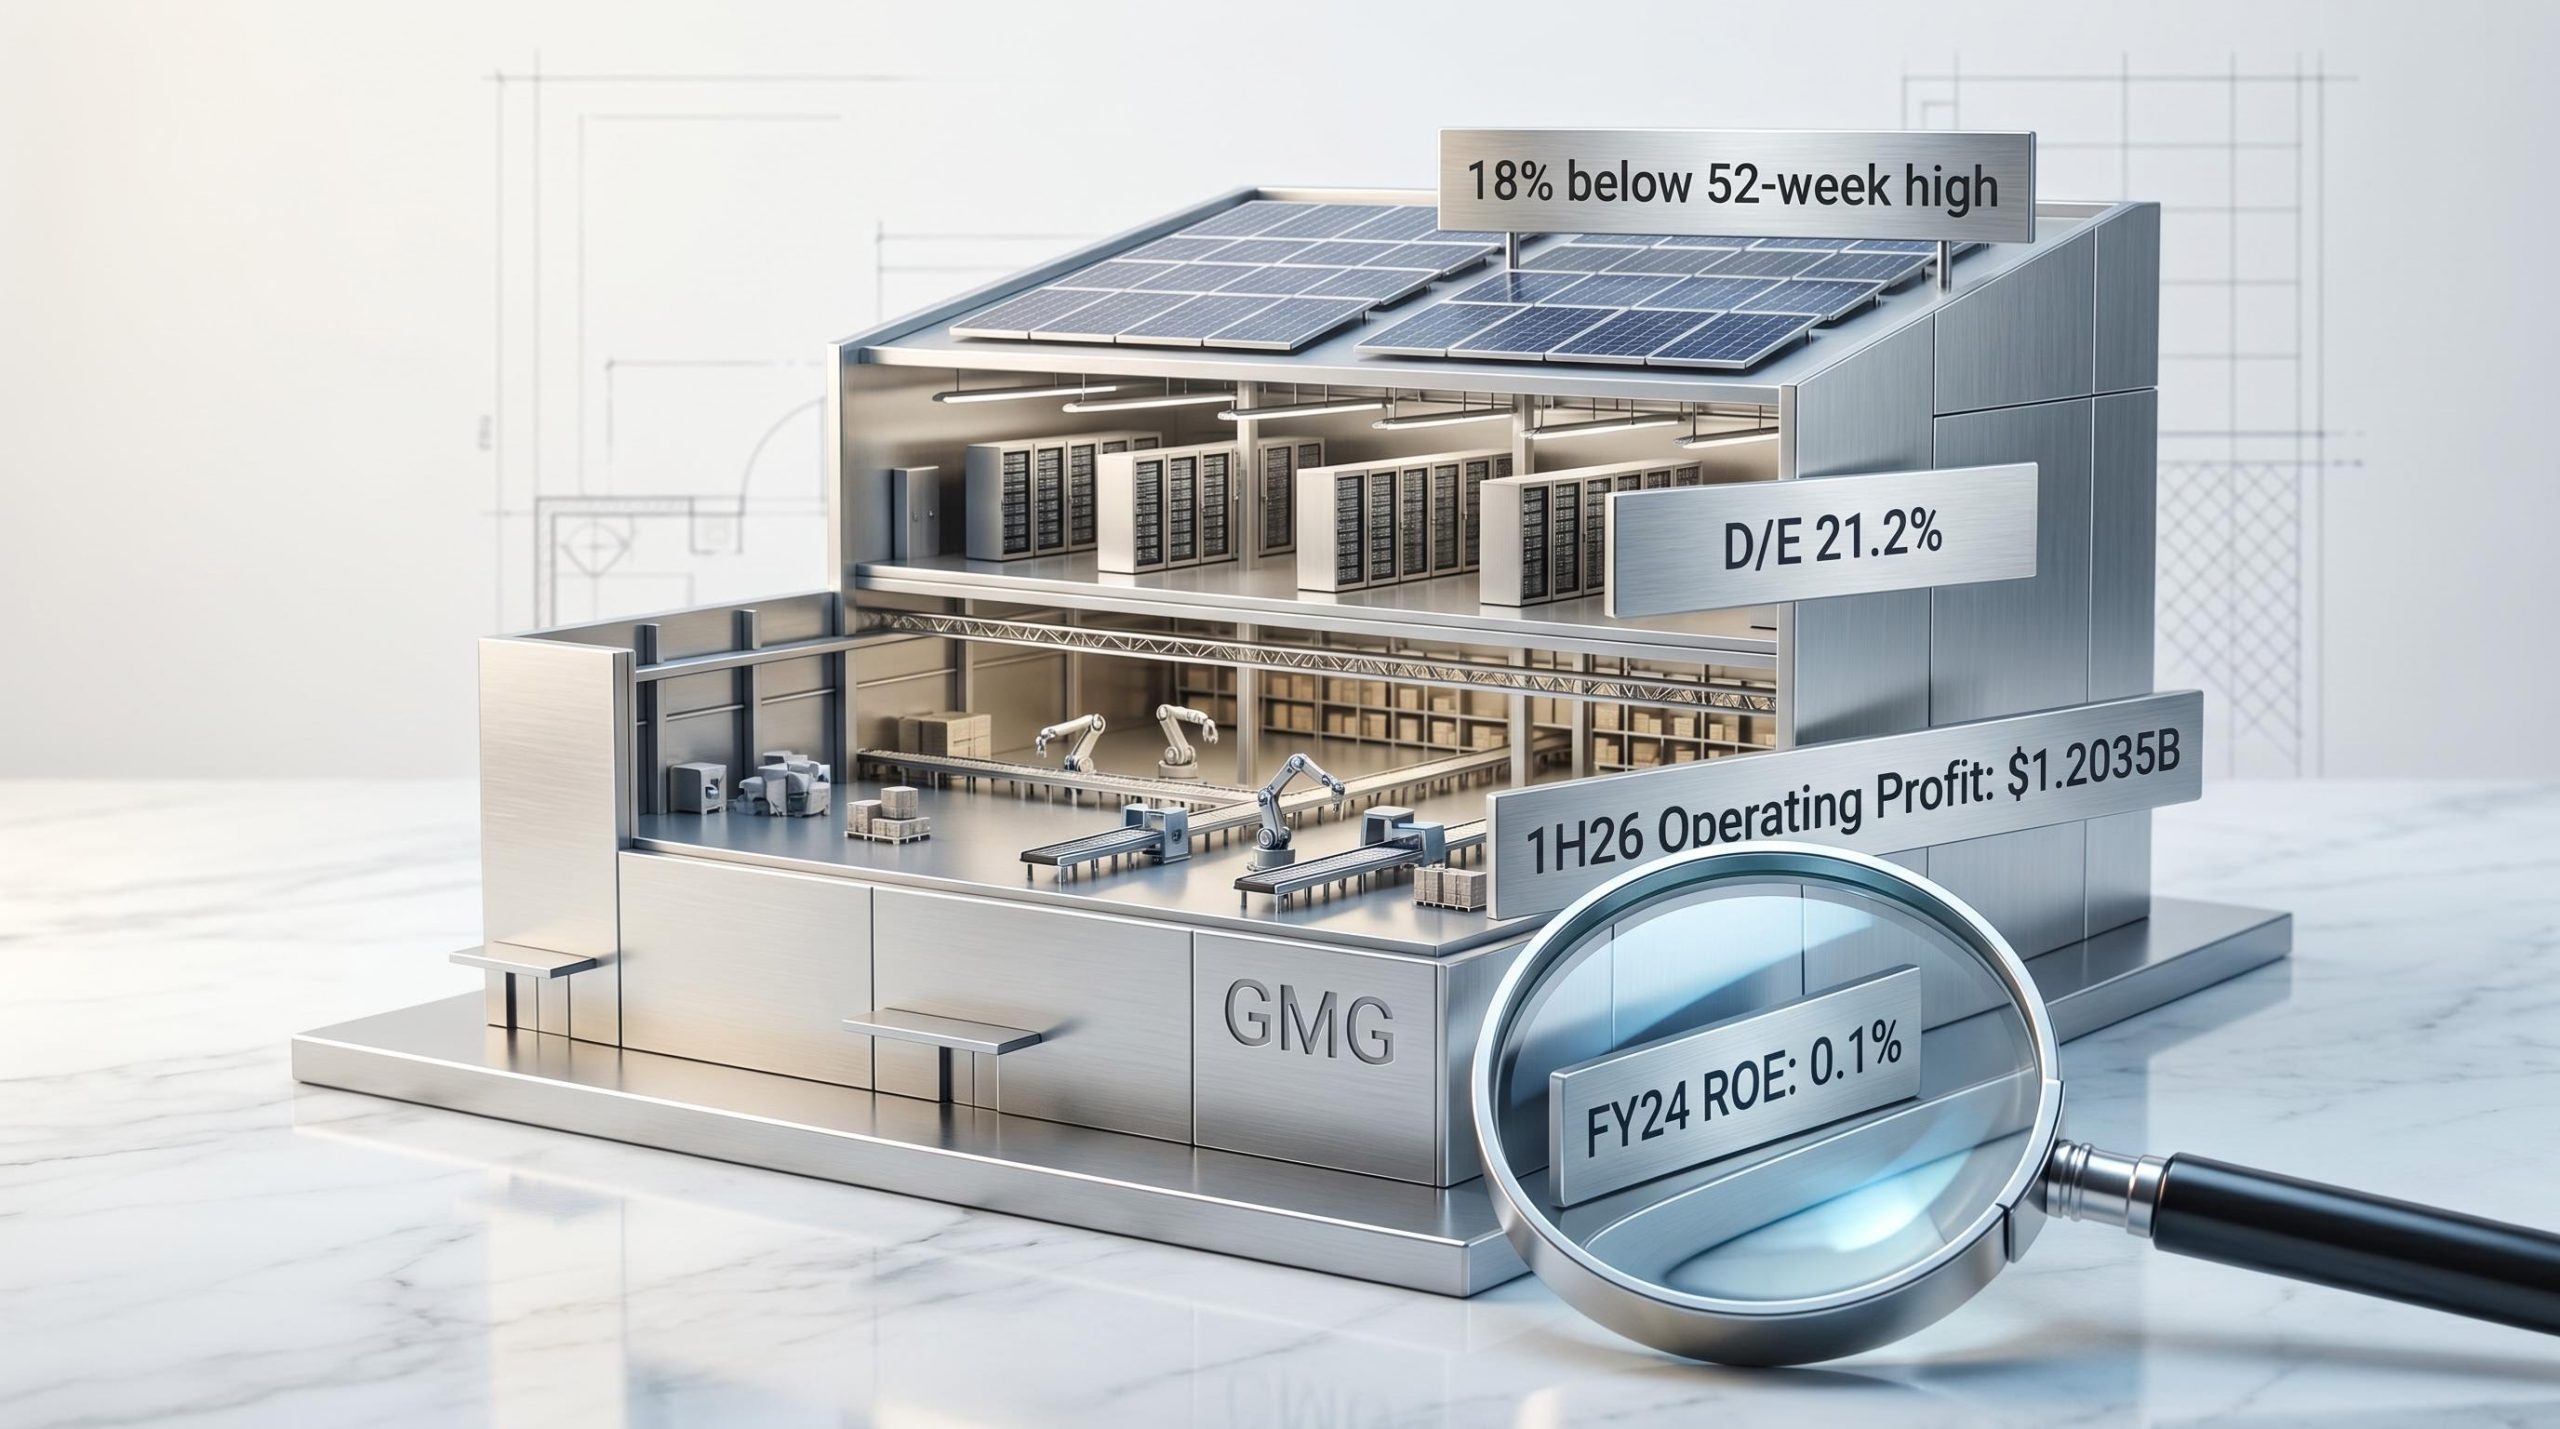
Goodman Group, Australia’s largest ASX-listed property company, is trading 18% below its 52-week high. For investors scanning for entry points into quality compounders, that gap immediately raises a question: does the pullback reflect a genuine shift in underlying value, or simply market noise around an unchanged business?
Goodman is not a conventional real estate investment trust (REIT). Its capital-light, partnership-driven model, its accelerating pivot into data centre and artificial intelligence (AI) infrastructure, and its unusual reported financials, a debt-to-equity ratio of just 21.2% sitting alongside an FY24 return on equity (ROE) of 0.1%, make it a genuinely complex stock to assess on surface-level metrics alone. Investors who approach it with traditional property-stock frameworks risk misreading the signals.
This analysis unpacks the numbers that matter for Goodman Group shares: what the business actually does, why its financial ratios look the way they do, and what investors need to understand before drawing any conclusions from the current price pullback.
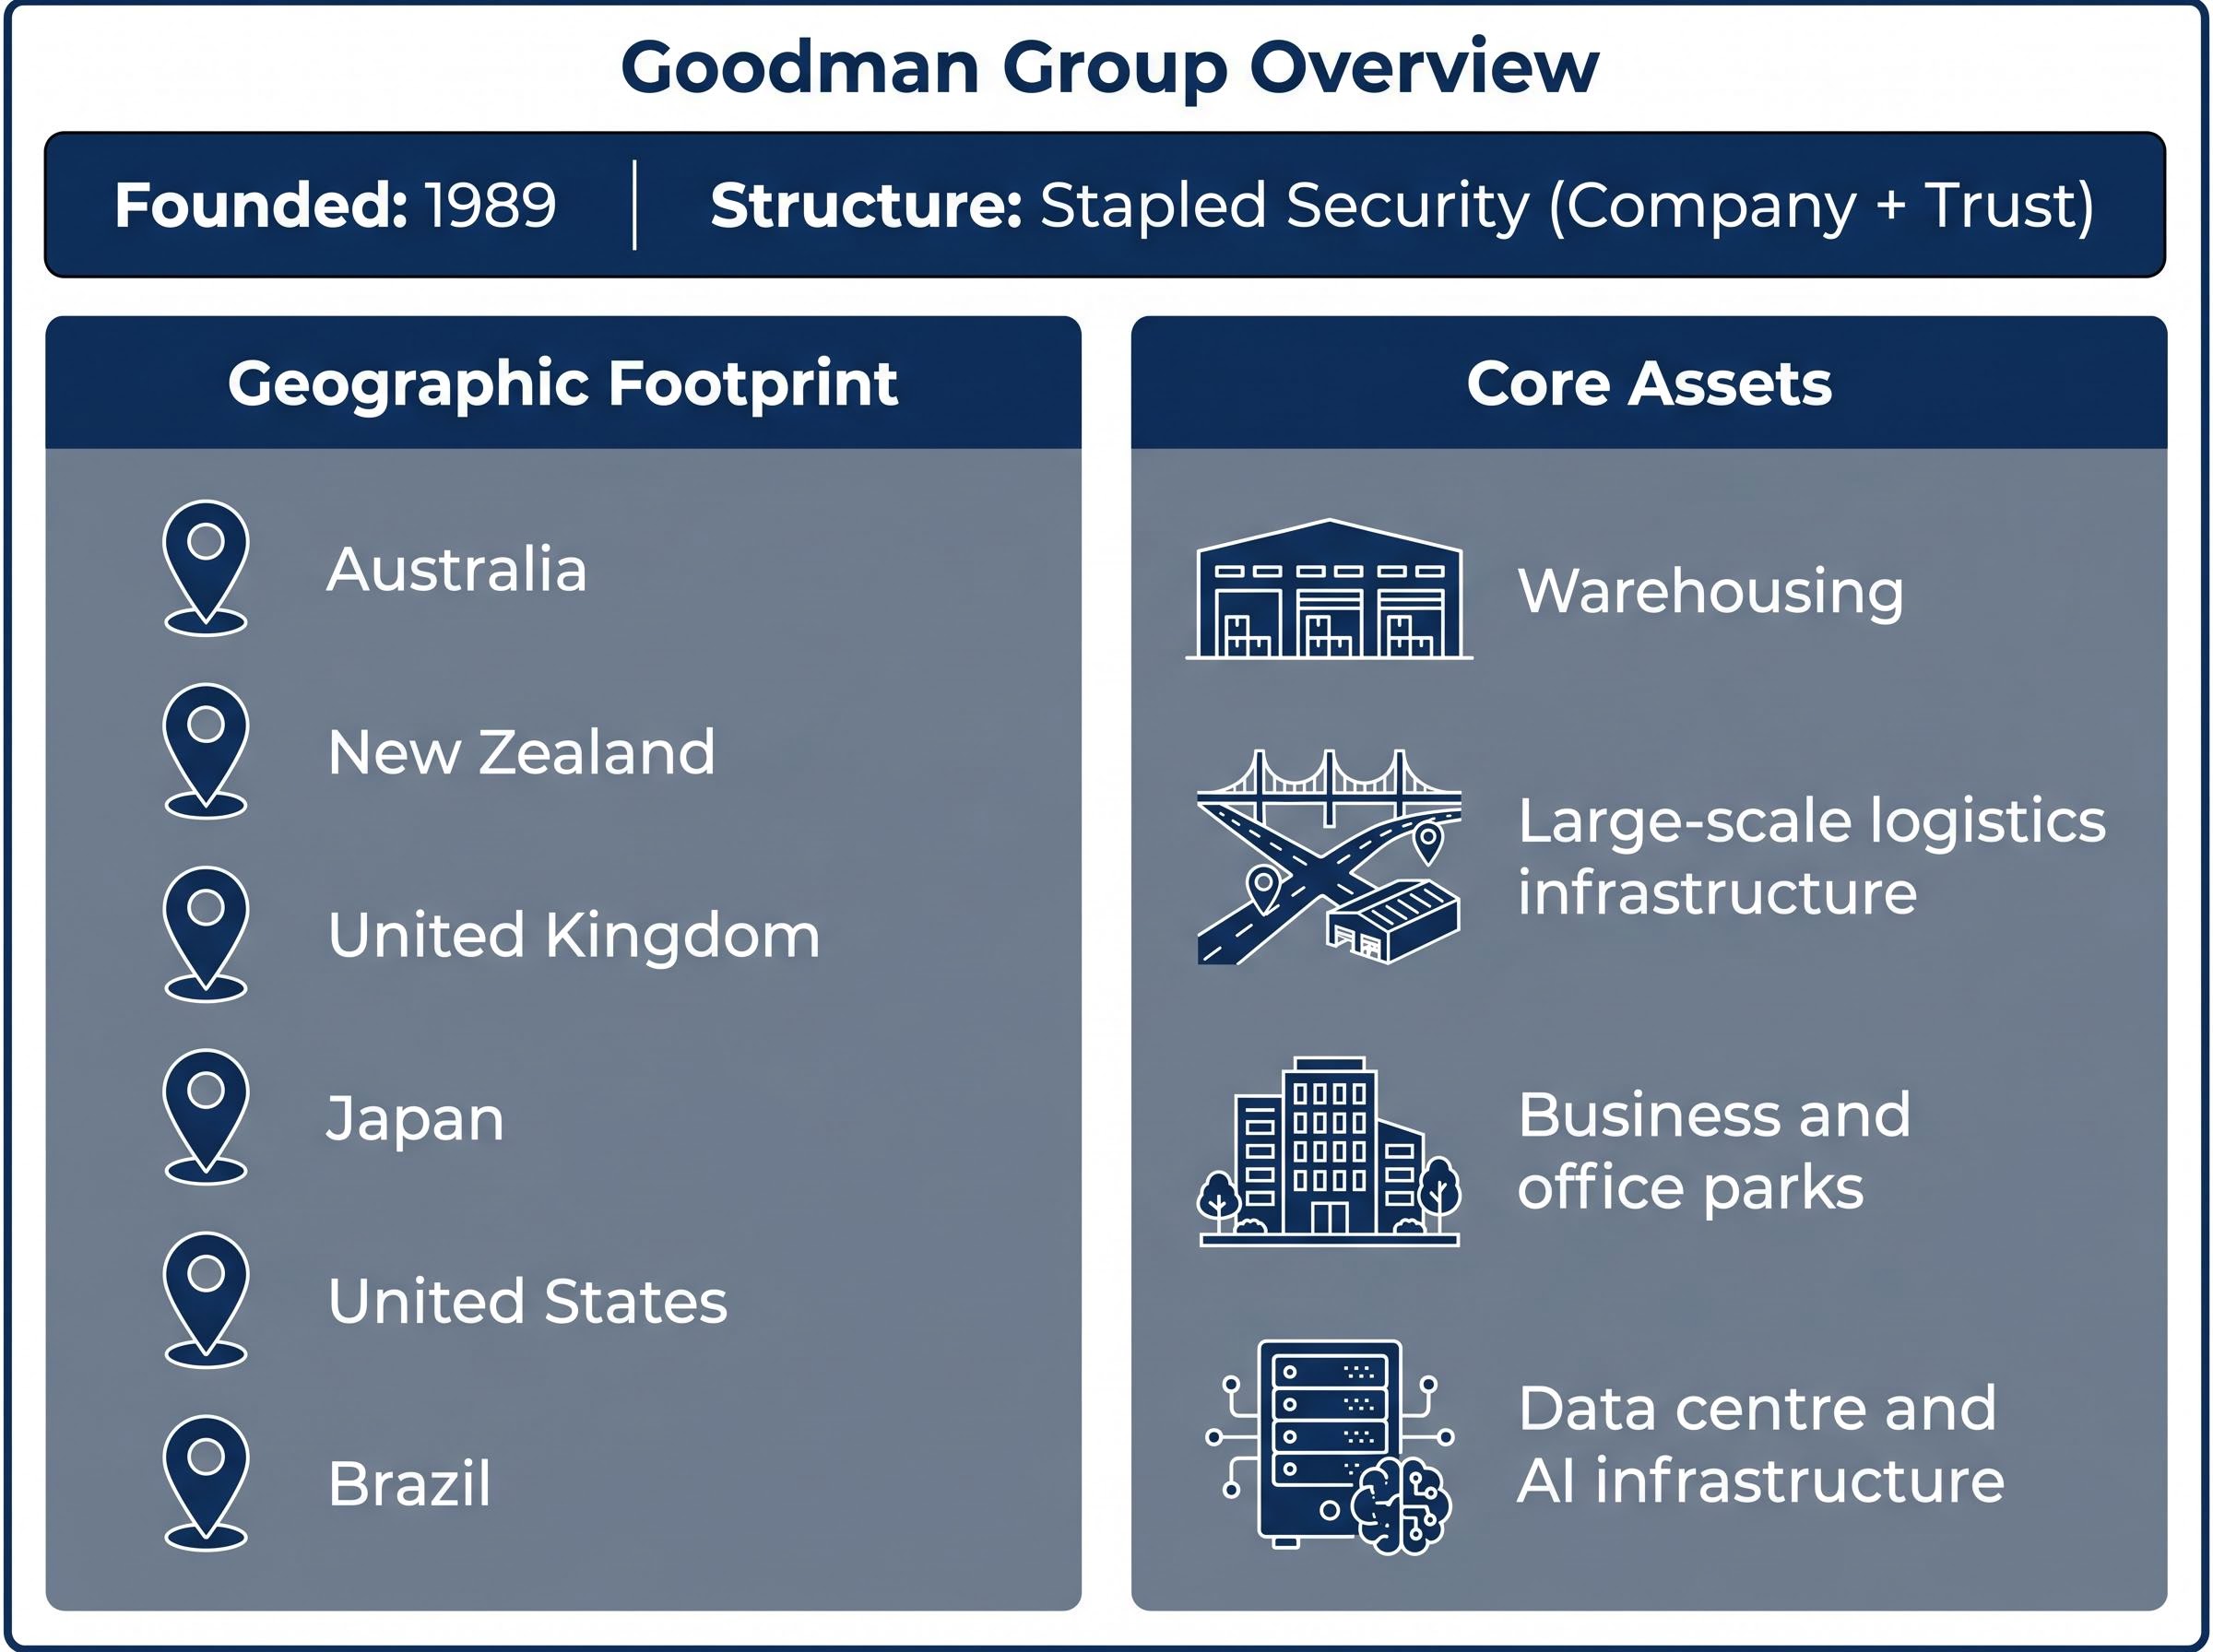
Goodman Group is structured as a stapled security, meaning a company and a trust are legally bound together and trade as a single unit on the ASX. This matters because profits and equity are distributed across both entities, making direct comparisons with conventionally structured property companies unreliable from the outset.
Founded in 1989, Goodman develops, owns, and manages industrial and logistics assets predominantly through co-investment vehicles where it holds a minority stake and earns management and performance fees. This is a capital-light approach: significant assets under management (AUM) are generated relative to on-balance-sheet capital, enabling scale without heavy direct leverage.
The group’s key operational characteristics include:
Understanding this structure is not optional context. The stapled security and partnership model directly explain why conventional metrics like ROE and debt-to-equity ratios appear unusual, and why investors cannot assess the stock the same way they would assess a standard listed property trust.
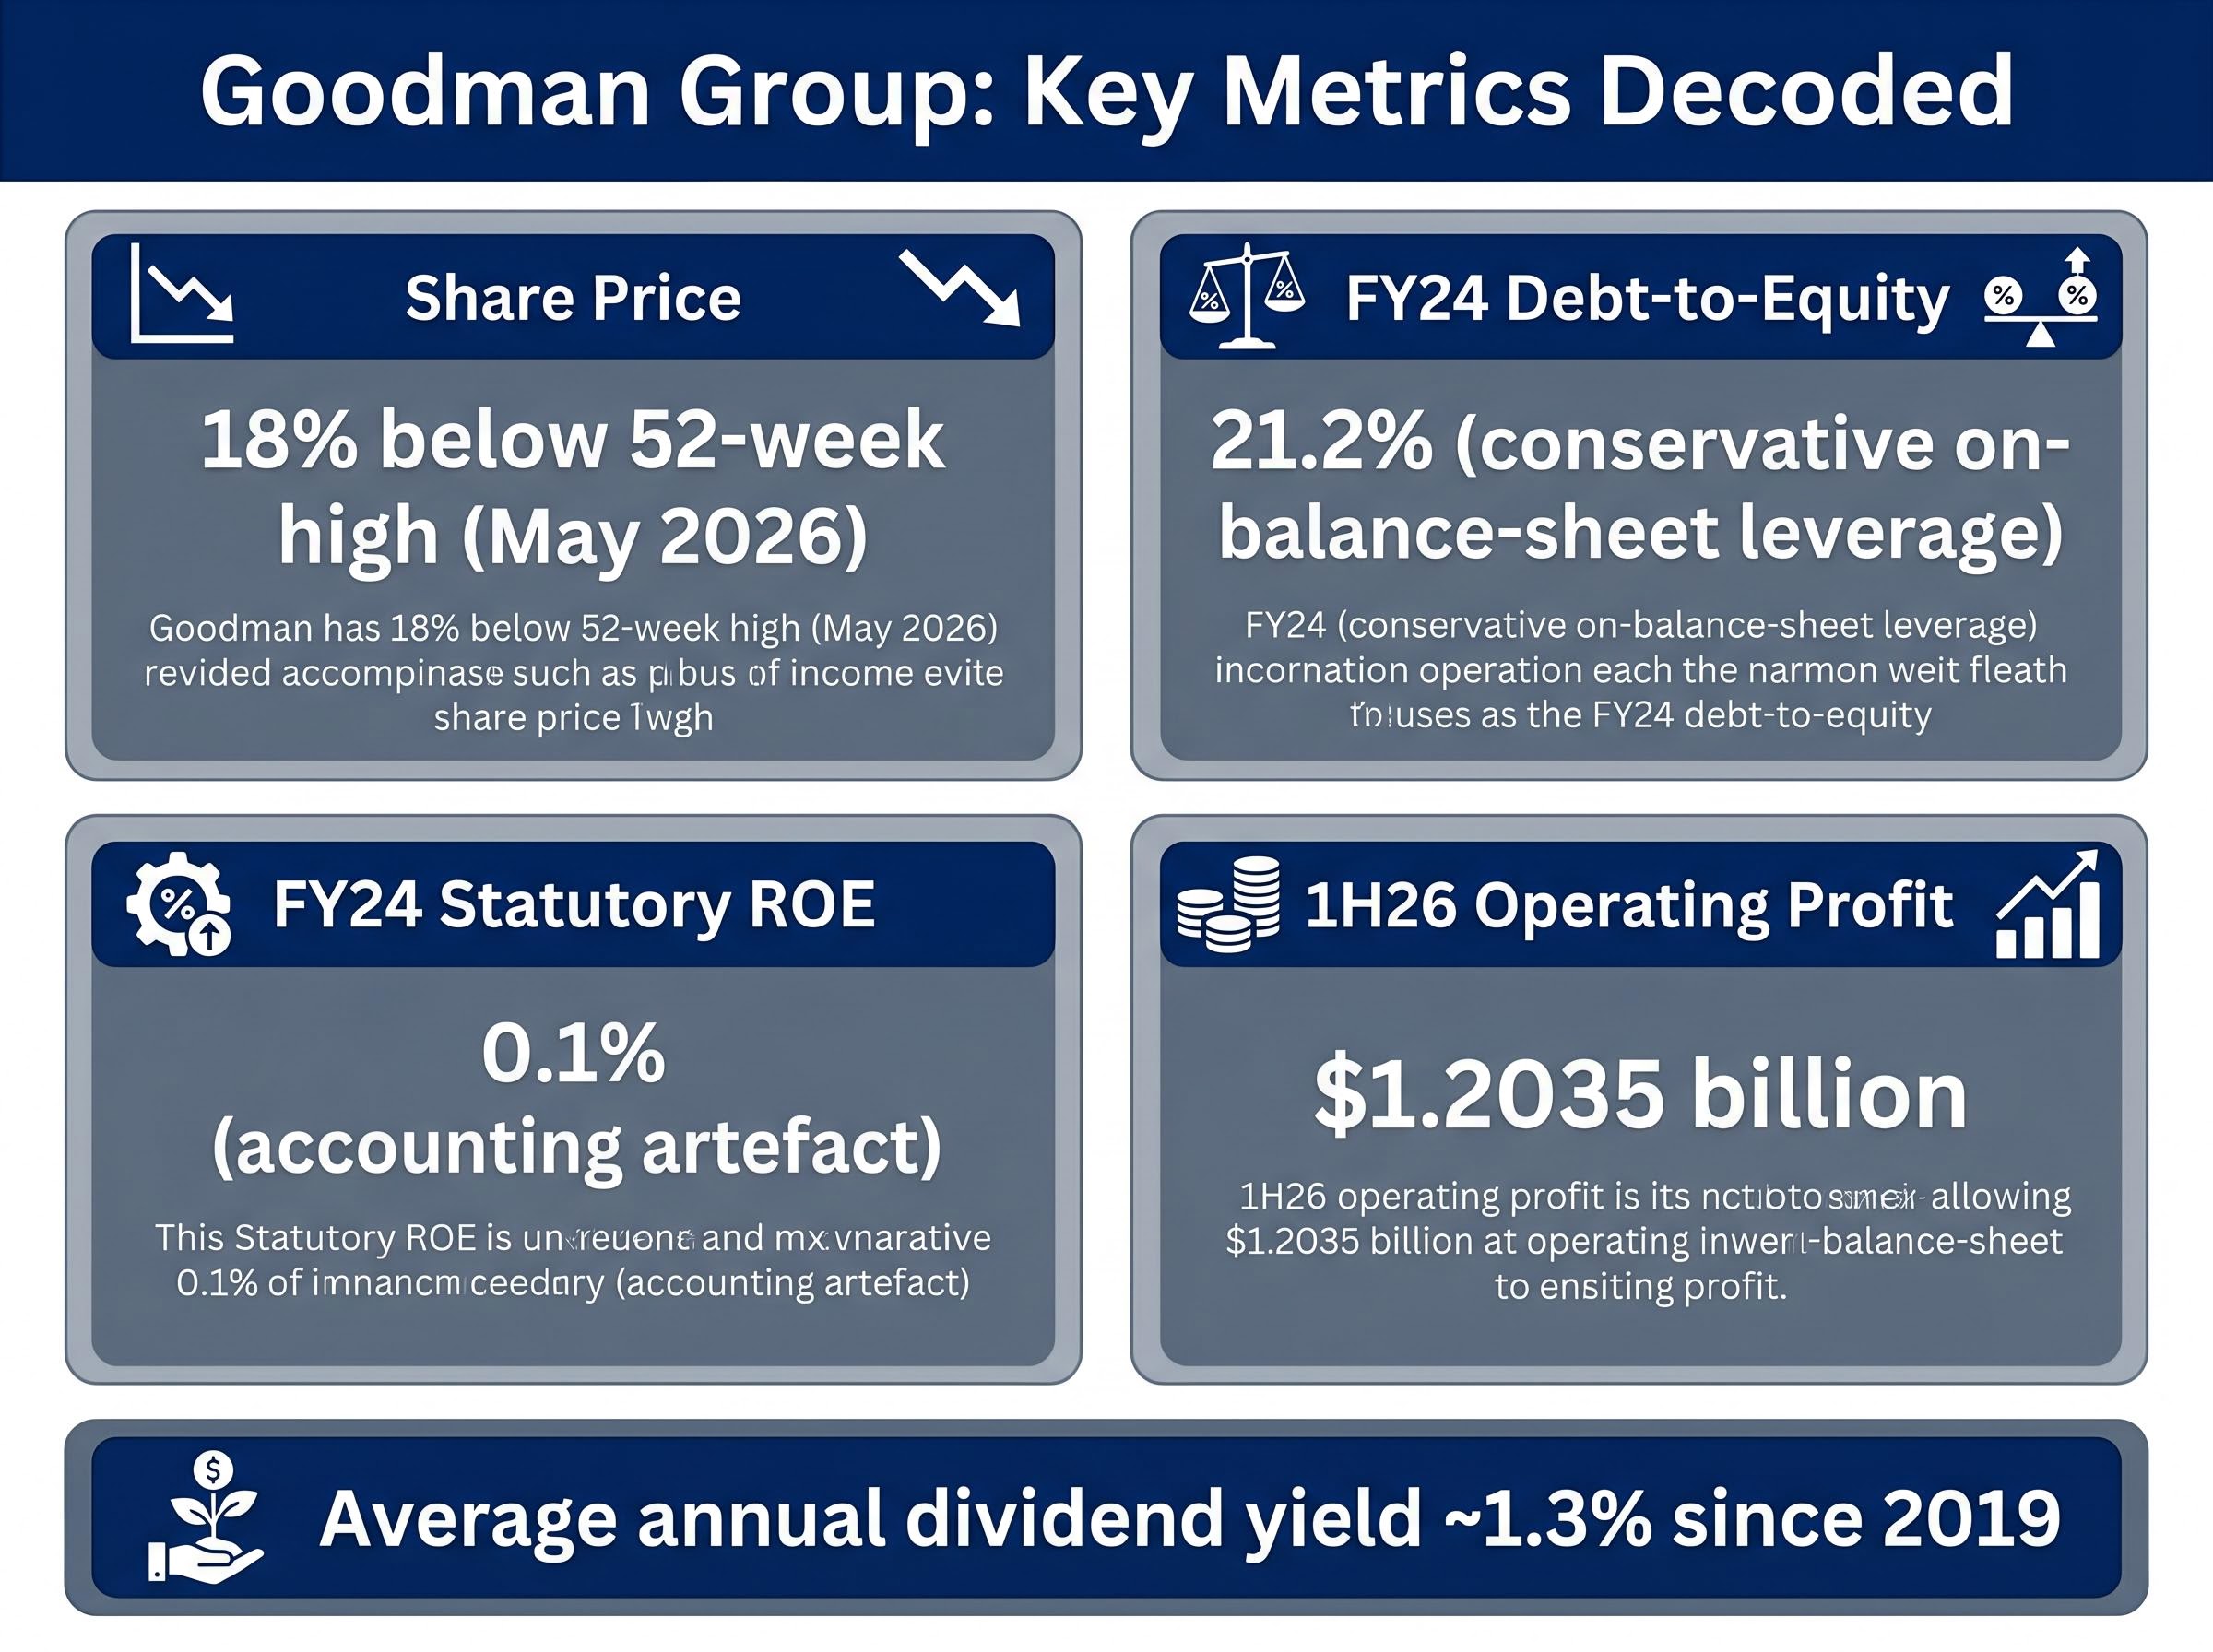
Goodman shares are trading 18% below their 52-week high as of May 2026, according to the Rask Invest Research Team. That gap is the triggering observation for this analysis.
For premium-valued, secular-growth stocks, pullbacks are frequently framed by analysts as accumulation opportunities rather than deep-value situations. The debate with a stock like Goodman typically centres on entry point rather than business model validity. Analyst consensus has historically characterised Goodman as “priced for perfection,” meaning even moderate multiple compression can produce significant nominal price declines without any deterioration in fundamentals.
1H26 Operating Profit: $1.2035 billion Goodman’s half-year results for the period ended 31 December 2025 reported operating profit of $1.2035 billion, confirming continued operational momentum during the pullback period.
A price pullback alone is not sufficient grounds for an investment decision. The analytical task is understanding what, if anything, has changed in the underlying business to justify or discount the move. Goodman’s operating performance during the period of share price weakness suggests the pullback reflects valuation compression rather than a fundamental deterioration, but that hypothesis requires further examination of the financial metrics underpinning the stock.
REIT price recovery following a period of multiple compression is not guaranteed by a rate-cutting cycle alone; the 10-year bond yield, not the cash rate, is the primary valuation lever for listed property, which means investors cannot assume Goodman’s share price discount to its 52-week high will automatically narrow simply because central banks are easing.
Goodman’s FY24 debt-to-equity ratio of 21.2% is exceptionally low relative to typical property sector leverage. A ratio below 100% means the company holds more equity than debt. At 21.2%, Goodman’s balance sheet conservatism is pronounced.
That conservatism is structural and intentional. The partnership model concentrates leverage inside co-investment vehicles rather than on Goodman’s own balance sheet. Headline gearing therefore significantly understates the group’s total economic exposure. Off-balance-sheet AUM through partnership vehicles is where significant leverage sits; this is a known feature of the model, not a hidden risk.
The low on-balance-sheet leverage serves a specific strategic purpose. Goodman’s 1H26 results commentary framed “strong balance sheet with significant liquidity and conservative gearing” as the enabler of large-scale, capital-intensive data centre development commitments. Conservative gearing is not a passive financial characteristic here; it is load-bearing infrastructure for the company’s growth ambitions.
| Leverage Layer | Where It Sits | Investor Implication |
|---|---|---|
| On-balance-sheet debt | Goodman Group balance sheet | Reported as 21.2% D/E; appears very low |
| Partnership/AUM leverage | Co-investment vehicles managed by Goodman | Significant leverage held off-balance-sheet; understated by headline ratio |
Investors reading 21.2% as a straightforward “low debt, low risk” signal are getting only part of the picture. Understanding both the structural reason for this number and its strategic purpose is necessary for an accurate risk assessment.
A 0.1% return on equity for FY24 is, on its face, an anomalous number for a major ASX-listed stock. It warrants explanation rather than dismissal.
The figure is primarily an accounting artefact arising from four interacting structural factors:
Capitalisation rate expansion sits at the centre of Goodman’s near-zero statutory ROE, because rising discount rates compress the fair-value of investment properties and directly suppress the statutory profit numerator; the four REIT valuation channels connecting interest rate movements to property company earnings and prices explain why this compression can persist even when operating performance remains strong.
Goodman’s primary performance metric is non-IFRS operating profit, not statutory profit. Management, analyst consensus, and Goodman’s own reporting consistently use operating profit, AUM growth, development yields, and total securityholder return as the relevant measures rather than ROE.
Peer-reviewed research on REIT performance metrics identifies operating profit, funds from operations, and AUM growth as more analytically reliable measures for listed property trusts than statutory return on equity, precisely because non-cash revaluation items and structural equity bases make statutory ROE an unreliable cross-sectional comparator in this asset class.
Neither Goodman’s FY25 annual report nor its 1H26 results materials treat the low statutory ROE as a fundamental business concern. For investors comparing Goodman to conventional property or industrial businesses using ROE as a screening metric, this distinction is the corrective: the 0.1% figure reflects accounting structure, not the absence of economic profitability.
Since 2024-25, the dominant strategic theme at Goodman has been the accelerating reallocation of land, capital, and partnership capacity toward data centre and AI infrastructure development. This is not a peripheral initiative; it is the primary growth vector reshaping the group’s forward profile.
Goodman is targeting hyperscale and AI-related customers for large-scale, power-intensive sites in gateway markets across the United States, Europe, and Asia Pacific. The execution model is the same capital-light partnership approach used for industrial logistics: Goodman manages development, holds a minority stake, and earns fees and performance income.
Australian data centre investment reached a milestone in May 2026 when CDC Data Centres signed the largest contracted capacity deal in Australian history at 555MW, a transaction that underscores the scale of hyperscaler and AI-driven demand Goodman is targeting as it reallocates land and partnership capital toward data infrastructure.
Key data centre and AI infrastructure developments confirmed in 1H26 and FY25 materials include:
The data centre pivot involves heavy early-stage investment in land, infrastructure, and power access. Revenue recognition and fair-value uplift materialise later in the project life cycle, often partly via equity-accounted vehicles. This timing mismatch affects near-term earnings optics but does not reflect the scale of committed activity. Investors assessing the current pullback need to evaluate this strategic trajectory, not just the historical industrial logistics business, when forming a view on whether the price gap is meaningful.
The analytical picture has a clear outline. The 18% pullback has occurred against a backdrop of continued operating profit growth ($1.2035 billion in 1H26) and an accelerating strategic pivot. The 21.2% debt-to-equity ratio is structural and deliberate. The near-zero statutory ROE of 0.1% is an accounting artefact rather than a performance signal.
What the numbers leave unresolved is equally important. Goodman’s valuation relative to intrinsic value requires a full discounted-cash-flow or operating-profit-based analysis that headline metrics alone cannot provide. The data centre pipeline’s ultimate return profile carries execution risk. And capitalisation-rate movements in the industrial sector could continue to depress statutory profit and create further short-term volatility.
The average annual dividend yield of approximately 1.3% since 2019 confirms that Goodman is primarily a growth story rather than an income play. Investors seeking yield from property exposure should factor this into their assessment.
For investors whose primary goal is income generation and who are reconsidering whether Goodman’s growth-oriented profile fits their portfolio, our comprehensive walkthrough of ASX dividend investing covers franking credits, sustainable payout ratios, and how to construct a diversified income portfolio across ASX property, financial, and defensive sectors.
| Metric | Reported Figure | Analytical Interpretation |
|---|---|---|
| Share price vs 52-week high | 18% below | Valuation compression; operating fundamentals appear intact |
| FY24 Debt-to-equity | 21.2% | Structurally low; off-balance-sheet leverage in partnerships understated by headline figure |
| FY24 Statutory ROE | 0.1% | Accounting artefact; operating profit and AUM growth are the relevant performance measures |
The Rask Invest Research Team cautions that metrics such as those discussed represent a limited subset of analytical tools. Investors should seek comprehensive valuation methods and, where appropriate, consult a licensed financial adviser.
Goodman is a structurally unusual property business whose standard financial metrics require careful interpretation. The 18% pullback cannot be assessed without that interpretive framework.
The operating profit trajectory, including the $1.2035 billion first-half figure, and the expanding data centre pipeline represent the genuine pulse of the business. Statutory ROE and the headline share price move, taken in isolation, do not.
Investors considering Goodman Group shares should conduct complete valuation work using operating-profit-based methods, consult Goodman’s ASX-lodged results materials directly, and seek licensed financial advice before acting. The stock’s accounting complexity and strategic positioning demand more than a surface-level reading of the numbers.
This article is for informational purposes only and should not be considered financial advice. Investors should conduct their own research and consult with financial professionals before making investment decisions. Past performance does not guarantee future results. Financial projections are subject to market conditions and various risk factors.
Goodman Group is Australia's largest ASX-listed property company, structured as a stapled security that develops, owns, and manages industrial and logistics assets through co-investment partnerships. It earns management fees, performance fees, and a share of net results from equity-accounted vehicles rather than relying solely on traditional rental income.
Goodman's FY24 statutory ROE of 0.1% is an accounting artefact driven by non-cash property revaluation losses, its stapled security structure, and a large accumulated equity base, not a sign of poor underlying performance. Management and analysts use operating profit and AUM growth as the relevant performance measures instead.
The 21.2% debt-to-equity ratio reflects only on-balance-sheet debt, because Goodman's partnership model concentrates significant leverage inside co-investment vehicles that sit off its balance sheet. The low headline figure is structural and deliberate, designed to preserve the capacity to fund large-scale data centre development commitments.
Goodman shares are trading approximately 18% below their 52-week high as of May 2026, with the pullback appearing to reflect valuation multiple compression rather than any deterioration in operating fundamentals, given the company reported operating profit of $1.2035 billion for the first half of FY26.
Since 2024-25, Goodman has been accelerating the reallocation of land, capital, and partnership capacity toward hyperscale data centre and AI infrastructure development across the United States, Europe, and Asia Pacific, using the same capital-light partnership model it applies to industrial logistics.