The University of Michigan Consumer Sentiment Index just posted a preliminary May 2026 reading of 48.2, down from April’s final figure of 49.8 and below consensus expectations of roughly 49.5-49.7. Multiple outlets have described it as a record low. For retail investors scanning headlines, the instinct is straightforward: sentiment is collapsing, so equities must be next. That instinct is intuitive, widely shared, and empirically unreliable. Consumer sentiment and stock market direction have a relationship, but it runs in the opposite direction most investors assume. What follows explains why sentiment surveys reflect the recent past rather than the near future, how the expectations-gap mechanism actually drives price action around these releases, and what a record-low Michigan reading means for portfolio decisions when stripped of the behavioural noise surrounding it.
What the University of Michigan sentiment index actually measures
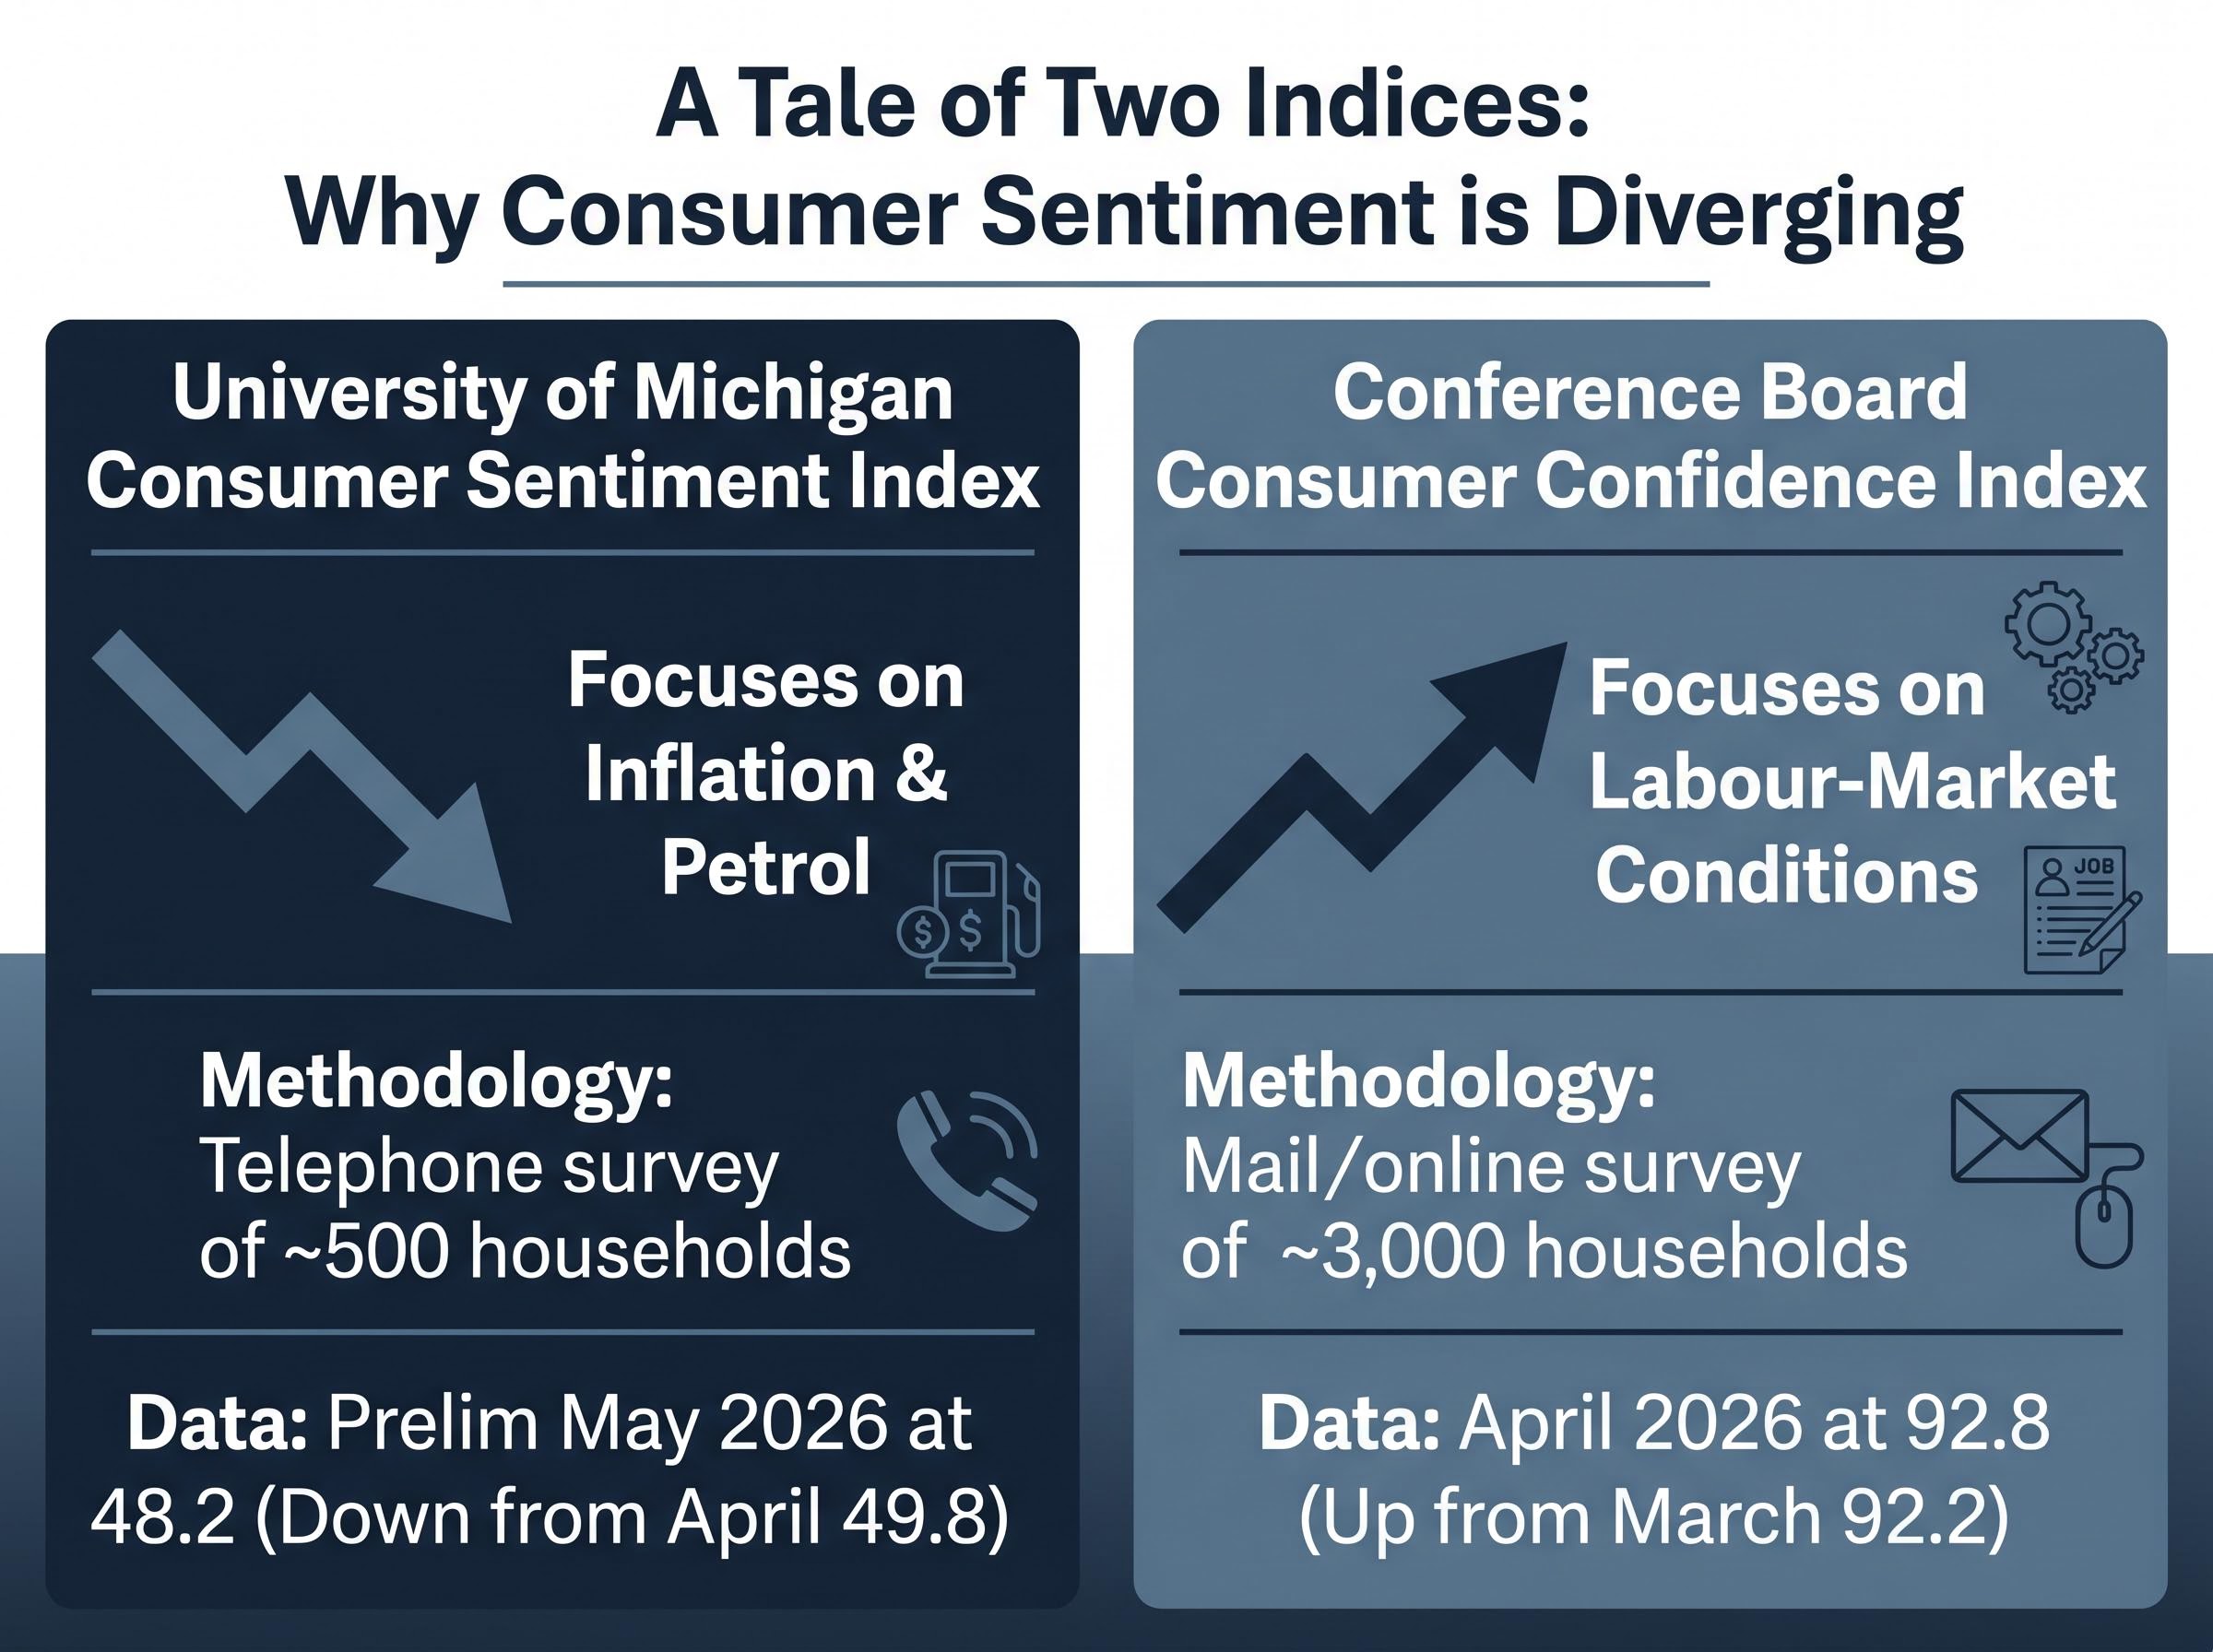
The number making headlines is drawn from a monthly telephone survey of roughly 500 US households. Respondents answer questions about their current personal finances, whether now is a good time to buy major household items, and their expectations for the economy over the next year and five years. The resulting index is heavily weighted toward inflation perceptions and petrol prices, which means it captures how households feel about economic conditions they have recently experienced rather than any forward-looking financial analysis.
That distinction matters. When petrol prices rise or grocery bills climb, the Michigan index falls, often sharply, regardless of what equity markets or corporate earnings are doing at the same time.
The preliminary May 2026 reading of 48.2 missed consensus expectations of approximately 49.5-49.7 and dropped from April’s final reading of 49.8. The final May figure is scheduled for release on 22 May 2026.
How the Conference Board index tells a different story right now
The Conference Board Consumer Confidence Index, the other headline measure of US consumer attitudes, emphasises a different set of anxieties. Its survey focuses on labour-market conditions, asking respondents whether jobs are “plentiful” or “hard to get.” This weighting means it responds more slowly to inflation anxiety but picks up employment deterioration earlier.
The two indices are currently diverging. The Conference Board’s April 2026 reading came in at 92.8, up 0.6 points from March’s 92.2, even as Michigan hit described record lows. That divergence illustrates how two widely cited gauges can simultaneously tell conflicting stories depending on which economic pressures dominate at a given moment.
| Attribute | Michigan Consumer Sentiment | Conference Board Confidence |
|---|---|---|
| Survey method | Telephone survey of ~500 households | Mail/online survey of ~3,000 households |
| Primary economic focus | Inflation perceptions, buying conditions | Labour-market conditions |
| Release schedule | Twice monthly (preliminary and final) | Monthly |
| Current reading | 48.2 (preliminary May 2026) | 92.8 (April 2026) |
| Current direction | Falling (record lows described) | Rising modestly |
When big ASX news breaks, our subscribers know first
Sentiment surveys reflect the past, not the future
If consumers report feeling pessimistic, and markets subsequently fall, the temptation is to treat the sentiment reading as a warning that worked. The problem is the sequence. Sentiment surveys capture how households feel about conditions they have already lived through: the petrol price they paid last week, the grocery bill from last month, the headlines they read over the past several days. By the time those feelings are collected, aggregated, and published on a fixed schedule, equity markets have typically already processed the same information and repriced accordingly.
The lag operates at three levels:
- Survey collection window: Responses accumulate over days or weeks, during which market prices continue to move.
- Publication delay: The aggregated figure is released after the collection period ends, adding further lag.
- Market pre-pricing: Professional participants position around consensus forecasts before the release, meaning prices already reflect expected sentiment levels.
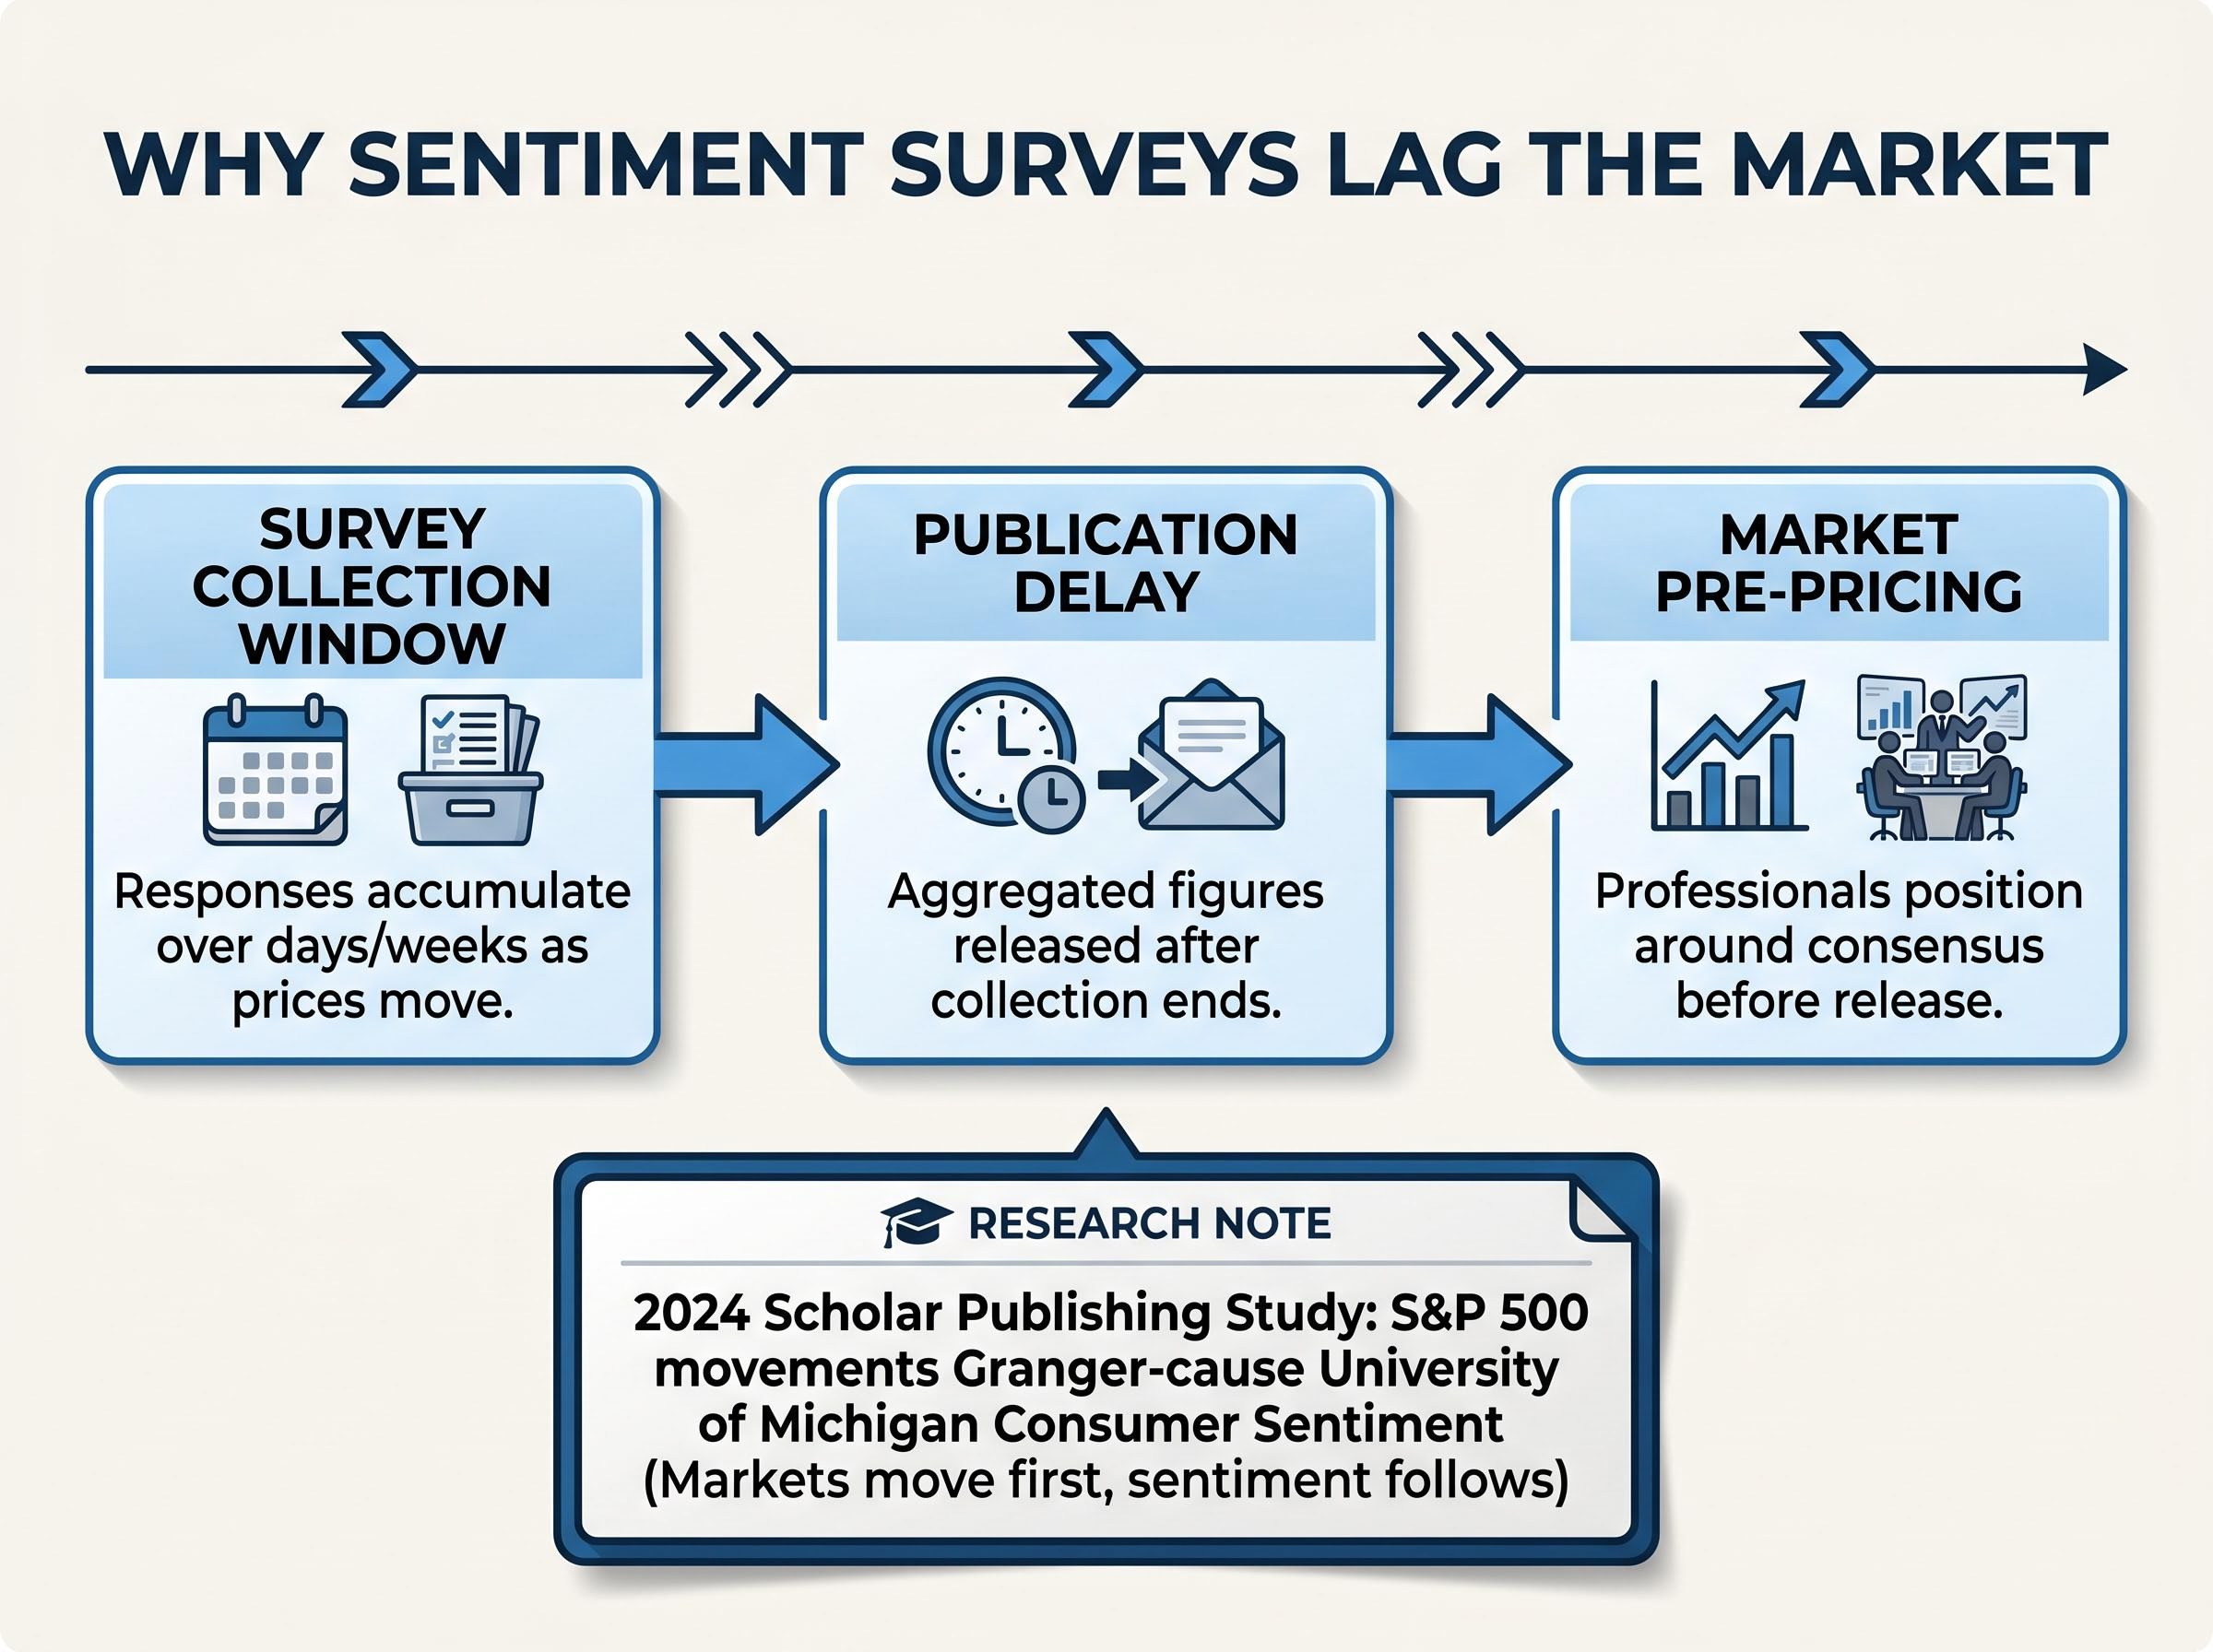
A 2024 academic study published through Scholar Publishing confirmed this ordering formally. Using Granger-causality testing, the researchers found that S&P 500 movements statistically precede changes in University of Michigan Consumer Sentiment readings, not the reverse.
The Rose-Hulman research on sentiment and stock prices applies Granger-causality testing to establish the directional relationship formally, finding that stock prices influence consumer confidence readings rather than the reverse, which confirms the structural lag retail investors routinely overlook when interpreting Michigan releases.
Stock market movements Granger-cause University of Michigan Consumer Sentiment, meaning market price changes come first and sentiment readings follow, not the other way around.
The 2025-2026 period offers a real-world illustration. Michigan sentiment has been sitting at or near record lows, yet equity markets have not collapsed in lockstep. The index is describing the rearview, not the road ahead.
The behavioural finance trap retail investors fall into
The specific error has a name in behavioural finance: the availability heuristic applied to market timing. When a headline announces record-low consumer confidence, the information feels urgent and predictive. Recent negative coverage is mentally available, and the brain treats that availability as evidence of what comes next.
The sequence runs like this:
- A headline sentiment figure falls sharply, generating media coverage.
- The investor interprets the reading as a forward signal for equity prices.
- The investor acts on information that is lagging, selling after conditions the market has already absorbed.
Fisher Investments observed in its 18 May 2026 commentary that consumer confidence tends to move in tandem with equity market performance, economic data releases, and prevailing financial media tone. In other words, the sentiment figure is often reflecting the same information the market has already priced, not adding new information on top of it.
A further complication: actual consumer spending data and survey-based sentiment frequently diverge. Households report feeling pessimistic while continuing to spend, which undermines the assumption that low sentiment translates directly into reduced economic activity, let alone equity market declines. The gap between how people feel about economic conditions and how equities and the broader economy actually perform is a documented and recurring feature of the data, not an anomaly.
The spending and sentiment divergence has been particularly sharp in 2025-2026, with the US personal savings rate sitting at 4.0% in February 2026 even as Michigan readings described record pessimism, suggesting aggregate retail figures were being temporarily supported by a narrow cohort of high-income households rather than broad-based consumer confidence.
How markets actually move around sentiment releases
If the absolute level of a sentiment reading does not reliably predict market direction, what does drive price action when the number hits? The answer is the expectations gap.
Professional market participants position ahead of scheduled economic releases based on consensus forecasts. By the time the Michigan figure is published, prices already reflect the expected reading. The variable that generates actual price movement is the deviation between the released figure and those expectations.
The expectations gap is not unique to sentiment releases; it operates identically in earnings season, where stocks with 27% EPS growth sold off in Q1 2026 because the beat was smaller than the premium already priced into shares, illustrating that the mechanism governing sentiment price action is the same one driving post-earnings moves.
This mechanism explains why markets sometimes rally on objectively bad sentiment readings (the miss was smaller than feared) and sell off after objectively good ones (the beat was smaller than hoped). The absolute number is secondary; the surprise relative to consensus is the operative signal.
According to Fisher Investments, markets are most likely driven by the difference between prevailing expectations and what economic reality ultimately delivers.
What the May 2026 miss actually signals
The preliminary May 2026 reading of 48.2 came in roughly 1.3-1.5 points below consensus expectations of approximately 49.5-49.7. That miss is notable, but it lands against a backdrop where sentiment was already at described record lows and much of the prevailing pessimism was arguably already embedded in positioning.
The final May Michigan reading, scheduled for 22 May 2026, will draw closer attention. The same expectations-gap logic applies: the relevant question will not be whether the final number is “good” or “bad” in isolation, but whether it surprises relative to the updated consensus forming around the preliminary figure.
Why deeply depressed sentiment reshapes the expectations landscape
The expectations-gap framework, once understood, leads to a counterintuitive structural observation. When sentiment reaches record or near-record lows, consensus expectations are already deeply pessimistic. That pessimism effectively lowers the bar that economic reality must clear before producing a positive surprise relative to what is priced in.
Three conditions typically characterise this low-bar environment:
- The sentiment reading is at or near record lows, meaning expectations have limited room to deteriorate further.
- A wide miss from consensus has already been absorbed by markets without proportional equity declines.
- Actual spending data diverges from survey pessimism, suggesting the real economy is outperforming the mood.
With Michigan at 48.2, described across multiple outlets as a record low, the pessimism already embedded in expectations may limit how much additional downside surprise is available from sentiment alone. Any improvement in actual conditions, however modest, could generate outsized positive surprise relative to where expectations sit.
Historical precedent supports treating extreme sentiment troughs as a contrarian buy signal rather than a leading warning: the 2022 Michigan sentiment trough coincided with a market bottom, and the S&P 500 was trading near all-time highs even as the April 2026 reading hit described record lows.
Fisher Investments observed in May 2026 that reduced sentiment levels effectively lower the bar that economic reality must clear, a dynamic that could be supportive of continuation of the current bull market.
This is not a prediction that equities will rally. It is a structural observation about the distribution of potential surprises. The 2025-2026 period, during which equity markets demonstrated resilience alongside record-low Michigan readings, provides evidence that this low-bar dynamic has been operating in practice.
What investors should actually do with a sentiment reading
The distinction that matters is between sentiment as context and sentiment as a signal. As context, a record-low Michigan reading reveals where household mood sits and how pessimistic consensus expectations have become. That information has value for understanding the backdrop. As a signal for equity positioning, the same reading is unreliable, lagging by design and reflecting information markets have already processed.
A more useful framework for any sentiment release:
- Note the consensus expectation before the release. The forecast, not the previous reading, is the baseline that matters for price action.
- Calculate the actual deviation from consensus. A reading of 48.2 against expectations of 49.5-49.7 represents a miss of roughly 1.3-1.5 points. That deviation is the operationally relevant data point.
- Assess whether that deviation is already visible in equity price action. If markets moved ahead of the release, the surprise may already be absorbed.
The current two-index divergence (Michigan at record lows while the Conference Board edges higher) reinforces why no single sentiment reading should anchor portfolio decisions. Even the headline picture is internally inconsistent. Fisher Investments framed monetary policy, sentiment, and individual economic releases as each only one of many influences on market performance, with none having a fixed or predetermined effect.
Watching the 22 May final Michigan reading
The final May reading may revise the 48.2 preliminary figure up or down. The same framework applies: the relevant question is whether the revision surprises relative to the updated consensus that has formed since the preliminary release, not whether the number itself sounds alarming in isolation.
Sentiment is the market’s rearview mirror, not its windshield
Consumer sentiment reflects conditions already experienced and prices already moved. It is a description of the recent past, not a map of what comes next. That single distinction, applied consistently, neutralises the most common behavioural error retail investors make with these releases.
Sentiment data does have a legitimate role. At extremes, it reveals where consensus expectations sit, and the expectations-gap framework converts that information into something operationally useful: an assessment of how high or low the bar is for the next surprise. A record-low reading means the bar is low. That is context worth having.
Investors who separate how people feel from where expectations sit will read sentiment releases more accurately, and will avoid the recurring trap of treating a backward-looking survey as a forward-looking forecast.
This article is for informational purposes only and should not be considered financial advice. Investors should conduct their own research and consult with financial professionals before making investment decisions.
—