France’s services Purchasing Managers’ Index (PMI) fell to 42.9 in May 2026, its weakest reading since late 2020. The UK’s composite PMI dropped to 48.5, the softest print outside the pandemic in a decade. Headlines reached for the word “recession.” Both economies, however, grew in Q1 2026. Sub-50 PMI readings reliably generate alarm. What they do not reliably generate is recession. The gap between the signal and the outcome is not a quirk of the current data; it is a well-documented, quantified pattern that central banks, academic researchers, and institutional analysts have studied across decades. The problem is that most readers, and many commentators, treat the PMI economic indicator as a harder signal than it actually is. What follows unpacks what a PMI reading measures, why sub-50 does not automatically mean contraction, what the historical false-positive rate looks like across developed economies, and how to interpret current eurozone and UK data without overreacting to sentiment-driven noise.
What a PMI reading actually measures (and what it deliberately leaves out)
Most readers encounter the PMI as a single number and a verdict: above 50 means growth, below 50 means contraction. That framing is not wrong, but it is incomplete in a way that matters.
A PMI is a diffusion index. Survey respondents, typically purchasing managers at hundreds of firms, report whether conditions such as output, new orders, employment, and delivery times improved, stayed the same, or deteriorated compared with the previous month. The composite PMI combines manufacturing and services responses into a single weighted figure. The result captures breadth: how many firms are moving in each direction.
What it does not capture is magnitude. A reading of 48 means more firms reported contraction than expansion. It says nothing about how severely each firm contracted or how strongly the expanding firms grew. One large company growing rapidly can outweigh several smaller firms contracting mildly in GDP terms, yet the PMI counts each response equally.
This breadth-versus-magnitude gap is the foundational reason why PMI and GDP frequently diverge. Consider the numbers under discussion: France’s May 2026 services PMI of 42.9 and the UK composite of 48.5. Both sit below 50. Both indicate that a majority of surveyed firms reported weaker conditions. Neither, on its own, quantifies how much weaker.
NBER research on diffusion index construction establishes the foundational limitation at the heart of the PMI interpretation problem: diffusion indexes aggregate the direction of change across respondents but discard magnitude entirely, meaning a reading of 42 and a reading of 49 both register as contraction while describing economic conditions that may differ substantially in severity.
It is also worth noting that May flash PMI releases use approximately 80-90% of final survey responses, making them subject to minor revision when the final print is published.
Survey indicators as lagging signals appear across multiple economic data series: academic research using Granger-causality testing shows that stock market movements lead consumer sentiment readings rather than the reverse, and the same directional dependency applies to PMI surveys, where respondents encode recent experience into forward-looking questions, compressing the indicator’s ability to predict turning points.
What PMI measures:
- The proportion of firms reporting improvement versus deterioration
- Directional momentum across manufacturing and services
- Changes in sub-components such as new orders, employment, and delivery times
- A timely, high-frequency snapshot released weeks before GDP data
What PMI does not measure:
- The size or revenue contribution of each firm surveyed
- The magnitude of improvement or deterioration at any individual firm
- Whether the economy as a whole is growing or shrinking in output terms
- The difference between a mild slowdown and a severe contraction
Why the 50 threshold is a directional signal, not a binary verdict
The 50 line separates “more firms expanding” from “more firms contracting.” It does not separate “economy growing” from “economy shrinking.” Readings in the high-40s, specifically the 47-49 range, have historically coincided with near-zero or marginally positive GDP in the eurozone and UK rather than deep contraction. The threshold is a directional signal about momentum, not a binary verdict on the business cycle.
When big ASX news breaks, our subscribers know first
France’s prolonged sub-50 stretch and the GDP that kept growing
France’s composite PMI fell to 44.1 in September 2023. It stayed around the 44 level through January 2024, the kind of sustained reading that typically triggers recession calls in financial commentary.
GDP did not cooperate. France’s economy continued to grow.
The weakness in survey data persisted. France’s composite PMI reached 45.1 in February 2025, another trough, another round of alarm. The May 2026 services print of 42.9 marked a fresh low not seen since late 2020. Across more than two years, French purchasing managers consistently reported deteriorating conditions.
Yet INSEE’s provisional national accounts, published on 29 April 2026, showed French GDP expanding by approximately 0.2% quarter-on-quarter in Q1 2026, following 0.1% growth in Q4 2025. The economy was slowing, not shrinking. Even Q4 2020, the last period when PMI readings were comparably weak, produced only a -0.1% quarterly GDP contraction, not the deep downturn the survey data implied. Isolated GDP dips in Q1 2022 and Q4 2024 were characterised by economists as one-off rather than recessionary.
The timeline below illustrates the sustained divergence.
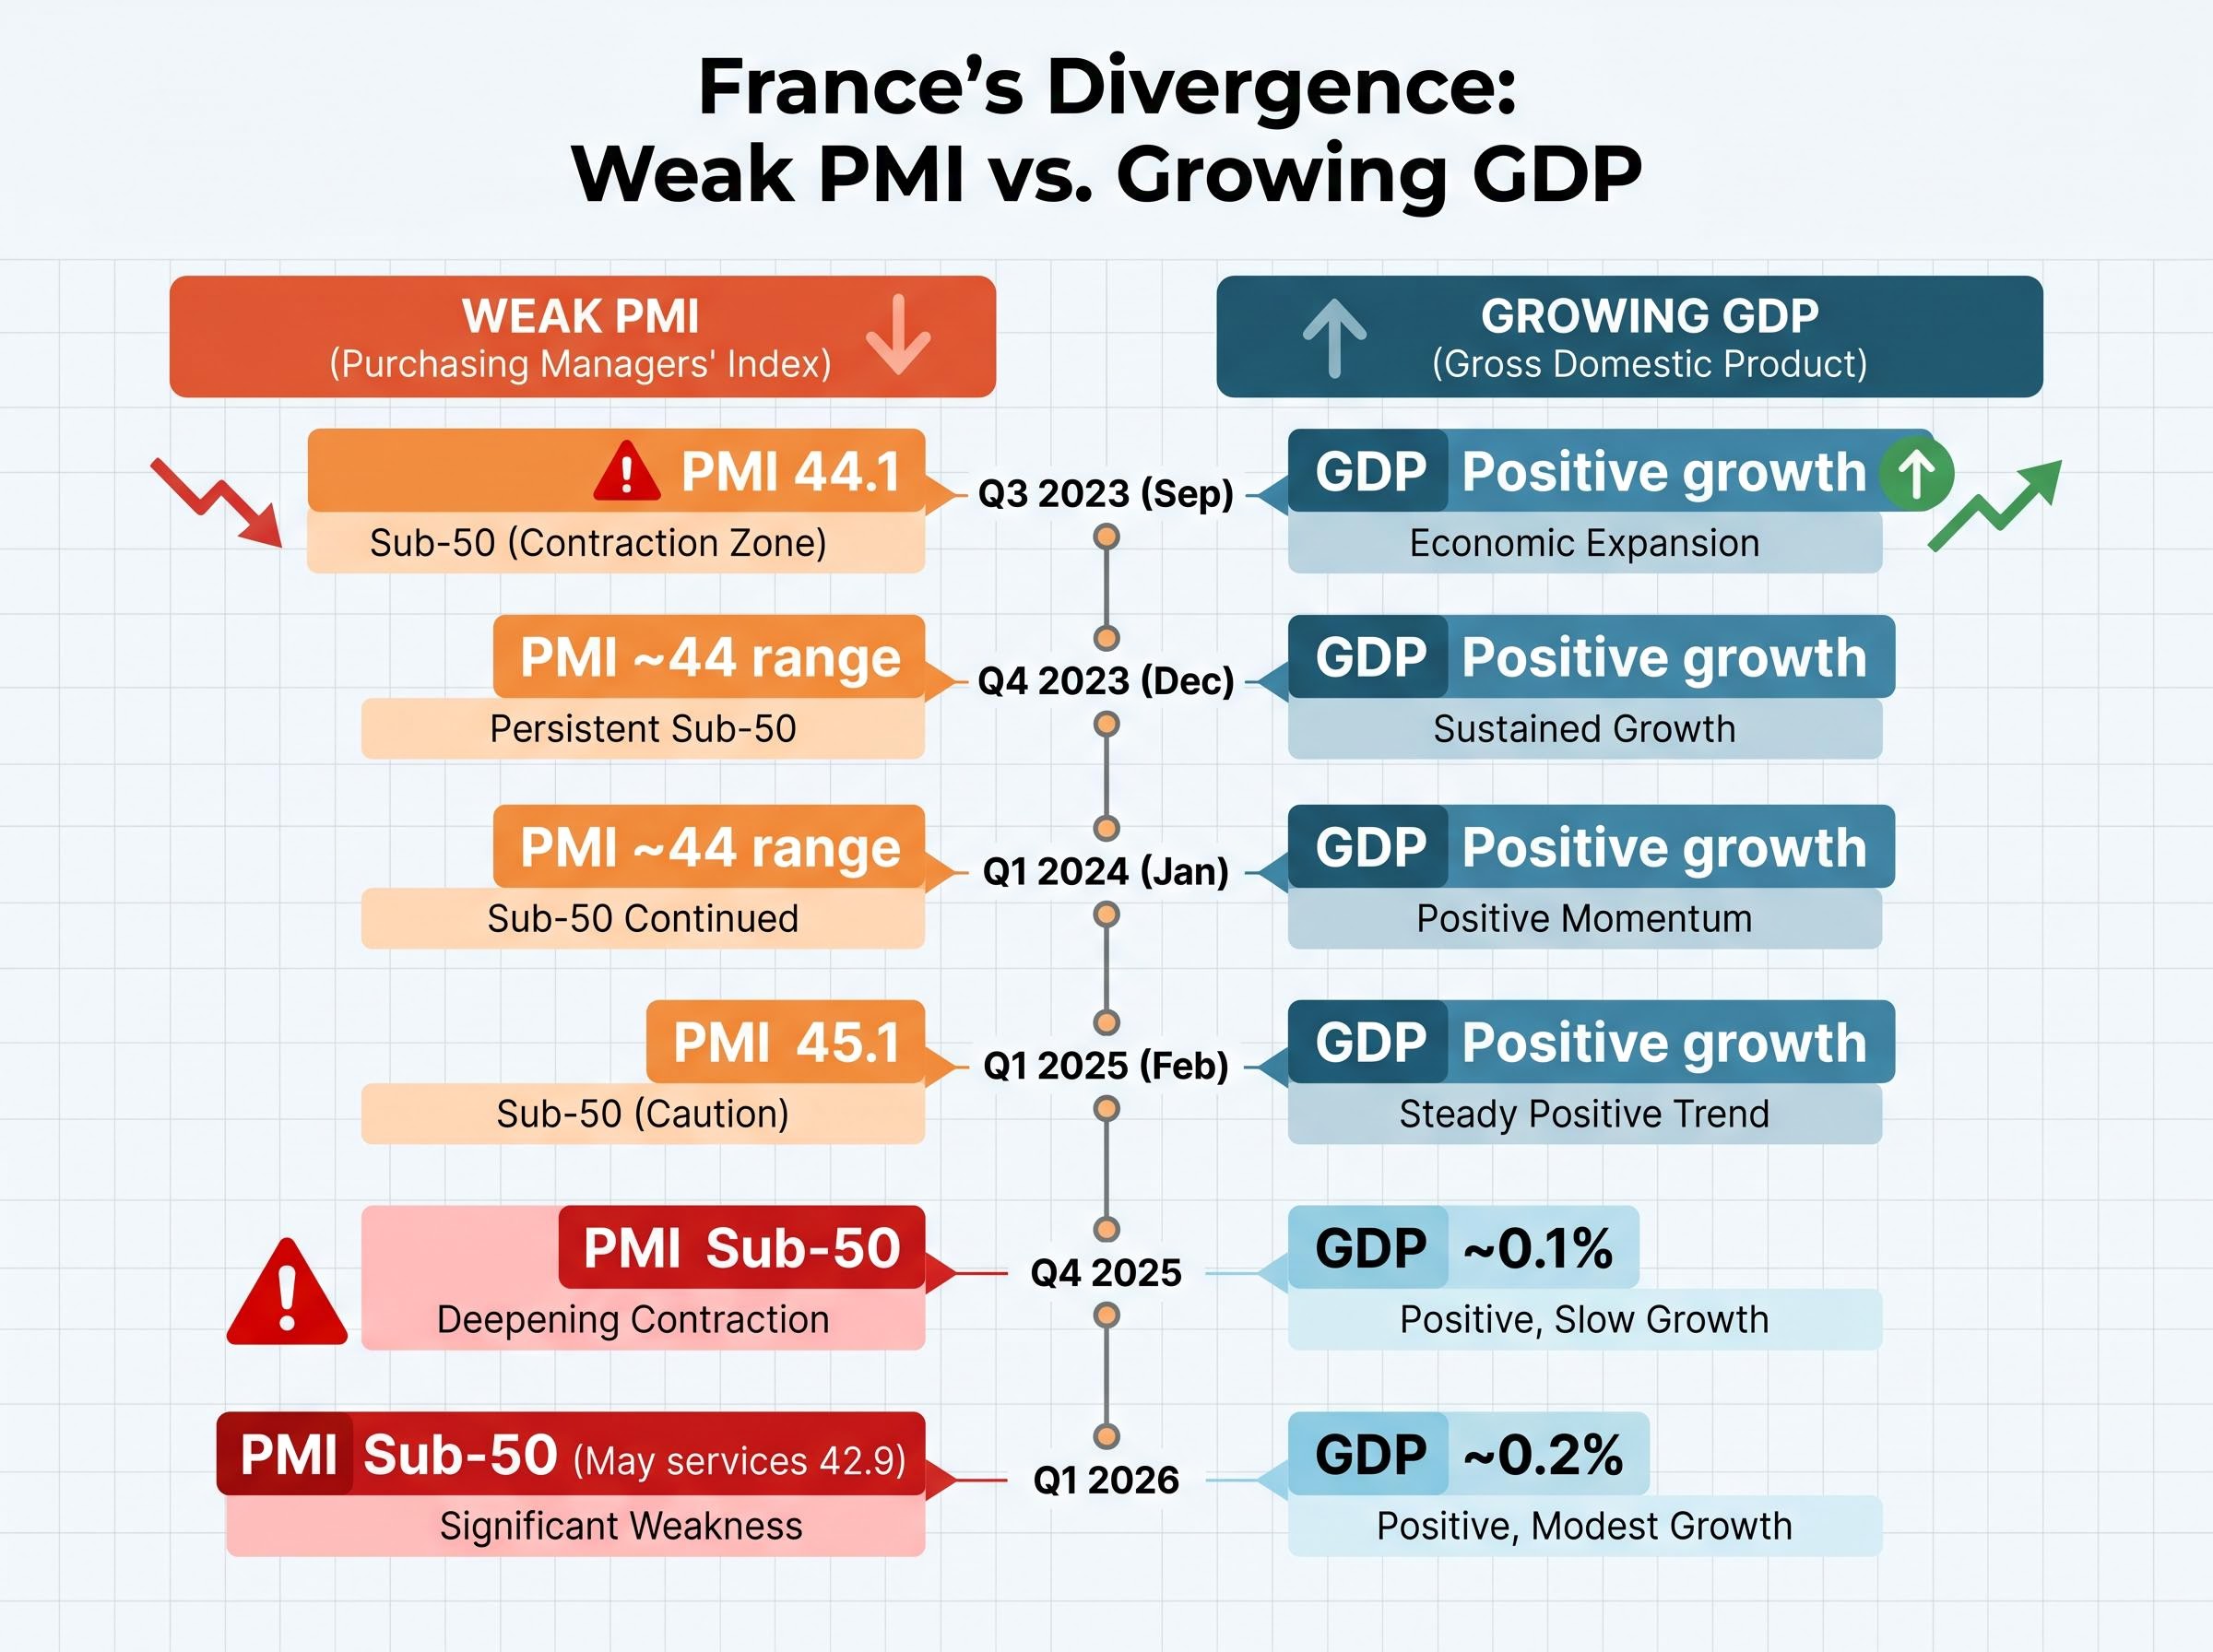
| Period | France Composite PMI | France GDP (q-o-q) |
|---|---|---|
| Q3 2023 (Sep) | 44.1 | Positive growth |
| Q4 2023 (Dec) | ~44 range | Positive growth |
| Q1 2024 (Jan) | ~44 range | Positive growth |
| Q1 2025 (Feb) | 45.1 | Positive growth |
| Q4 2025 | Sub-50 | ~0.1% |
| Q1 2026 | Sub-50 (May services: 42.9) | ~0.2% |
The pattern is not ambiguous. Over more than two years of sub-50 PMI readings, France avoided a technical recession. The indicator captured genuine weakness in business sentiment. It did not capture what actually happened to output.
The May 2026 data do not sit in isolation: the global PMI fault lines visible in April 2026 already showed the eurozone’s services sector collapsing to 47.4 while the US and UK held above 50, a split that makes France’s and the UK’s May prints the continuation of a regional divergence rather than a sudden deterioration.
The UK’s prior false alarms: 2023, 2019, and the decade before
The UK’s May 2026 composite PMI of 48.5 and services reading of 47.9 arrived with familiar urgency. The numbers looked weak. The pattern, however, looked familiar.
In September 2023, the UK composite PMI hit 48.5 and services fell to 49.3. Commentary turned sharply negative. A sustained downturn did not follow. In April 2025, the composite slipped to 48.4 and services to 49.0. GDP, as measured by the Office for National Statistics (ONS), continued to record flat to marginally positive quarters.
The pattern extends further back:
- 2018-19: UK composite PMIs fell below 50 during peak Brexit uncertainty. The UK did not enter a technical recession.
- 2011-12: Sub-50 readings appeared alongside elevated political uncertainty. Again, no technical recession followed, as the Financial Times noted in a March 2025 analysis of PMI reliability.
- 2023-24: PMIs were consistently below 50 while quarterly GDP hovered around zero or slightly positive, a case Goldman Sachs later cited as a recent false positive.
Goldman Sachs, in a February 2026 edition of its Global Economics Analyst, found that roughly one-third of sub-50 UK composite PMI episodes since 2000 did not lead to recession within four quarters. The bank described these as “false positives.”
The Bank of England’s May 2026 Monetary Policy Committee (MPC) minutes reinforced this pattern. The MPC noted that recent PMIs were “consistent with broadly flat output” but judged the baseline to be “subdued but positive growth rather than a pronounced recession.” The UK’s Q1 2026 GDP came in at approximately 0.1% quarter-on-quarter, according to the ONS first estimate published on 15 May 2026.
The quantified false-positive rate across advanced economies
The French and UK experiences are not isolated cases. Three independent research streams, spanning different geographies, time periods, and methodologies, converge on a consistent finding: sub-50 PMI readings produce false recession signals roughly 30-40% of the time.
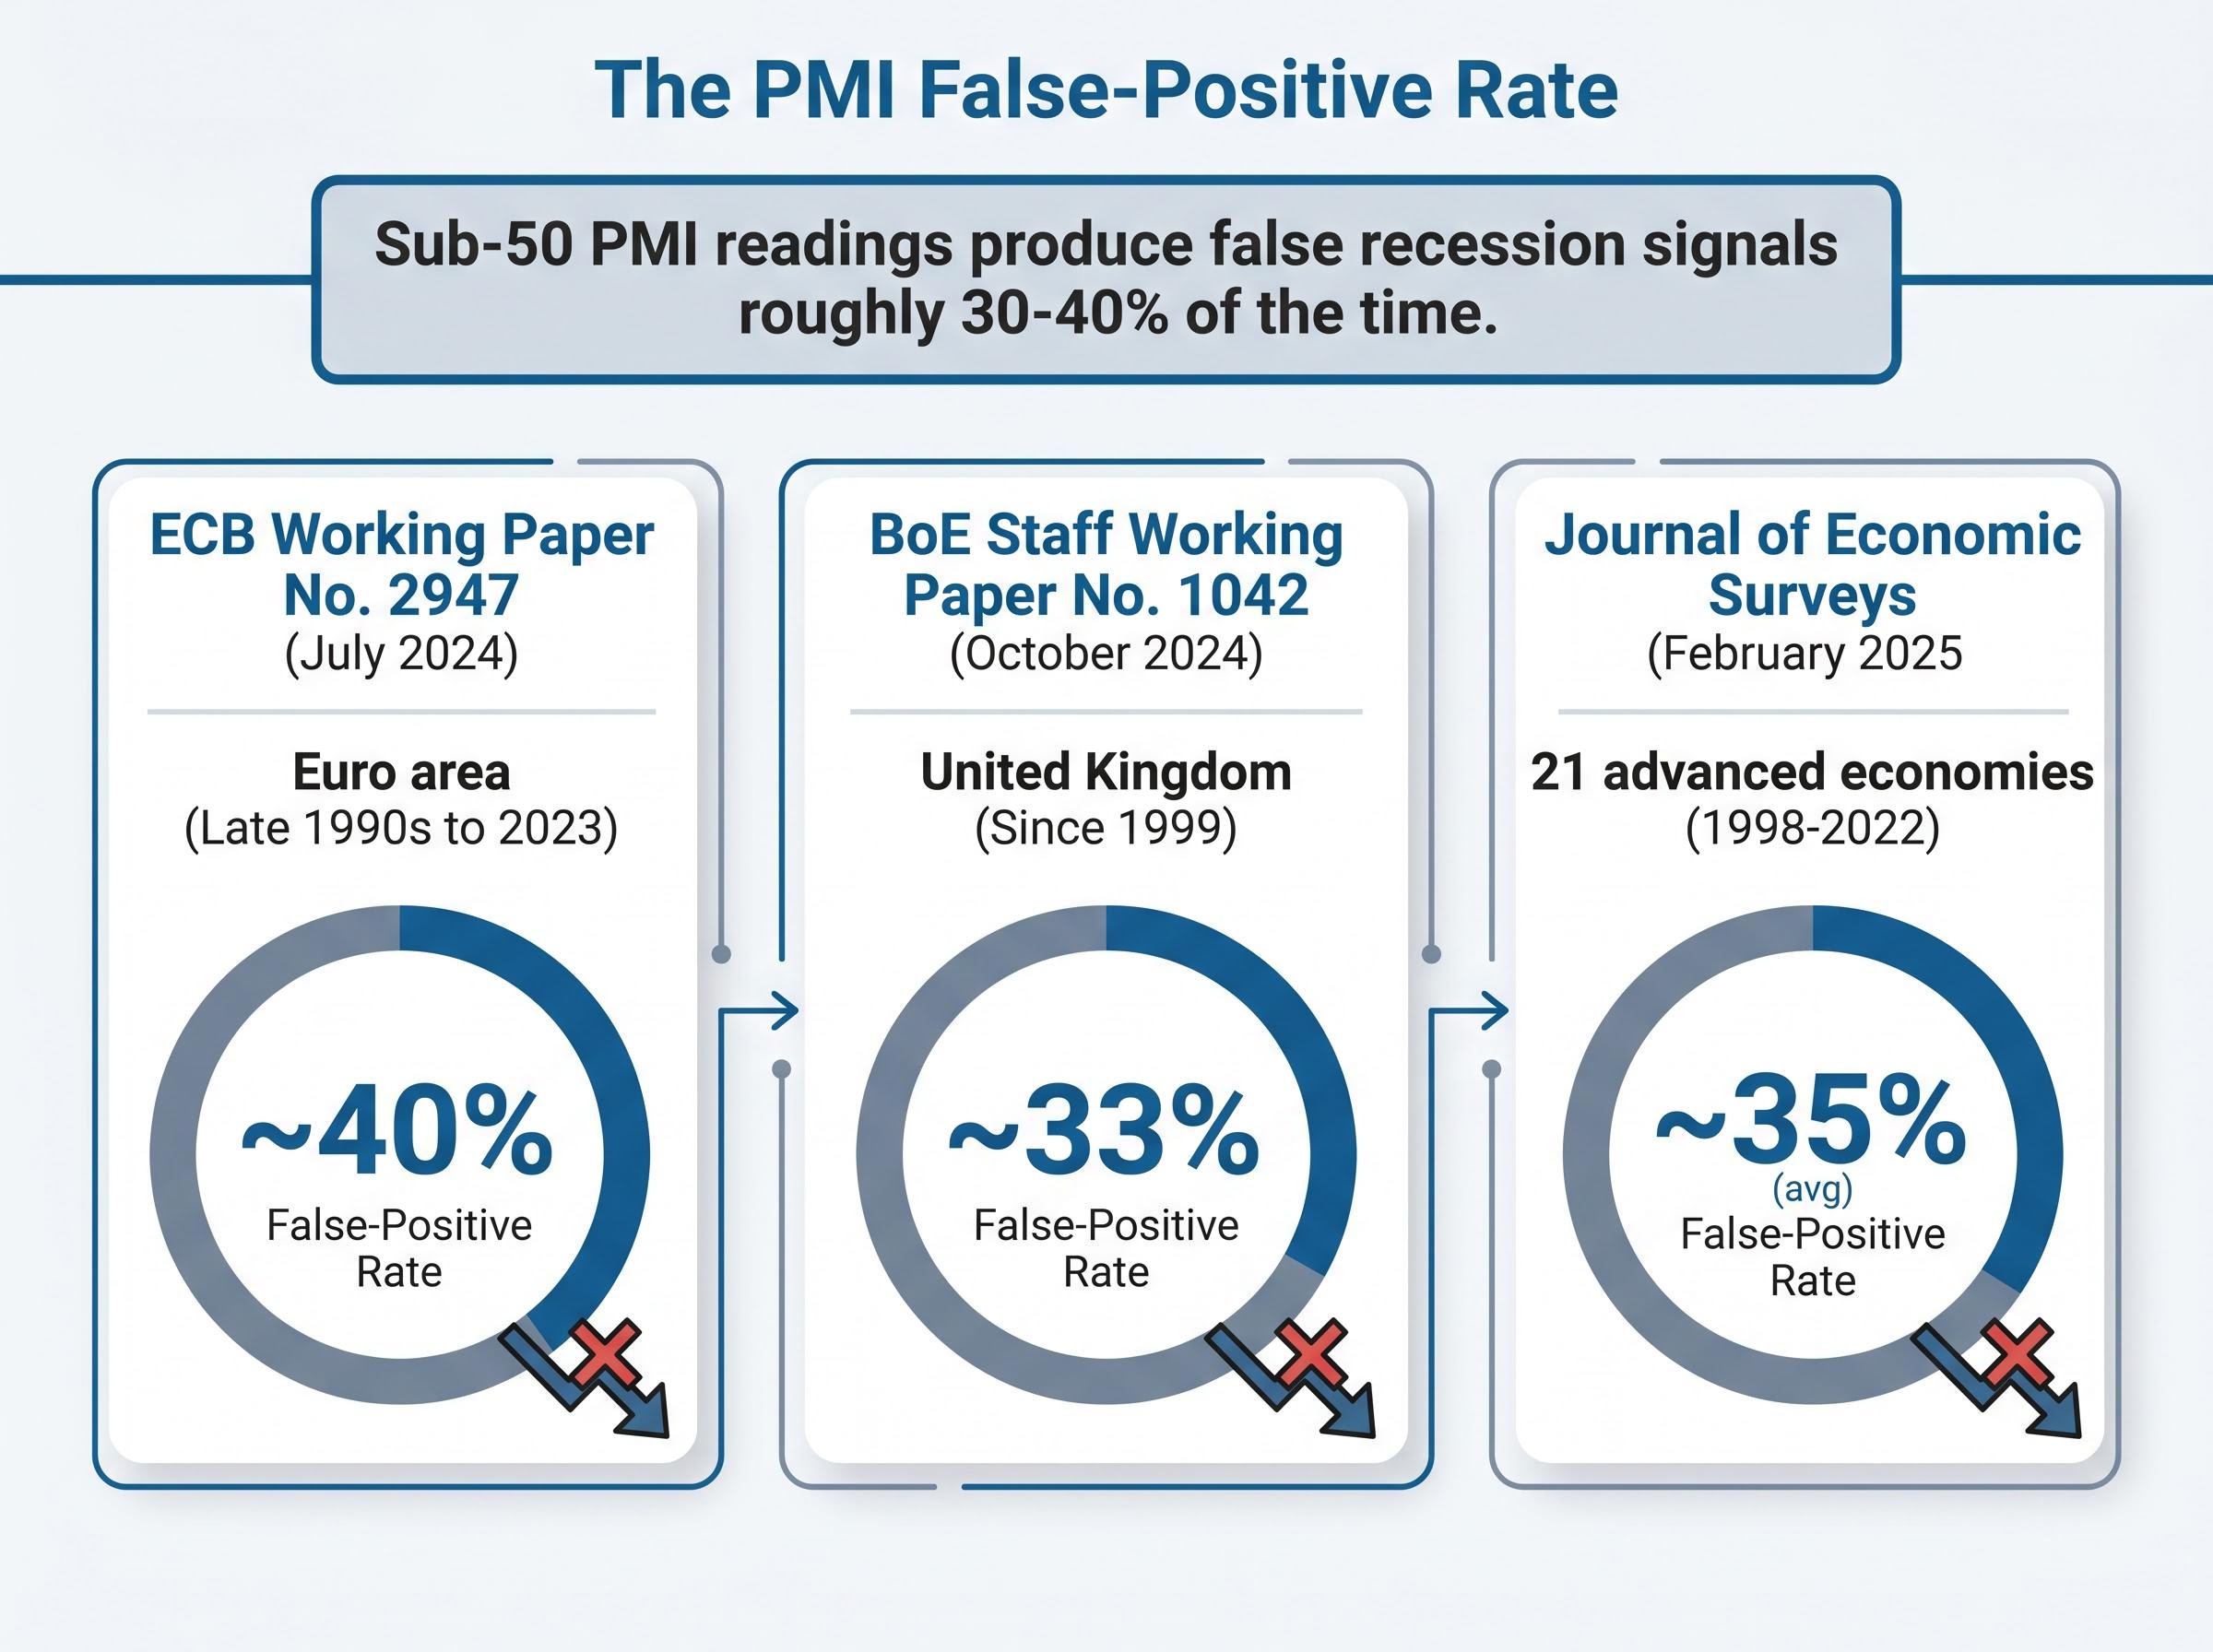
| Source | Geography | Period Studied | Approx. False-Positive Rate |
|---|---|---|---|
| ECB Working Paper No. 2947 (July 2024) | Euro area | Late 1990s to 2023 | ~40% |
| BoE Staff Working Paper No. 1042 (October 2024) | United Kingdom | Since 1999 | ~33% |
| Journal of Economic Surveys (February 2025) | 21 advanced economies | 1998-2022 | ~35% (avg); ~40% (euro area) |
The ECB working paper analysed euro area composite PMI data and found that sub-50 episodes not followed by a technical recession within four quarters occurred in roughly 40% of cases, describing this as “a non-negligible rate of false positive recession signals.” The false-positive rate rose after 2010, coinciding with repeated waves of financial and geopolitical stress.
The Bank of England paper, using a rule of PMI below 50 for at least two consecutive months, arrived at approximately one-third. It noted that “the false-positive rate increases when financial and political uncertainty measures are elevated.”
The academic study, covering 21 advanced economies, reported an average false-positive rate of approximately 35% and concluded that “PMIs contain useful information but should not be used as stand-alone binary recession predictors.”
JPMorgan’s European economics team added a market perspective in October 2025, stating that the hit-rate of sub-50 PMI as a recession signal for the euro area since 2010 is “well below 50%” when technical recession is the benchmark.
The ECB’s Economic Bulletin Issue 8/2025 stated that “survey indicators, including the composite PMI, have on several occasions since 2012 signalled contractions that were not followed by two consecutive quarters of negative GDP growth” at the euro area level, citing 2012-13, 2014, 2018-19, and 2022-23 as specific episodes.
The convergence across a central bank working paper, a national central bank study, and a peer-reviewed journal moves the false-positive observation from anecdote to defensible empirical finding.
The ECB Economic Bulletin analysis of PMI reliability examined the relationship between composite PMI readings and realised euro area GDP, finding that the survey indicator’s predictive accuracy deteriorates meaningfully during periods of elevated financial and geopolitical stress, precisely the conditions present in recent years.
Why geopolitical shocks make PMIs especially unreliable right now
The structural false-positive rate identified above is not uniform across all periods. It rises during geopolitical stress, and May 2026 is precisely such a period.
The mechanism is the sentiment channel. PMI surveys capture expectations alongside current conditions. During episodes of acute uncertainty, respondents report anticipated deterioration that may not materialise, pulling readings below what concurrent hard activity data would imply. This is not a flaw respondents introduce deliberately; it is a structural feature of how qualitative surveys absorb fear.
S&P Global’s own May 2026 PMI commentary, covering both the eurozone and UK releases published on 23 May 2026, identified this dynamic directly. The chief business economist stated that “while the PMI continues to provide a timely guide to monthly changes in output, the current gap with official data suggests surveys may be amplifying fears rather than hard activity trends.” Both releases cited Iran conflict-linked energy-price volatility and geopolitical uncertainty as factors depressing business expectations.
“The current gap with official data suggests surveys may be amplifying fears rather than hard activity trends.” — S&P Global chief business economist, May 2026 PMI release
Three specific mechanisms amplify PMI pessimism during geopolitical shocks:
- Expectation bias in survey design: Respondents weight anticipated future conditions into current-month responses, particularly when energy costs and trade disruption risks are elevated.
- Energy-cost pass-through fears: French services firms in May 2026 explicitly attributed lower output readings to war-related energy and fuel cost pressures, even where those costs had not yet fully materialised in margins.
- Decision deferral reported as contraction: Firms postponing investment or hiring decisions during uncertainty report “no change” or “deterioration” rather than the positive readings that would have accompanied normal activity.
The International Monetary Fund’s April 2026 World Economic Outlook found that PMI-based models over-predicted GDP slowdowns during major geopolitical episodes, concluding that “the signal-to-noise ratio of survey indicators may be lower in periods of acute uncertainty.”
The OECD’s March 2026 Interim Report added that “heightened uncertainty appears to amplify downside bias in qualitative surveys relative to realised activity.” The Financial Times, writing on 25 May 2026, framed the broader issue: “the proliferation of geopolitical shocks from Ukraine to Iran has made survey-based gauges more volatile and pessimism-biased.”
The implication for current readings is clear. The 30-40% false-positive rate documented in calmer periods is likely to be at the upper end of its range in May 2026.
Seven structural buffers limiting recession transmission, including IT investment at an all-time high of 4.9% of global GDP in Q1 2026, explain why hard activity data has held up even as PMI surveys amplify geopolitical fear, though BCA Research flags June 2026 as the month where several of those buffers begin to expire simultaneously.
How to read PMI data without letting it mislead you
A sub-50 PMI reading is not meaningless. It is a timely, high-frequency signal that GDP data, released with a lag, cannot match. The problem is not the indicator itself; the problem is treating it as something it was never designed to be: a binary recession verdict.
The following steps provide a framework for reading PMI releases with appropriate calibration:
- Check the accompanying hard data. Compare the PMI print against the most recent GDP, industrial production, and retail sales figures. If hard data show flat or marginally positive activity while PMIs signal contraction, the divergence itself is informative.
- Identify which sub-indices drove the headline. Output sub-indices reflect current conditions. Expectation sub-indices reflect sentiment about the future. The latter are significantly more prone to distortion during geopolitical uncertainty.
- Assess the geopolitical context. If a major conflict, energy disruption, or trade dispute is dominating business news, apply a discount to the headline reading. Research from the IMF and OECD supports this adjustment.
- Compare with labour market data. Employment indicators tend to be stickier than sentiment surveys. If unemployment is stable or falling while PMIs are contracting, the survey may be overstating weakness.
- Check institutional baseline forecasts. Central banks and multilateral institutions publish their recession probability assessments. If none treats the current PMI weakness as a recession call, that consensus carries weight.
What the institutions are actually saying about recession risk right now
- ECB (May 2026 press conference): “Hard data for the first quarter point to slightly positive growth in the euro area as a whole.” Surveys “have on several occasions painted a darker picture than subsequently realised outcomes.”
- Bank of England (May 2026 MPC): Baseline is “subdued but positive growth rather than a pronounced recession.”
- IMF (April 2026 WEO): PMIs “are not, in our baseline, indicative of a deep recession.”
- OECD (March 2026 Interim Report): “A mild recession cannot be ruled out if shocks intensify, but this is not the central scenario.”
A Reuters survey of economists published on 24 May 2026 found that a majority expected the euro area to avoid a technical recession in 2026 despite sub-50 PMIs, with several describing the readings as “too pessimistic” relative to labour market and retail sales data.
Investors wanting to position across this divergence will find our deep-dive into the three-speed global economy framework, which maps the US soft landing, Asian expansion, and contracting eurozone against ECB rate cut probabilities and institutional Q2 2026 forecasts, providing the allocation context that PMI data alone cannot supply.
PMI is a speedometer, not a crash detector
Sub-50 PMI readings signal that more firms are decelerating than accelerating. They do not signal that an economy is about to contract severely. History supports treating them as a caution flag rather than an alarm, and the data are not close on this point: a 30-40% false-positive rate, rising during periods of geopolitical stress, is not a marginal finding.
What PMIs do well is provide timely, high-frequency information about directional momentum. That value is real and should not be discarded. The indicator fills a gap that quarterly GDP data, published weeks or months after the fact, cannot.
France and the UK are both slowing. Both face genuine headwinds from geopolitics and energy costs. Both deserve continued monitoring. But the May 2026 PMI prints, viewed alongside Q1 2026 GDP data, institutional baseline forecasts from the ECB, Bank of England, IMF, and OECD, and a documented track record of false alarms, do not on their own constitute a recession verdict. The next time a flash PMI release generates a recession headline, the harder counterweights are available: INSEE’s quarterly accounts, the ONS GDP estimates, and the institutional forecasts that contextualise what the survey data alone cannot.
This article is for informational purposes only and should not be considered financial advice. Investors should conduct their own research and consult with financial professionals before making investment decisions. Past performance does not guarantee future results. Financial projections are subject to market conditions and various risk factors.