Why AI Infrastructure, Not Chips, Is Where Durable Value Sits
25 mins ago

The number 50 is not a financial target or a market threshold. It is the line between an economy that is growing and one that is shrinking, and in April 2026 it split the world’s major economies in ways that matter far beyond a single data release. S&P Global released flash Purchasing Managers’ Index (PMI) estimates on 23 April and finalised readings by 1 May, delivering a snapshot of global economic health at a moment when a Middle East conflict, now two months old, has rattled supply chains, compressed consumer confidence, and prompted a half-percentage-point cut to the 2026 global real GDP growth forecast. That forecast now sits at 2.4%, a level that would represent the weakest annual expansion since 2009 outside of pandemic years. Against that backdrop, the regional divergences embedded in the April PMI data carry unusual weight. This analysis decodes what those readings reveal about the shape of the global economy entering Q2, explains why the eurozone’s services contraction is the most consequential single data point in the release, and draws out the policy and market implications that follow from the regional split.
A single index number moves bond markets, shifts central bank expectations, and generates pages of analyst commentary within hours of its release. The reason is mechanical: the PMI captures economic direction before almost anything else does.
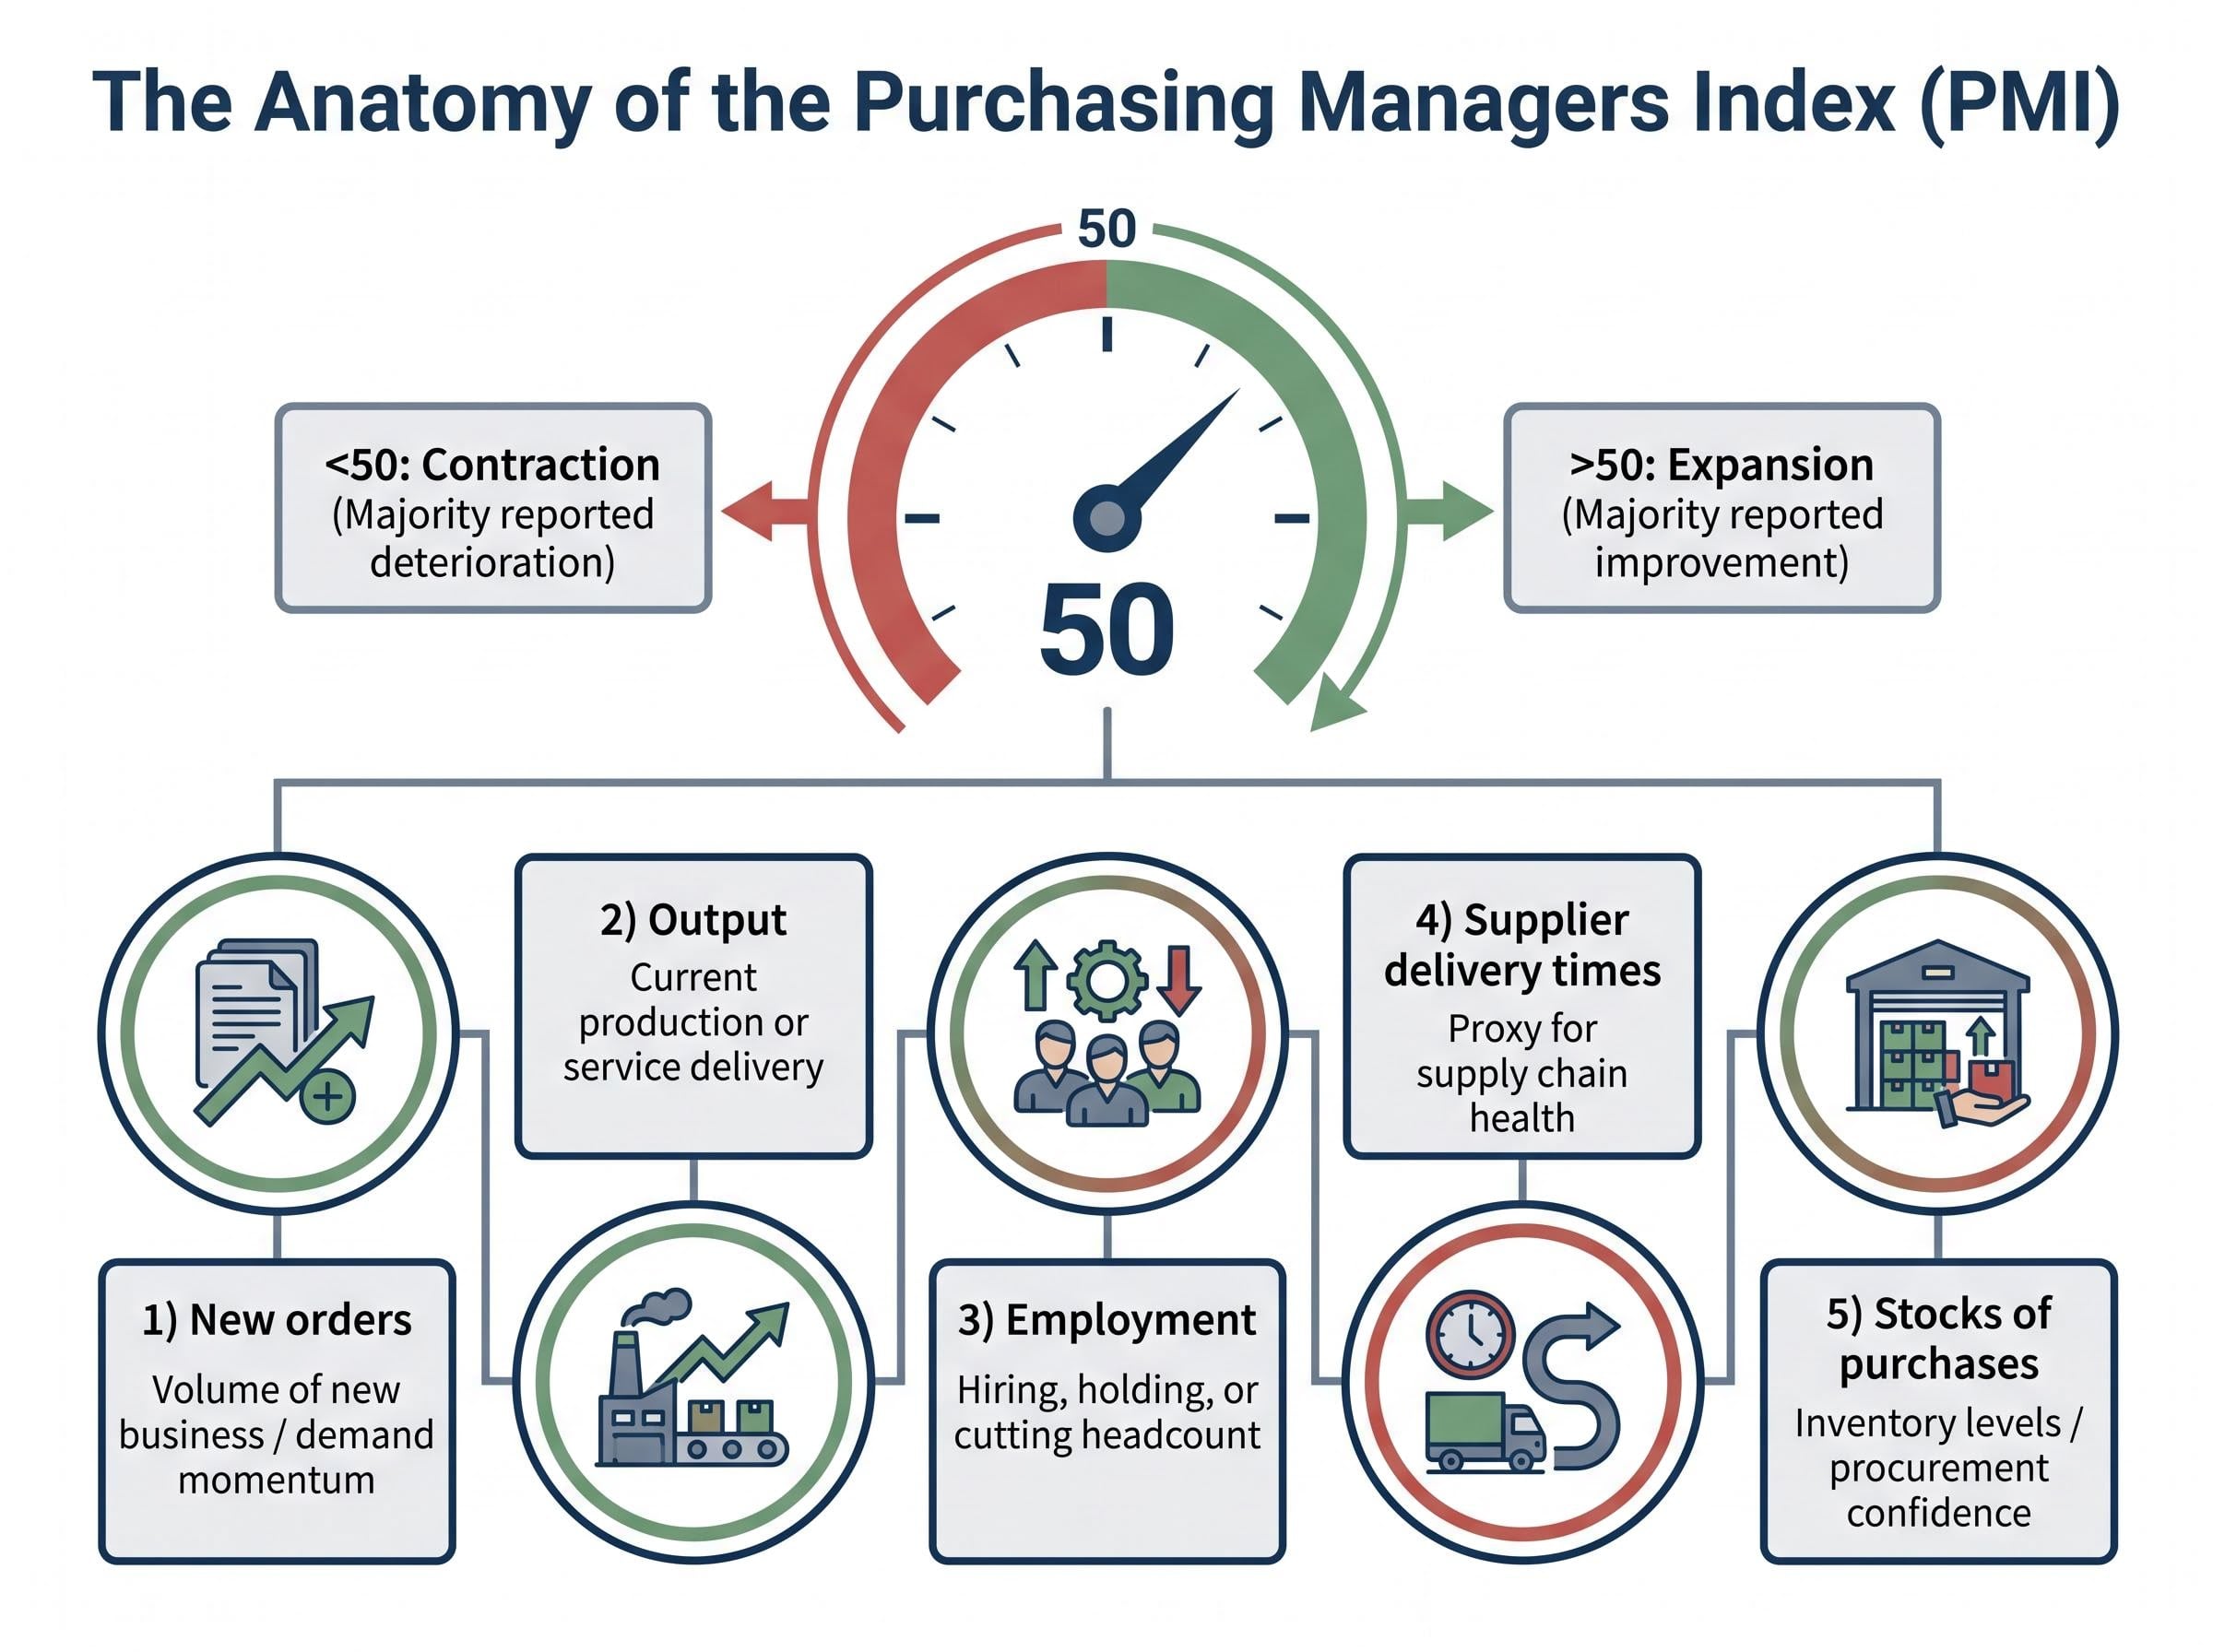
The Purchasing Managers’ Index is a diffusion index compiled from monthly surveys of corporate purchasing managers across manufacturing and services sectors in each economy. Respondents report whether conditions improved, stayed the same, or deteriorated relative to the prior month. A reading above 50 indicates the majority reported improvement; below 50 signals the majority reported deterioration. The threshold is binary: it separates expansion from contraction in real time, months before GDP data confirms the trend.
Each PMI survey aggregates five sub-components:
The S&P Global PMI survey methodology specifies that the diffusion index is constructed by weighting each of the five sub-components and aggregating responses into a single headline figure, a design choice that makes the 50 threshold a precise mechanical dividing line rather than an approximate rule of thumb.
Global growth context: S&P Global’s 2026 real GDP growth forecast of 2.4%, cut by 0.5 percentage points from its prior estimate, would mark the weakest annual expansion since 2009 excluding pandemic years. This is the backdrop against which April’s PMI readings should be evaluated.
Because PMI is a leading indicator, capturing sentiment and activity before GDP data arrives, it functions as one of the clearest early-warning systems available to investors and central banks alike. Reading it correctly removes the lag that comes with waiting for quarterly GDP confirmation.
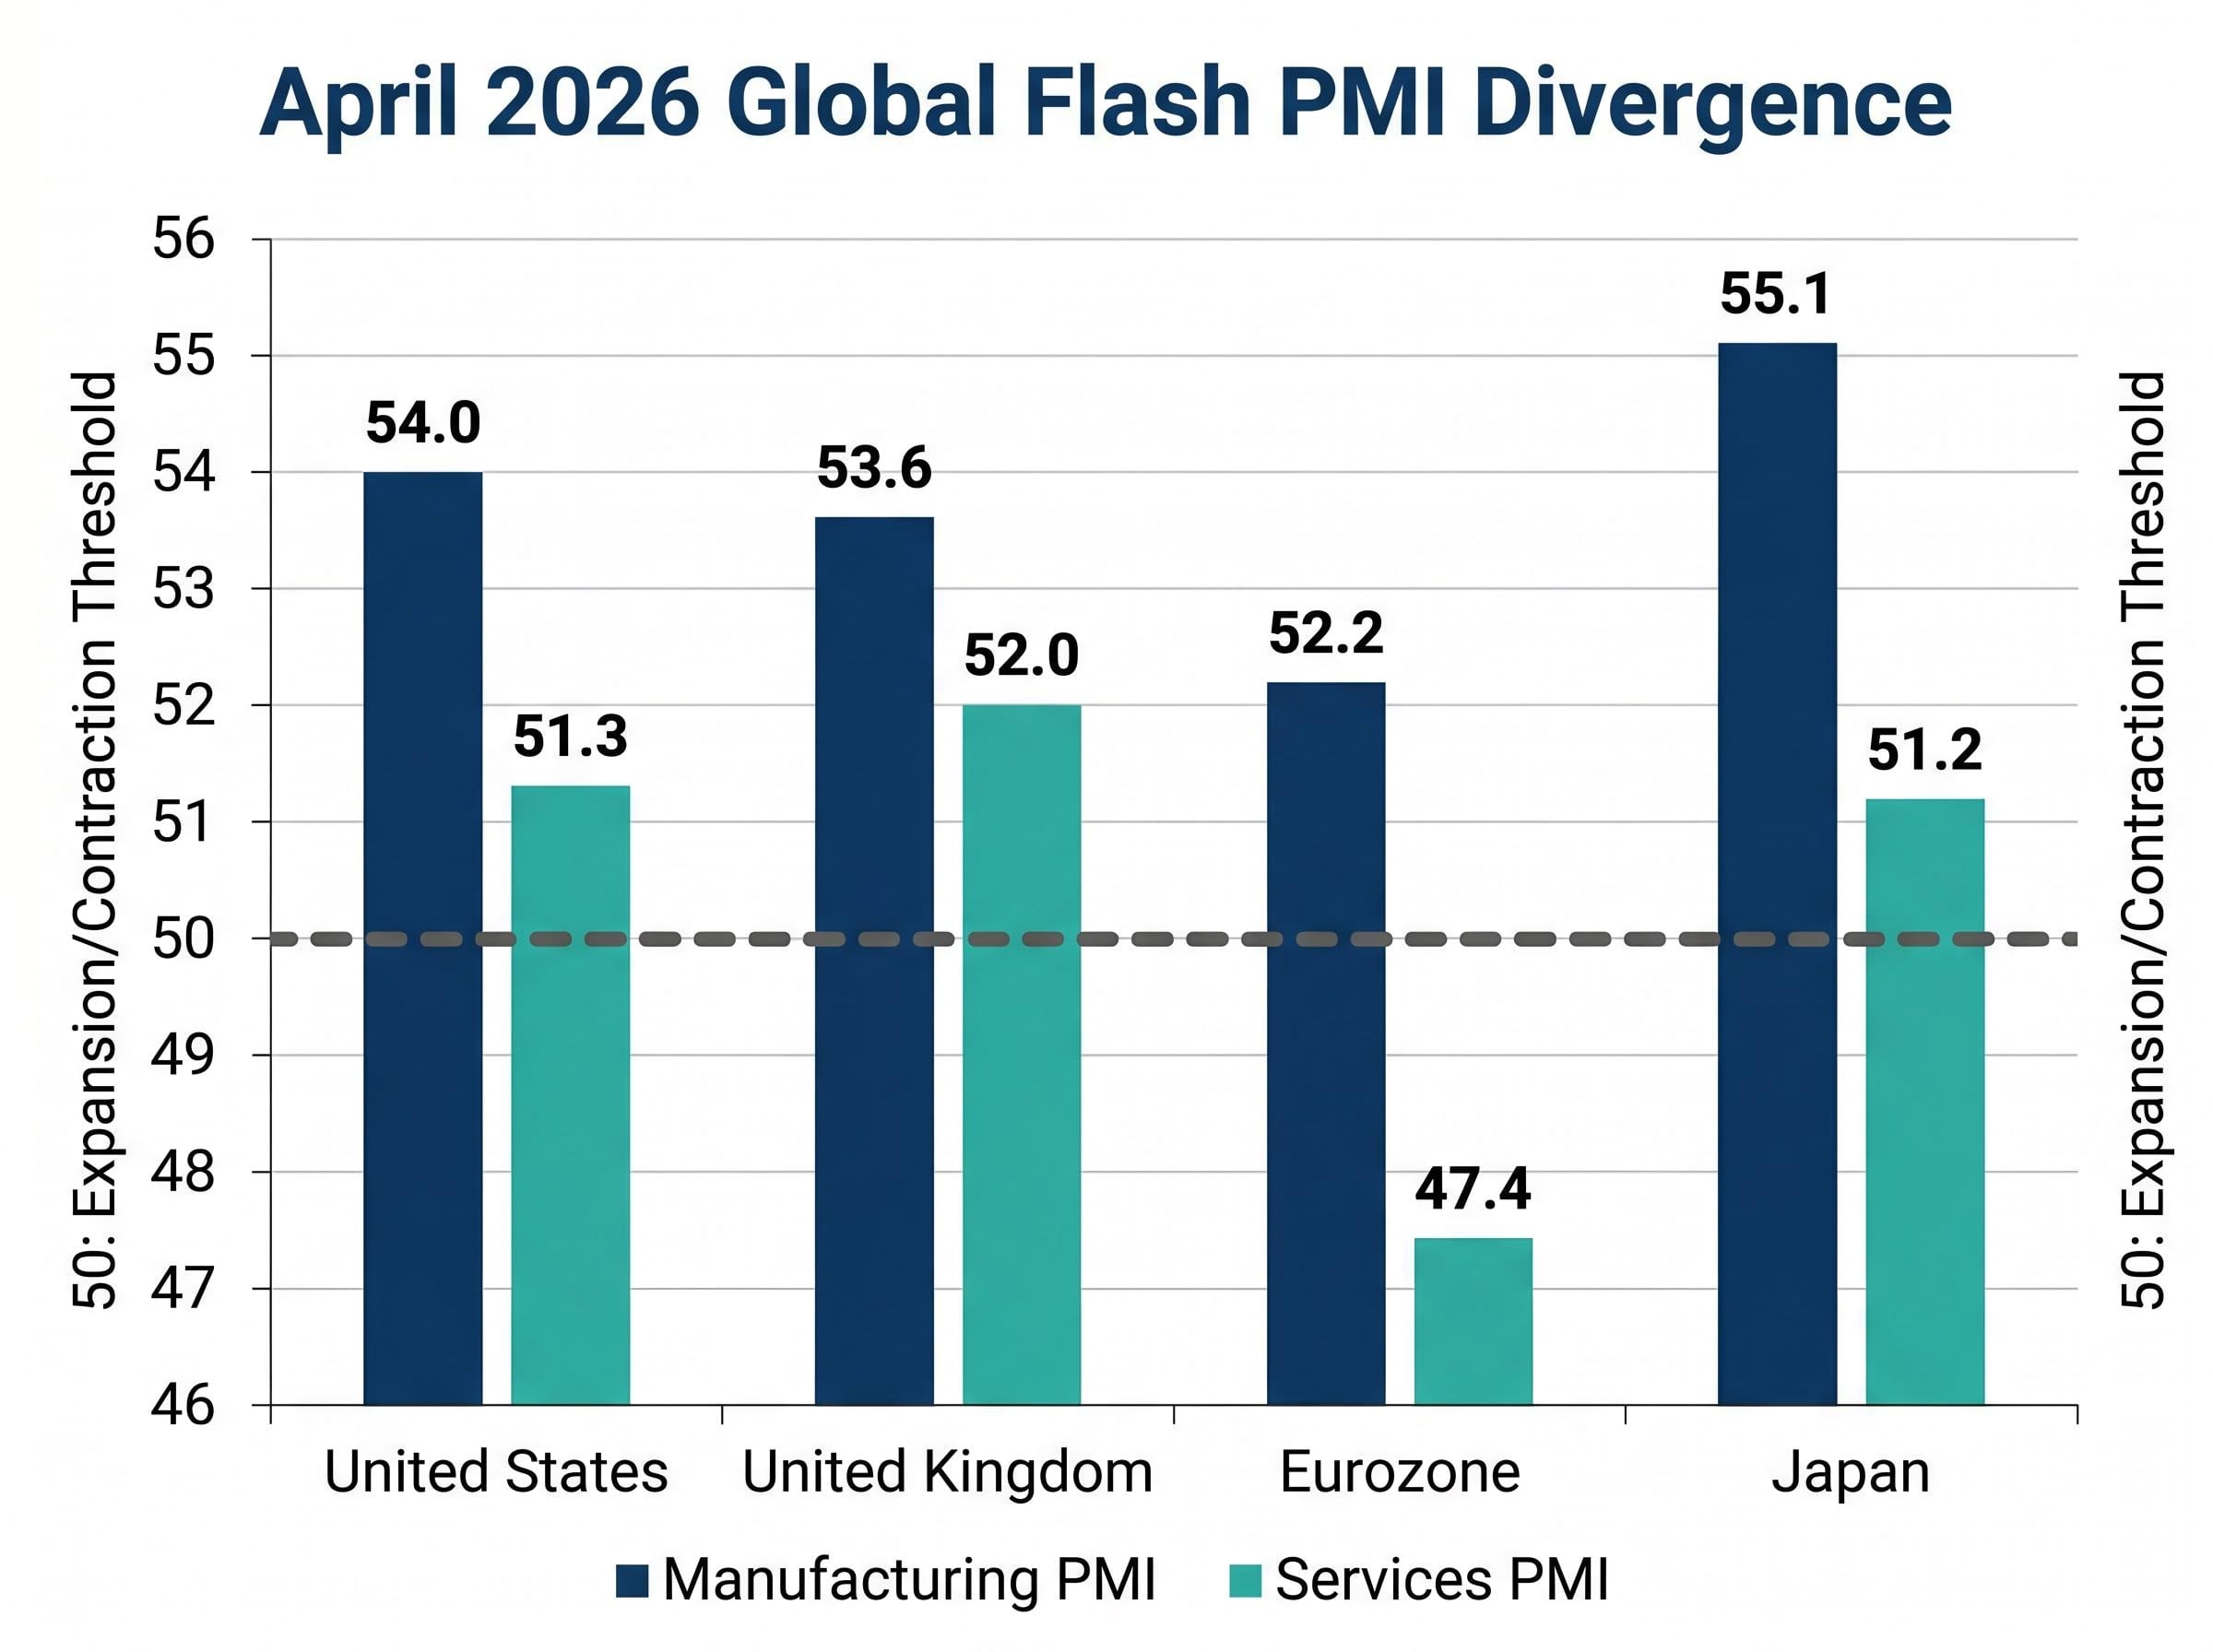
The United States posted an April flash Manufacturing PMI of 54.0 and a Services PMI of 51.3. Both exceeded analyst expectations and sat comfortably above the expansion threshold. The manufacturing reading was particularly notable given that the US Services PMI had dipped to 49.8 in March; the April rebound back above 50 suggested domestic demand had absorbed the initial geopolitical shock rather than buckling under it.
Supporting data reinforced the picture. US March retail sales rose 1.7% month-on-month and 4.0% year-on-year, pointing to a consumer base that remained active despite elevated uncertainty.
The fragile US consumer backdrop adds a layer of qualification to the Anglo-American expansion story: retail sales growth of 1.7% month-on-month in March was partly funded by savings drawdowns rather than income gains, meaning the spending resilience visible in PMI services readings may be less durable than the headline figures suggest.
The United Kingdom told a similar story. April flash readings came in at 53.6 for manufacturing and 52.0 for services. UK inflation data provided context for the Bank of England’s cautious stance: March CPI registered 0.7% month-on-month and 3.3% year-on-year, with core CPI at 0.4% monthly and 3.1% annually. The UK unemployment rate of 4.9% in February 2026 came in below consensus, and March retail sales of 0.7% monthly and 1.7% annually confirmed household spending had not stalled.
| Economy | Manufacturing PMI | Services PMI | Status |
|---|---|---|---|
| United States | 54.0 | 51.3 | Expansion (both) |
| United Kingdom | 53.6 | 52.0 | Expansion (both) |
The pattern is not coincidental. Both economies benefit from relatively tight labour markets, consumer spending resilience, and central banks with policy headroom to hold rates steady rather than cut into weakness. The Federal Reserve’s decision to hold reflects US expansion; the Bank of England’s caution reflects domestic inflation that has not yet eased enough to justify loosening. For investors, the Anglo-American PMI cluster above the expansion threshold signals that domestic demand has not buckled under geopolitical pressure, supporting the case for continued equity market resilience in these regions relative to the eurozone.
The same economy posted a manufacturing expansion and a services contraction in the same month. That sentence alone should prompt closer inspection.
Eurozone April flash Manufacturing PMI came in at 52.2, placing it in expansion territory. Services PMI registered 47.4, firmly in contraction. The 4.8-point gap between the two readings sits on opposite sides of the neutral line, a divergence that is more alarming than reassuring once the structural composition of the eurozone economy is considered.
The services sector employs a larger share of the eurozone workforce than manufacturing. A sub-50 services reading has outsized consequences for consumer income, household confidence, and downstream GDP because the sector where most people work and spend is the sector that is shrinking. The March services reading of 50.1 had already signalled near-stagnation; April’s drop to 47.4 confirmed the deterioration was accelerating rather than stabilising.
Hard economic data validated the signal. Eurostat’s flash estimate, released on 30 April 2026, showed eurozone Q1 GDP growth of just 0.1% quarter-on-quarter, down from 0.2% in Q4 2025.
Eurostat’s flash GDP estimate, published on 30 April 2026, confirmed that seasonally adjusted output in the euro area grew by just 0.1% quarter-on-quarter in Q1, placing the official statistical measure alongside the PMI signal in pointing toward stagnation rather than recovery.
The eurozone’s Q1 GDP growth of 0.1% quarter-on-quarter confirms what the services PMI had been signalling for two consecutive months: the region is not merely slowing but approaching genuine stagnation.
Three structural demand drivers sit behind the services weakness:
The eurozone’s services contraction is the most consequential single data point in the April PMI release. It closes the loop between forward-looking sentiment surveys and backward-looking GDP output, confirming that the region faces stagnation risk that is now visible in both.
Japan’s final April Manufacturing PMI of 55.1, revised upward from a flash estimate of 54.9, represents the strongest manufacturing growth reading in four years.
Headline figure: Japan’s April Manufacturing PMI of 55.1 marks the strongest manufacturing expansion the country has recorded since 2022, accompanied by a Services PMI flash reading of 51.2.
The number is striking. It is also incomplete without context.
The primary mechanism behind the surge is stockpiling. Japanese manufacturers have been building inventory buffers in anticipation of supply chain disruptions linked to the Middle East conflict. March trade data supports this interpretation: exports rose 11.7% year-on-year and imports climbed 10.9% year-on-year, both above consensus, reflecting elevated procurement activity rather than a sudden spike in end-market consumer demand.
The three-stage logic runs as follows:
The forward risk is direct: if Middle East supply chain concerns ease, the stockpiling demand that lifted the PMI could reverse within months, turning a manufacturing tailwind into a headwind. Yen volatility adds a compounding layer of uncertainty.
Japan’s inflation backdrop remained relatively contained, with March CPI at 0.4% month-on-month and 1.5% year-on-year, and core-core inflation easing to 2.4% annually. Investors tempted to read 55.1 as a clean positive should weigh the precautionary nature of the demand behind it; the manufacturing strength is real but may be front-loaded, with direct implications for Japanese equities exposed to industrial production cycles.
The chain from PMI data to portfolio implications runs through central bank signalling. April’s readings have sharpened the policy divergence between the world’s major monetary authorities.
Markets are pricing in European Central Bank (ECB) rate cuts as the eurozone’s services contraction and near-zero GDP growth leave policymakers with little justification for holding rates steady. The Federal Reserve, by contrast, faces no such pressure: US Manufacturing PMI at 54.0 and Services PMI at 51.3 describe an economy still expanding, making rate cuts unnecessary and potentially inflationary.
This policy split has already begun widening bond yield spreads between the US and eurozone. Anglo-American equities are outperforming eurozone equities as capital flows reflect the divergence in growth expectations and monetary trajectories.
Global inflation expectations have been materially repriced since February 2026, with crude oil above $100 per barrel forcing institutional investors to reassess capital allocation strategies across commodity exposure, high-margin equities, and duration positioning in fixed income portfolios.
| Region | Mfg PMI (Apr) | Services PMI (Apr) | Central Bank Stance | Market Implication |
|---|---|---|---|---|
| United States | 54.0 | 51.3 | On hold | Equity resilience supported |
| United Kingdom | 53.6 | 52.0 | Cautious hold | Aligned with US resilience |
| Eurozone | 52.2 | 47.4 | Rate cuts priced in | Equity underperformance |
| Japan | 55.1 | 51.2 | Monitoring stockpiling effect | Strength may be front-loaded |
The global growth forecast cut to 2.4% sets a ceiling on any broad risk-on rally. Regional selection, rather than blanket market exposure, is the analytical implication of the April data. For investors managing internationally diversified portfolios, the PMI snapshot provides a data-grounded framework for understanding why regional allocation decisions carry more weight in Q2 2026 than directional bets on global growth as a whole.
Across all four major regions, manufacturing and services PMIs diverged sharply in April. In every case, the services reading was the more consequential signal for domestic economic health, consumer income, and GDP trajectory.
The eurozone’s March services reading of 50.1 had already flagged the Q1 GDP outcome two months before Eurostat published it. That predictive accuracy illustrates precisely why services PMI deserves more investor attention than manufacturing readings for the remainder of 2026. The primary risk transmission mechanism from the Middle East conflict runs through consumer confidence and services demand, not through industrial output.
Australia illustrates how aggregate GDP figures can obscure a GDP per capita recession, with headline output growing at 2.6% in Q4 2025 while per capita growth registered only 0.4%, a distinction that mirrors the analytical gap the April PMI data exposes between manufacturing headlines and the services sector conditions that determine most households’ economic reality.
With the global growth forecast at 2.4%, any further deterioration in eurozone services PMI, or a softening in US services, would shift the probability distribution meaningfully toward a weaker-than-expected year. Knowing which sub-component to weight most heavily is the kind of analytical edge that separates informed investment decisions from reactive headline-reading, and April 2026‘s pattern makes the answer unusually clear.
April 2026 PMI data does not describe a global contraction. It describes a bifurcation. Anglo-American economies are holding expansion momentum across both manufacturing and services, while the eurozone has crossed into services contraction with GDP growth barely registering above zero. Japan’s manufacturing strength, while headline-worthy, carries the qualification that precautionary stockpiling, rather than organic end-demand, is the primary driver.
Three analytical lenses emerge from the data for Q2 2026: regional differentiation in growth trajectories, policy divergence between central banks responding to opposite economic signals, and services-sector monitoring as the most reliable forward indicator of domestic economic health.
The May PMI releases and confirmed Q1 GDP figures will either validate or challenge this divergence pattern, making the next data cycle particularly significant. The line at 50 will matter just as much next month. Where each economy falls relative to it, particularly in services, will determine whether April’s bifurcation deepens or begins to close.
For investors wanting to understand the Federal Reserve’s specific policy constraints in depth, our full explainer on the divided Fed outlook examines the four FOMC dissenting votes recorded at the April 2026 meeting, the 3.3% PCE inflation reading that removes the case for near-term cuts, and the CME FedWatch probabilities that now place a 93% chance of no rate cut in June.
This article is for informational purposes only and should not be considered financial advice. Investors should conduct their own research and consult with financial professionals before making investment decisions. Past performance does not guarantee future results, and economic forecasts are subject to revision based on evolving market conditions.
A PMI (Purchasing Managers' Index) is a diffusion index compiled from monthly surveys of corporate purchasing managers across manufacturing and services sectors. A reading above 50 means the majority of respondents reported improvement, signalling expansion, while a reading below 50 signals contraction, making it one of the clearest real-time early-warning tools available to investors and central banks.
The eurozone posted a manufacturing PMI of 52.2 (expansion) alongside a services PMI of 47.4 (contraction) in April 2026, a divergence confirmed by Eurostat's flash estimate showing Q1 GDP growth of just 0.1% quarter-on-quarter, pointing to genuine stagnation risk driven by demand uncertainty, higher inflation, and deteriorating consumer confidence.
April 2026 PMI readings support overweighting Anglo-American equities, where both manufacturing and services remain above 50, while underweighting eurozone equities where services contraction and near-zero GDP growth are prompting markets to price in ECB rate cuts. Regional differentiation, rather than broad global exposure, is the key analytical implication of the data.
Japan's Manufacturing PMI of 55.1, the strongest reading in four years, is primarily driven by precautionary stockpiling as manufacturers build inventory buffers against Middle East supply chain disruptions, rather than organic end-market demand. If supply chain concerns ease, the stockpiling activity that inflated the PMI could reverse quickly, turning a manufacturing tailwind into a headwind.
The services sector employs a larger share of the workforce than manufacturing in most major economies, meaning services PMI readings have a more direct impact on consumer income, household confidence, and GDP trajectory. The eurozone's services PMI correctly anticipated Q1 2026 GDP stagnation two months before Eurostat's official data confirmed it, illustrating its value as a leading indicator.