Hormuz Prices Have Normalised. Geopolitical Inflation Risk Has Not.
45 mins ago

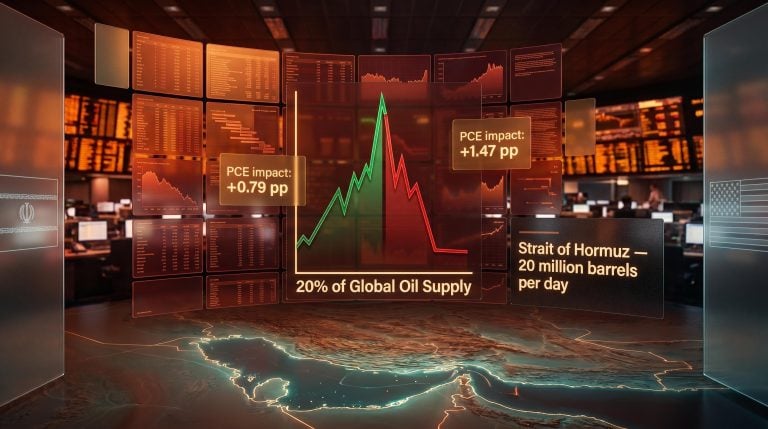
The Strait of Hormuz has been mostly closed since mid-April 2026. Roughly 20% of global oil supply and up to 25% of global liquefied natural gas (LNG) has been cut off. Brent crude hit $142 per barrel on 27 April before pulling back to approximately $113.82 by 5 May. And yet, the global economy has not entered recession. U.S. GDP grew at 2.0% annualised in Q1, China posted 5.0% year-on-year, and purchasing managers’ indices across major economies remain in expansion territory. The gap between the scale of the supply shock and the resilience of macroeconomic data is the central puzzle of the current moment. BCA Research, in a 5 May 2026 report, identified seven structural and cyclical factors buffering the global economy from immediate contraction, while warning that each buffer carries an expiry date. What follows is a structured examination of that framework, its limits, and the specific threshold that could determine whether global recession risk remains contained or breaks through.
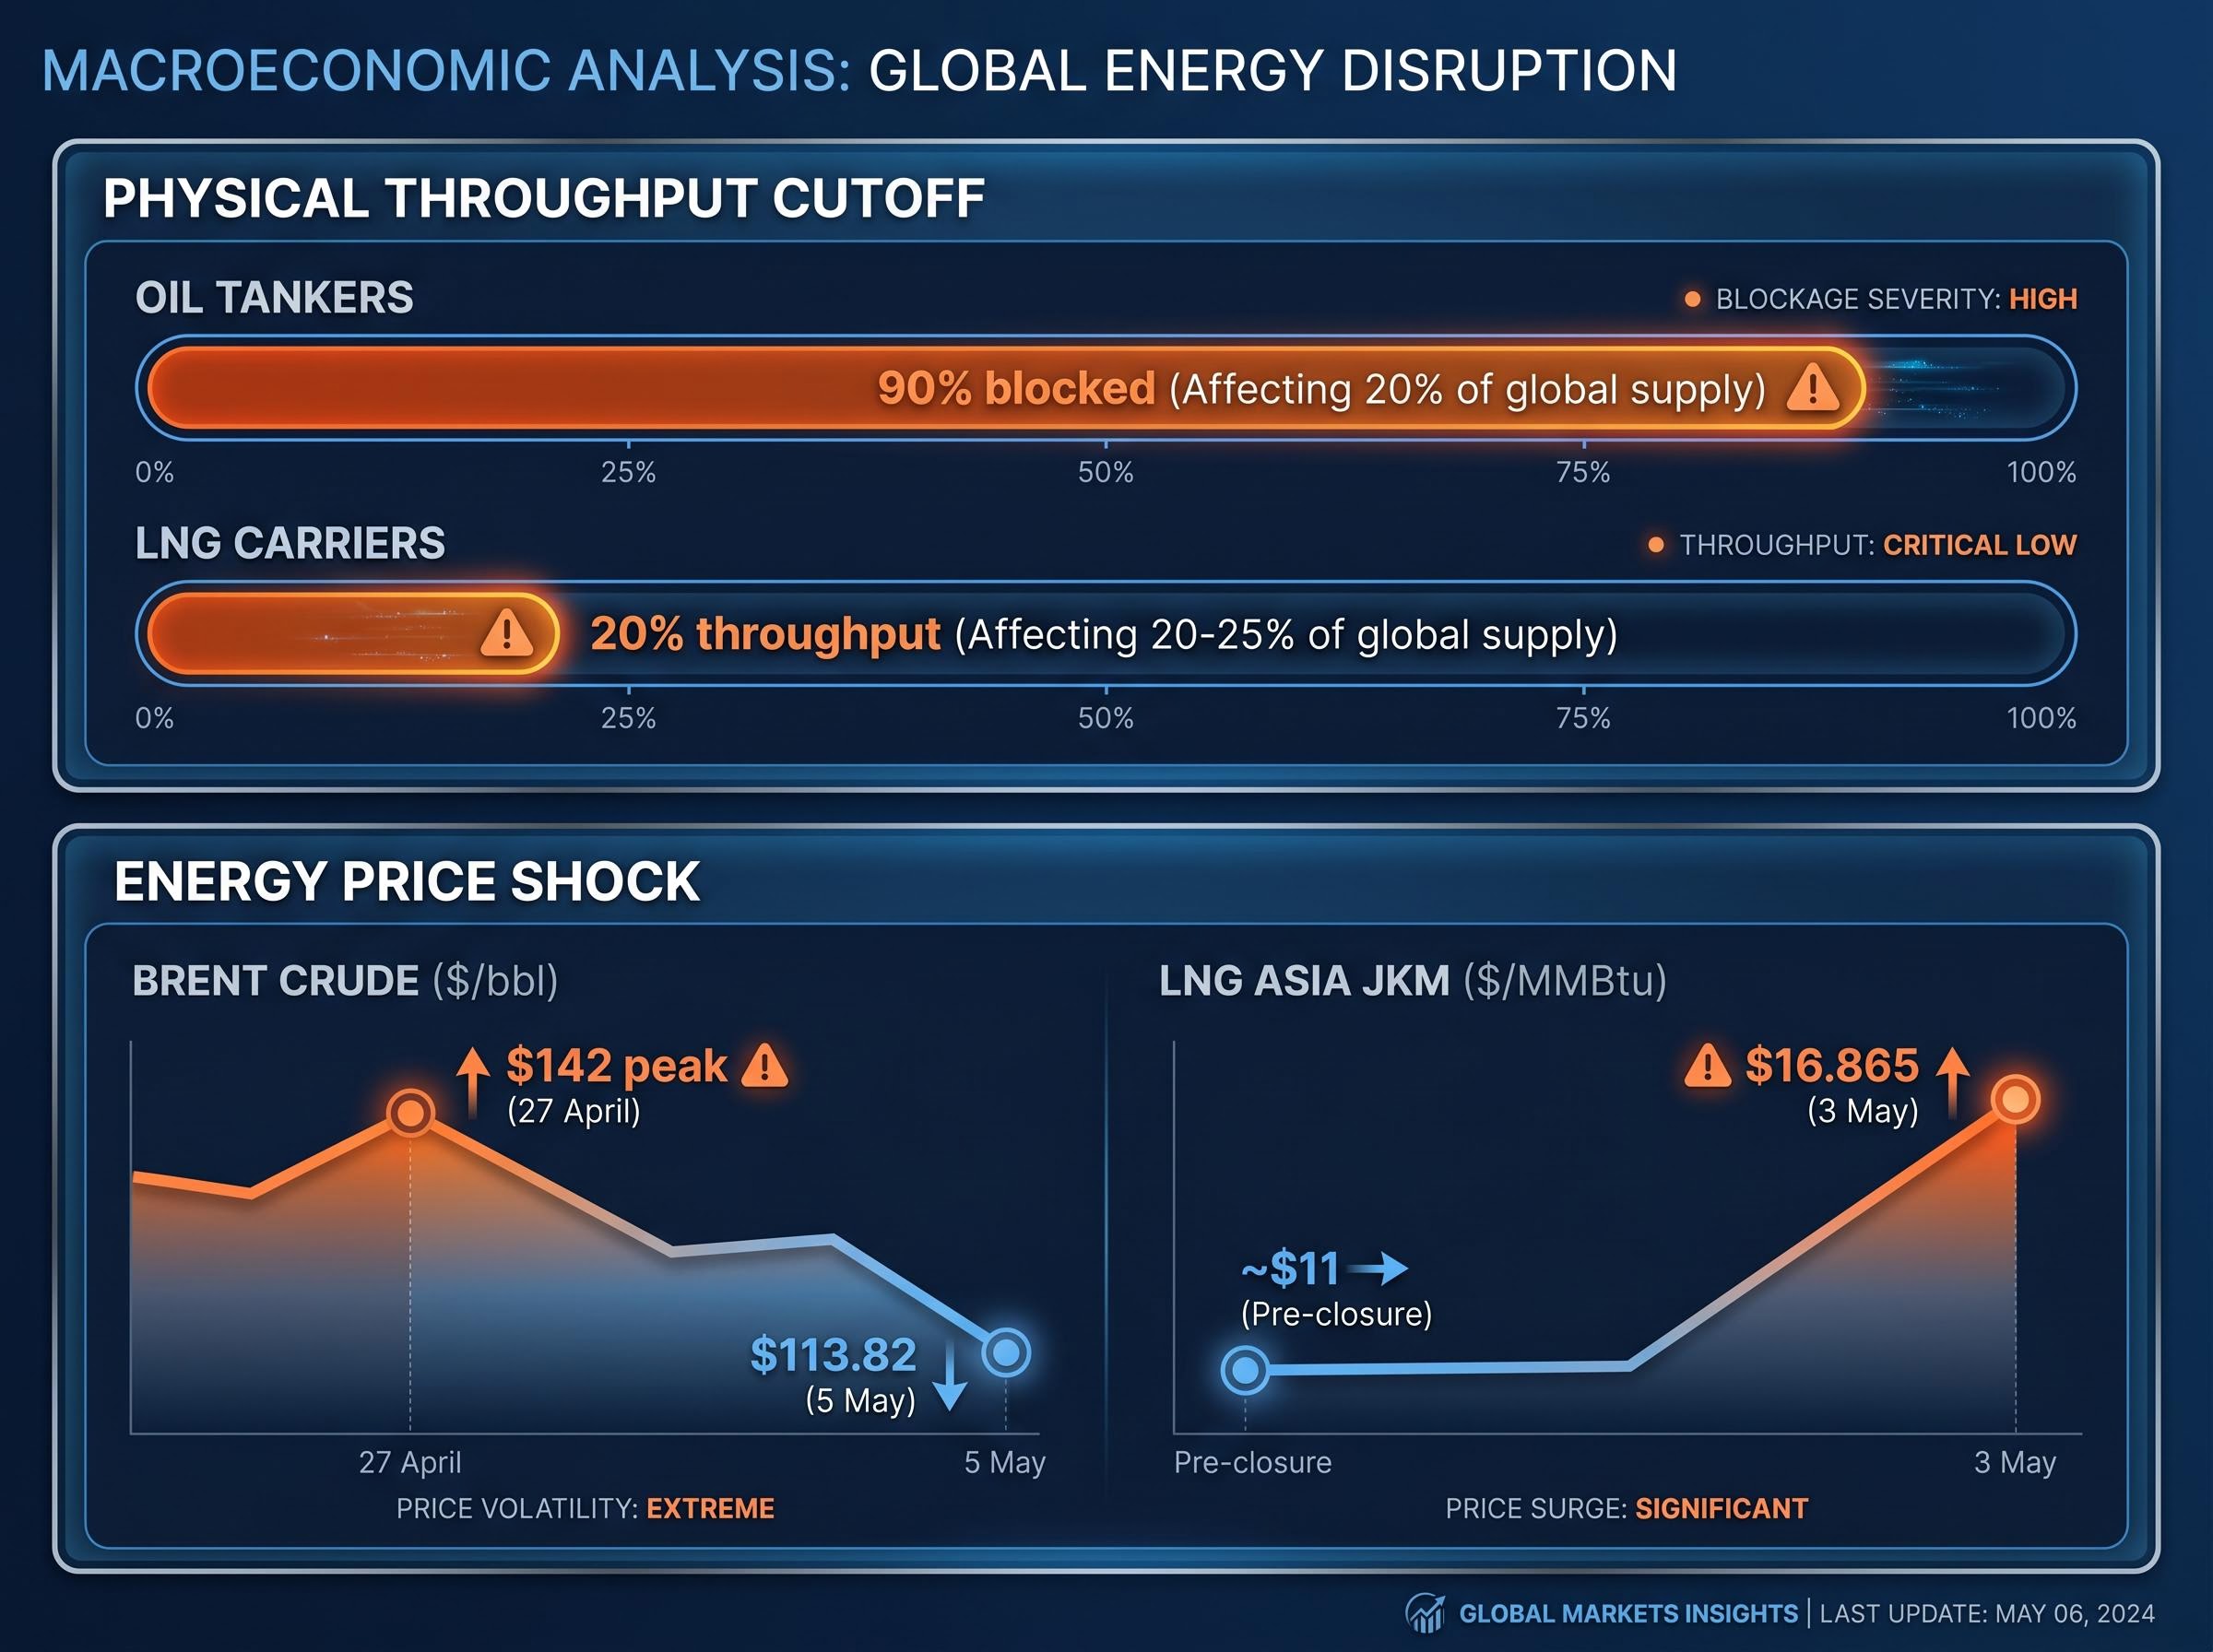
Normal Strait of Hormuz throughput accounts for approximately 20% of global oil and 20-25% of global LNG. Current capacity is running at roughly 5-10% of normal levels, with oil tanker passage approximately 90% blocked.
| Cargo Type | Throughput Status | Key Details |
|---|---|---|
| Oil tankers | ~90% blocked | VLCCs largely halted; crude from Saudi Arabia, Iraq, UAE, Kuwait affected |
| LNG carriers | ~20% throughput | Qatari and Iranian LNG prioritised; others queued or diverted |
| Dry bulk/other | Minimal passage | Grains, chemicals mostly halted |
The price impact has been severe. Brent front-month sat at approximately $113.82 per barrel on 5 May 2026, down from a peak of roughly $142 on 27 April. WTI’s June contract traded at approximately $106.42 on 4 May. LNG Asia JKM spot prices reached $16.865/MMBtu on 3 May, compared with pre-closure levels of approximately $11/MMBtu.
Baker Hughes indicated during its Q1 earnings call on 25 April 2026 that the strait may remain shut until H2 2026. The Federal Reserve Dallas Survey found 80% of more than 100 executives surveyed expect the closure to persist past August.
The disruption is not hypothetical. It is the largest sustained chokepoint shutdown in modern energy markets.
Oil price shocks do not strike GDP instantly. BCA Research notes that the worst economic damage from an energy supply disruption historically materialises approximately four quarters after the initial shock. The lag exists because the transmission runs through multiple channels that each operate on their own timeline:
This means that the GDP data currently being published reflects economic conditions that were established before the Hormuz shock hit.
U.S. Q1 2026 GDP came in at +2.0% annualised (Bureau of Economic Analysis advance estimate). The Eurozone managed +0.1% quarter-on-quarter (Eurostat flash estimate). China posted +5.0% year-on-year (National Bureau of Statistics, April 2026).
These figures represent pre-shock momentum running forward on inertia. The ISM PMI reading of 52.7 for April 2026 and the Eurozone Composite PMI of 52.2 similarly capture conditions that preceded the full Hormuz impact. According to the IMF, the energy shock is expected to add approximately +1 to +2 percentage points to global inflation and subtract approximately -0.5 to -1 percentage point from global growth forecasts, but those effects are still working their way through the system.
Interpreting current data as evidence of immunity rather than delayed signal is the most common analytical error in the early stages of a supply shock.
BCA Research Chief Strategist Peter Berezin identified seven factors buffering the global economy from immediate recession. Each operates through a distinct mechanism, and understanding the full set explains why the aggregate data has held together.
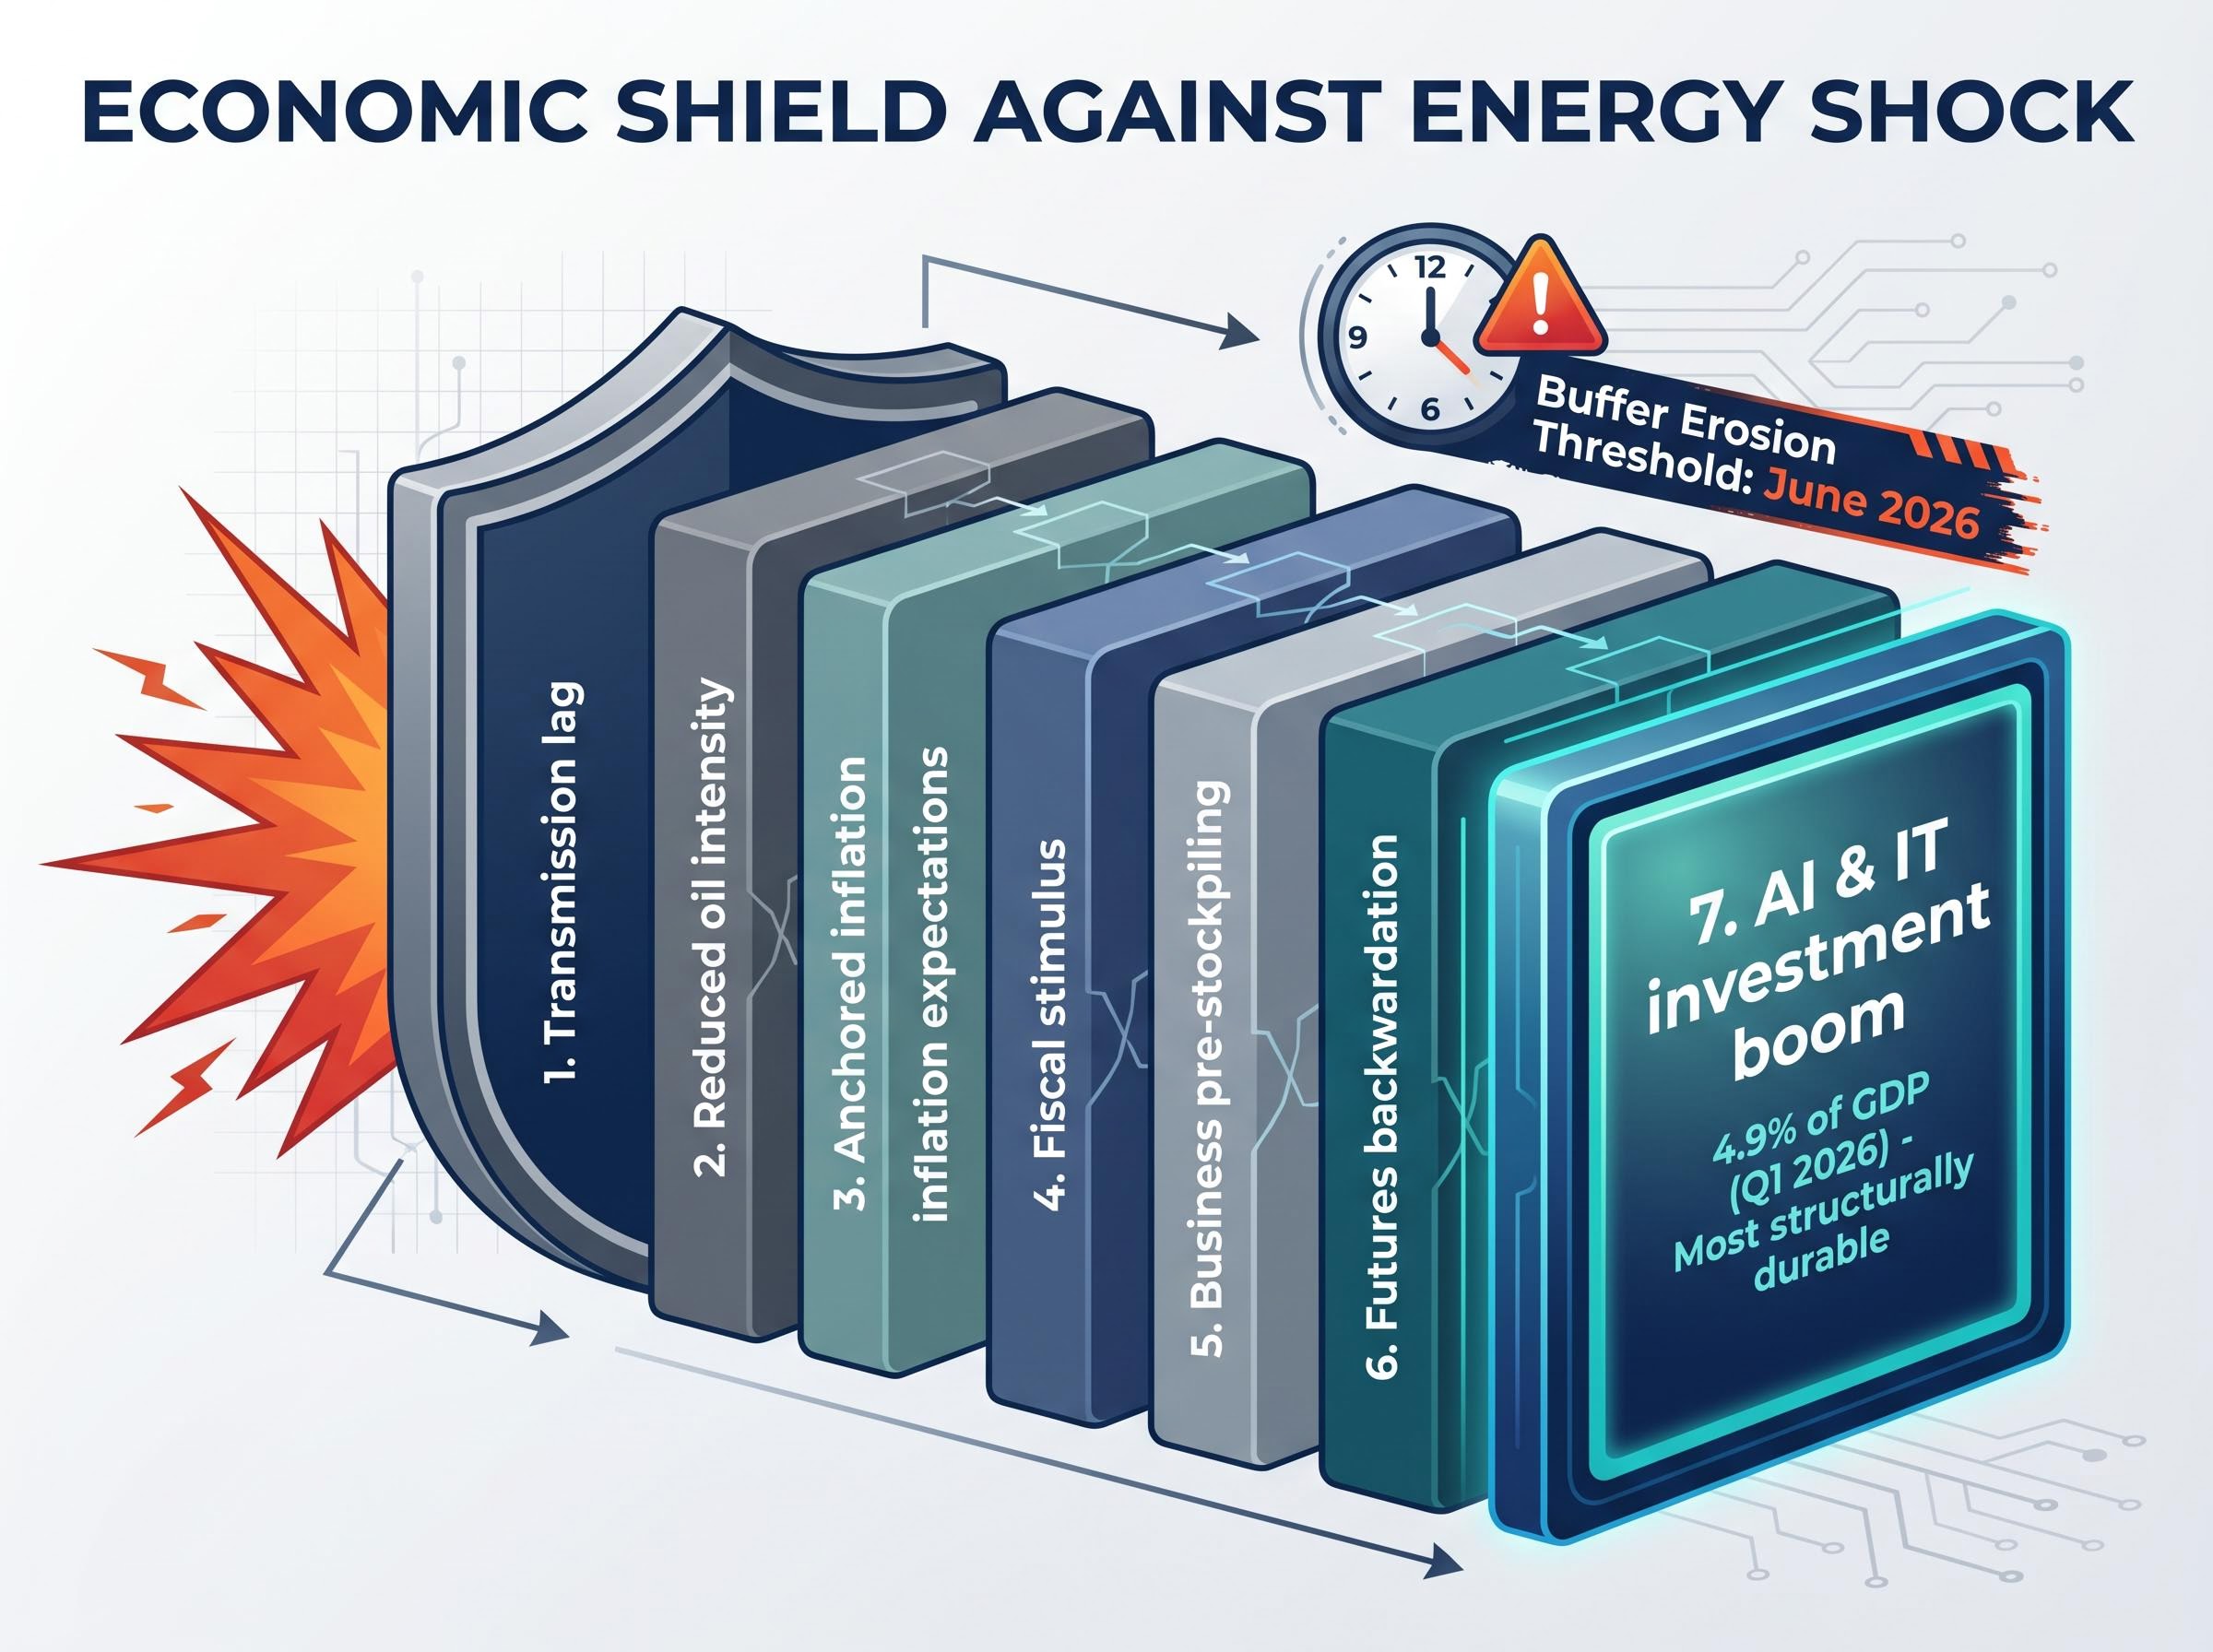
IT investment at 4.9% of GDP in Q1 2026 marks an all-time high, according to BCA Research, and represents the single most structurally durable buffer in the seven-factor framework.
The following table maps each factor against its mechanism and the condition that would cause it to erode.
| Buffer Factor | Mechanism | Primary Vulnerability |
|---|---|---|
| Transmission lag | Four-quarter delay in GDP impact | Time passing; lag closes by Q3-Q4 2026 |
| Reduced oil intensity | Less oil consumed per unit of output | Supply chain interconnectivity amplifies indirect exposure |
| Anchored inflation expectations | Central banks avoid aggressive hikes | Sustained energy inflation dislodges expectations |
| Fiscal stimulus | Government spending offsets demand drag | Political constraints on further fiscal expansion |
| Business pre-stockpiling | Inventories absorb near-term cost increases | Inventories deplete by mid-2026 |
| Futures backwardation | Market expects near-term resolution; suppresses hoarding | Curve flattens if June passes without reopening |
| AI/IT investment boom | Capital expenditure sustains growth independent of energy | Most durable; vulnerable only to broad credit tightening |
Goldman Sachs noted the U.S. Strategic Petroleum Reserve (SPR) at 60% capacity as an additional buffer. Collectively, these factors explain why the aggregate picture has held. Individually, each carries a shelf life.
The global aggregate masks fault lines that are already visible at the regional level. The Eurozone is the most exposed major developed economy. Its Q1 2026 GDP of +0.1% quarter-on-quarter leaves almost no margin to absorb further shocks. Harmonised Index of Consumer Prices (HICP) inflation rose to +3.0% year-on-year in April 2026, with the energy component elevated.
UBS, in a 1 May 2026 assessment, assigned greater than 50% probability of a Eurozone recession if the Hormuz closure remains unresolved into June. JPMorgan, in an earlier 2 April 2026 analysis, placed recession odds at approximately 60% specifically in European-exposure scenarios. These are not fringe estimates; they reflect the arithmetic of an economy running at near-zero growth while absorbing a sustained energy price shock.
China’s position is more layered. The IMF cut its 2026 growth forecast to 4.5% from 4.8% on energy drag, and the Caixin PMI for May 2026 came in at 50.9, stable but with exports affected by elevated LNG import costs. Domestic fiscal stimulus is partially offsetting higher oil import costs, but export competitiveness is being squeezed.
| Institution | Recession Probability | Key Conditions | Date |
|---|---|---|---|
| OECD | 20% | Citing reduced oil intensity | 28 April 2026 |
| IMF | 30% (up from 15%) | Energy shock; fiscal offsets | 22 April 2026 |
| Goldman Sachs | 35%; Hormuz adds ~20pp | SPR buffer, AI capex offset | 4 May 2026 |
| JPMorgan | ~60% (Europe scenarios) | Sustained mid-May disruptions | 2 April 2026 |
| UBS | >50% (Eurozone) | If June unresolved | 1 May 2026 |
India’s Q1 2026 GDP growth of 6.8% year-on-year demonstrates relative resilience through diversified energy sourcing, but domestic inflation has risen to 5.1%, driven by energy cost pass-through. Energy-import-dependent economies in Africa and Latin America face compounding pressures from higher fuel costs, currency depreciation, and tightening capital flows. Nouriel Roubini, writing in the Financial Times on 3 May 2026, assigned 70% stagflation risk globally, describing the current buffers as temporary. Sector-level data for the most exposed emerging markets remains limited, which itself represents a data opacity risk for investors with exposure to those regions.
BCA Research identifies June 2026 as the threshold at which the buffering mechanisms begin to erode materially. This is not an arbitrary date. It is the point at which several of the seven factors converge toward exhaustion.
Four conditions would accelerate that erosion:
BCA Research currently holds a neutral stance on global equities but has stated its intention to shift to a more cautious posture if the disruption continues past June.
The diplomatic track offers a narrow window. U.S.-Iran talks conducted in Oman between 28 April and 4 May 2026 focused on a timeline tied to potential U.S. withdrawal from regional military bases. The Trump administration signalled a possible deal by 15 May, according to the Financial Times on 4 May. Iran has floated a $5-10 per barrel transit fee proposal, a condition that analysts note could complicate normalisation even if broader talks succeed.
Goldman Sachs assigns 35% global recession probability, with the Hormuz disruption adding approximately 20 percentage points of that risk. The IMF places the figure at 30%, up from 15% before the closure (April 2026 World Economic Outlook update). The OECD sits at 20%, citing reduced oil intensity as its primary basis for optimism. Morgan Stanley projects Brent at approximately $100 per barrel by Q4 on stockpile drawdown dynamics. The Federal Reserve Dallas Survey found 45% of respondents see a U.S. recession by Q3.
The range is wide. The direction of travel, should June pass without resolution, is not.
The seven-factor framework converts into three priority monitoring signals:
Secondary indicators worth tracking include:
The institutional recession probability range as of early May 2026 runs from 20% (OECD) to 70% (Roubini). That spread reflects genuine uncertainty rather than analytical failure. BCA’s framing of IT investment at 4.9% of GDP as the most structurally durable of the seven buffers suggests that the AI-driven capex cycle represents a new economic baseline rather than a temporary boost. It is the one factor that does not carry an obvious expiry date.
The global economy has been genuinely buffered by a combination of structural shifts and cyclical timing. Reduced oil intensity, fiscal offsets, pre-built inventories, and an unprecedented IT investment cycle have absorbed a supply shock of historic scale. That is not an illusion, and the data through Q1 2026 confirms it.
The buffers are time-limited. BCA Research’s June 2026 threshold is not speculative; it is the point at which inventory depletion, lag effect closure, and futures market repricing converge. The honest institutional position, reflected in BCA’s current neutral-but-prepared-to-shift stance, is watchful. Neither complacency nor panic serves investors well when the range of credible recession probability estimates spans 20% to 70%. The clock, not the current data, is the variable that matters most from here.
This article is for informational purposes only and should not be considered financial advice. Investors should conduct their own research and consult with financial professionals before making investment decisions. Forward-looking statements, including recession probability estimates and price forecasts, are subject to change based on market developments and geopolitical conditions.
The Strait of Hormuz is a critical maritime chokepoint through which approximately 20% of global oil supply and 20-25% of global LNG normally flows. Its closure since mid-April 2026 has created the largest sustained energy supply disruption in modern history, directly elevating global recession risk estimates from institutions including the IMF, Goldman Sachs, and UBS.
BCA Research identifies seven buffering factors including a four-quarter transmission lag on oil shock impacts, reduced oil intensity of GDP, anchored inflation expectations, fiscal stimulus, business pre-stockpiling, oil futures backwardation, and a record AI and IT investment boom that reached 4.9% of U.S. GDP in Q1 2026.
BCA Research identifies June 2026 as the point at which multiple buffers converge toward exhaustion, including inventory depletion, futures curve repricing, closing of the four-quarter GDP lag, and potential central bank tightening pressure from sustained energy inflation.
As of early May 2026, recession probability estimates range from 20% (OECD) to 35% (Goldman Sachs, with Hormuz adding approximately 20 percentage points) to 60% in European scenarios (JPMorgan) and 70% stagflation risk globally (Nouriel Roubini), reflecting wide but genuine uncertainty.
Key signals to watch include the shape of the oil futures curve (flattening backwardation signals prolonged disruption), diplomatic developments around a potential deal by 15 May 2026, BCA Research shifting from neutral to cautious on global equities, and PMI trends across the Eurozone and China through May and June readings.