Capital Economics is simultaneously bullish and bearish on the S&P 500, and the year separating those two positions is the most important variable for every investor in AI-linked equities right now.
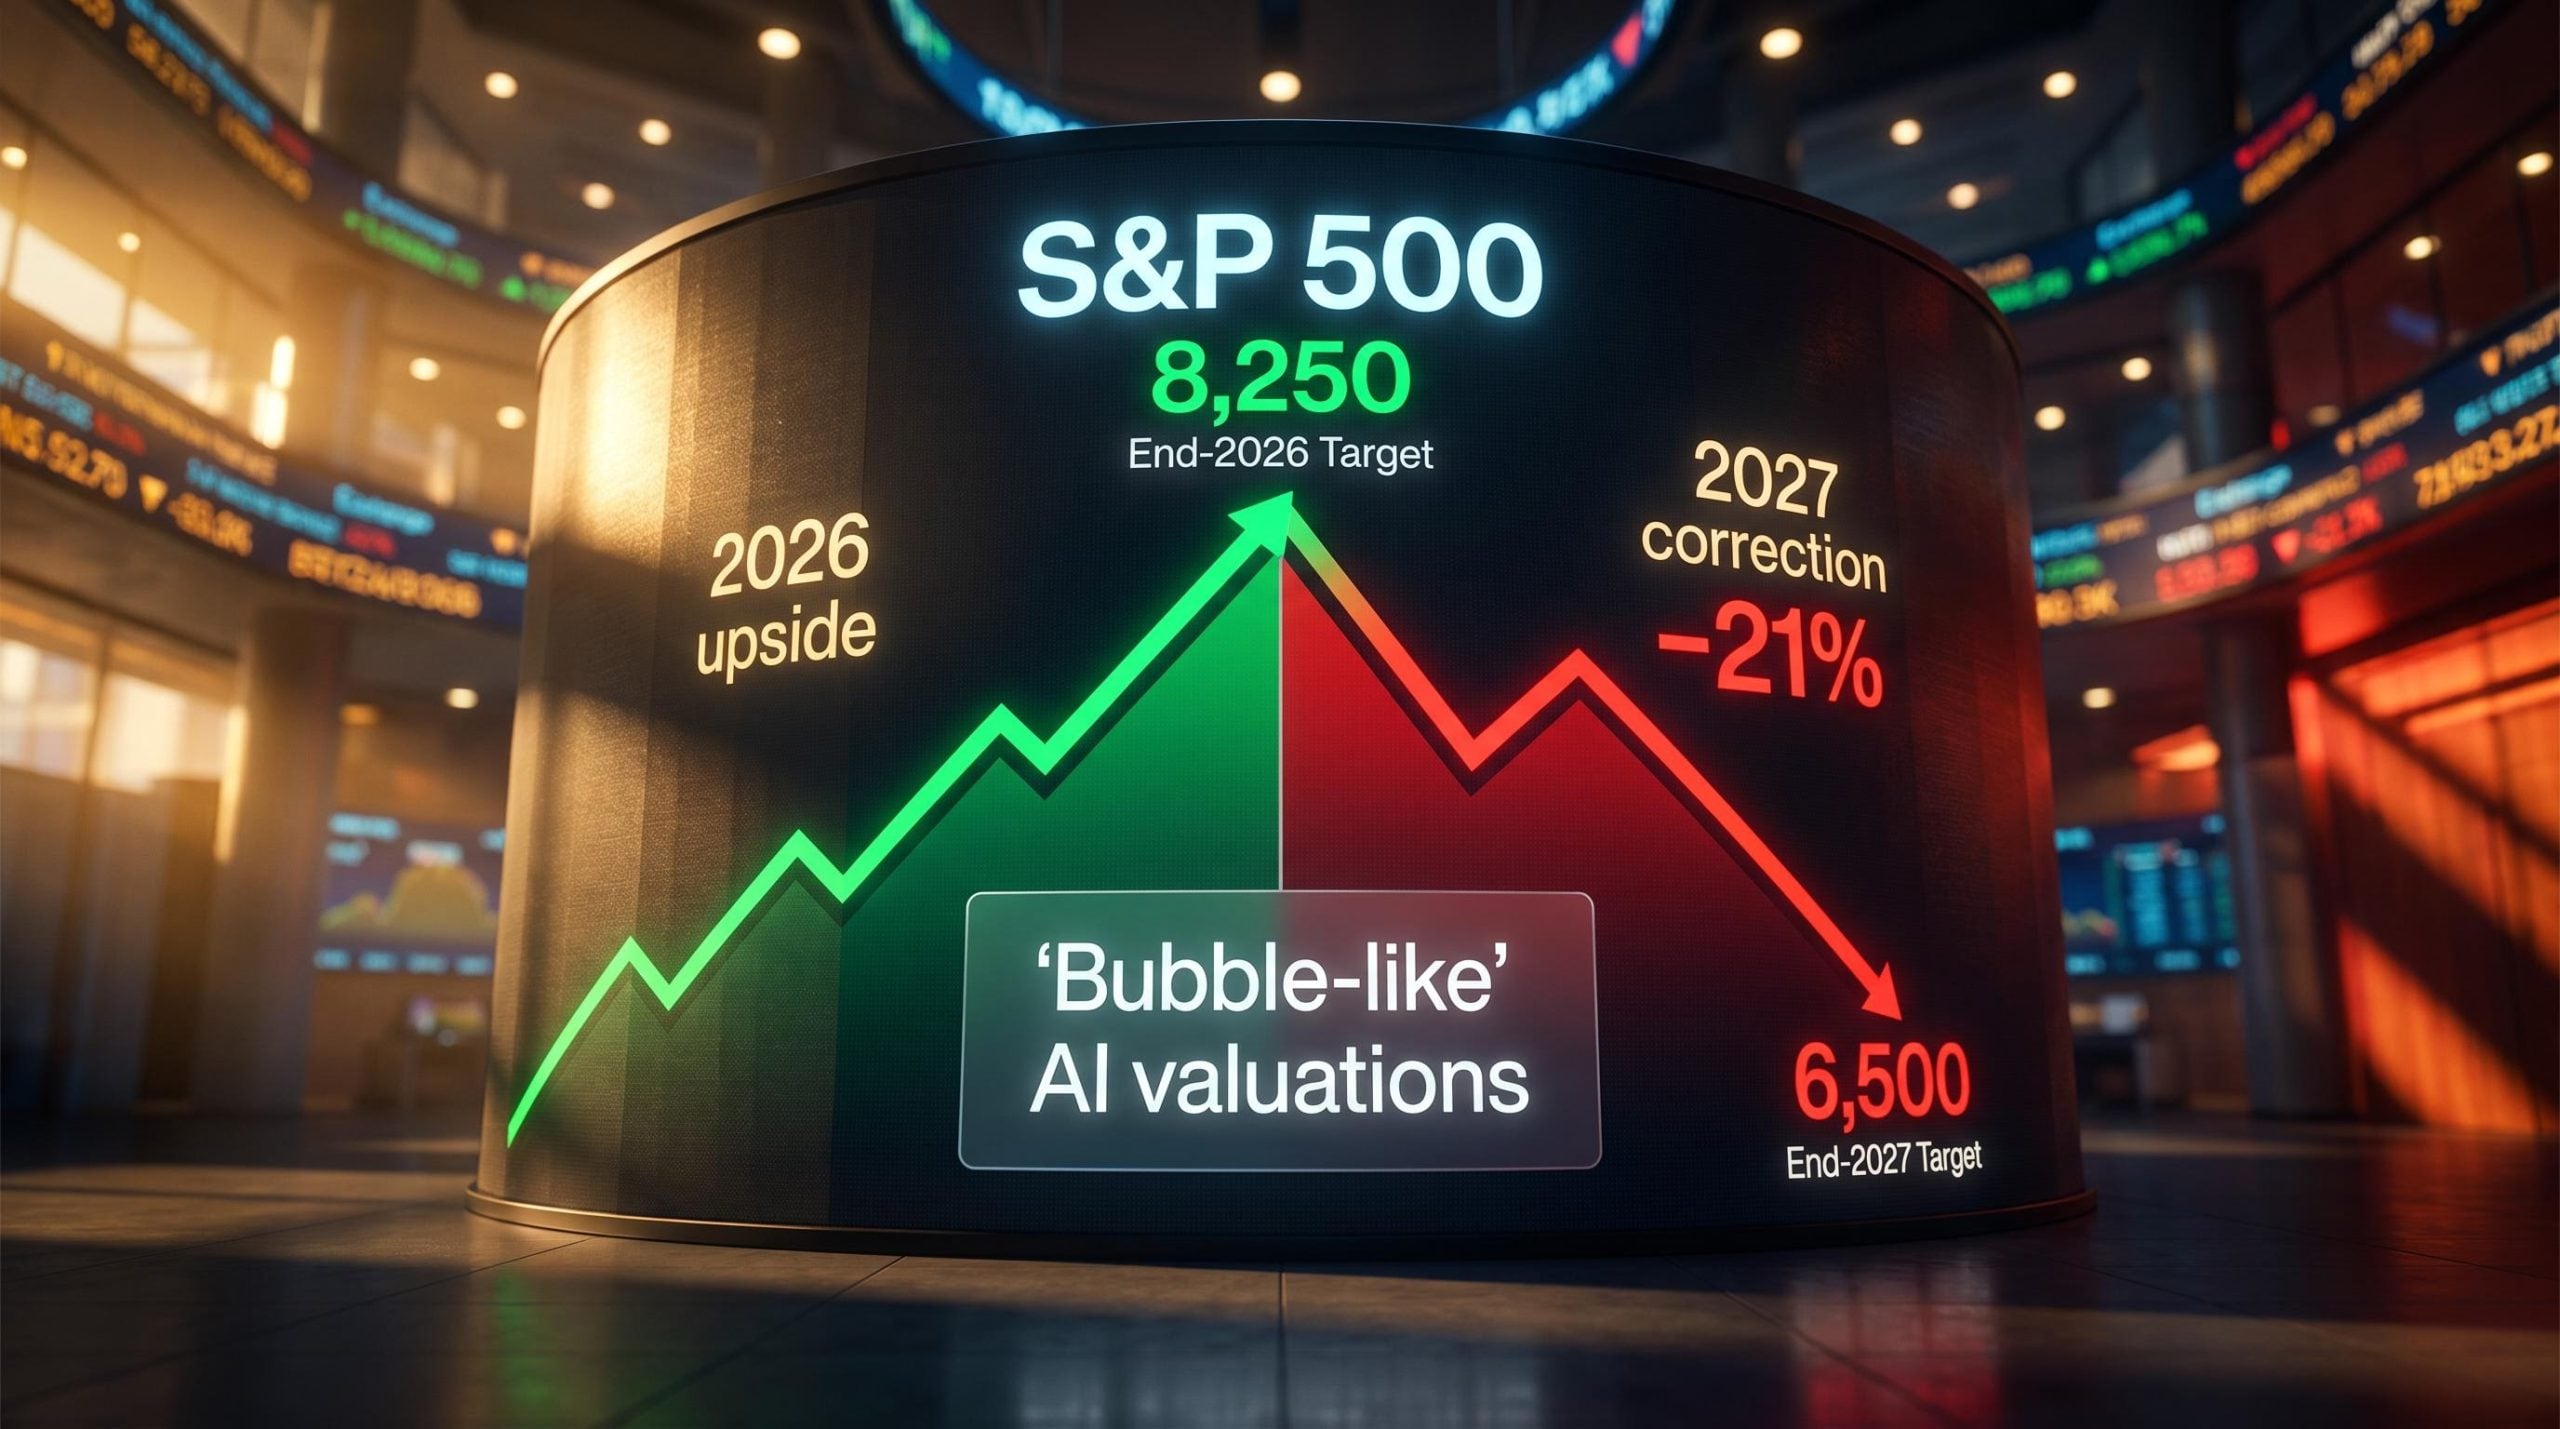
The research firm has set an end-2026 S&P 500 target of 8,250, underpinned by continued enthusiasm around artificial intelligence, while simultaneously calling for the index to drop to 6,500 by the close of 2027, when it expects the highly optimistic profit forecasts currently baked into AI-adjacent names to prove unsustainable. That two-act structure is not a contradiction. It is a sequenced thesis with a specific trigger.
Here is what the data actually tells you about both the upside and the risk buried inside this S&P 500 forecast, and why understanding the sequence matters more than fixating on either headline number alone.
Capital Economics’ two-phase call: 8,250 in 2026, then a steep pullback
The numbers are stark when placed side by side.
Capital Economics’ S&P 500 targets: End-2026: 8,250 | End-2027: 6,500
- End-2026 target: 8,250, implying further upside from current levels
- End-2027 target: 6,500, representing an approximately 21% decline from the projected peak
- Attribution: Capital Economics equities coverage, John Higgins
Earlier iterations of the firm’s forecast carried lower targets, including 7,000 for end-2026. Those were revised upward as AI optimism intensified through the first half of 2026. The current baseline, as of July 2026, reflects a firm that has chased the rally higher on the near-term view while sharpening its bearish conviction on the longer-term one.
The gap between 8,250 and 6,500 is not a rounding error or a hedge. It is a deliberate sequenced thesis, and understanding that sequence is what separates informed positioning from reacting to a headline number.
S&P 500 correction targets from multiple research houses are converging around a similar magnitude range: Bank of America’s technical analyst Paul Ciana flagged a bearish ABC wave count in July 2026 pointing to 6,850-6,968, a figure that sits close to Capital Economics’ 6,500 end-2027 scenario and arrives via an entirely different analytical methodology.
When big ASX news breaks, our subscribers know first
Why AI enthusiasm is doing the heavy lifting for the 2026 upside
Capital Economics ties the 2026 upside explicitly to AI-related optimism, arguing that enthusiasm around artificial intelligence allows the S&P 500 to remain above consensus and overshoot fundamentals in the near term. The sectors carrying that rally are concentrated: semiconductors, cloud hyperscalers, and AI software platforms, all of which hold large index weights.
Where it sits relative to peers
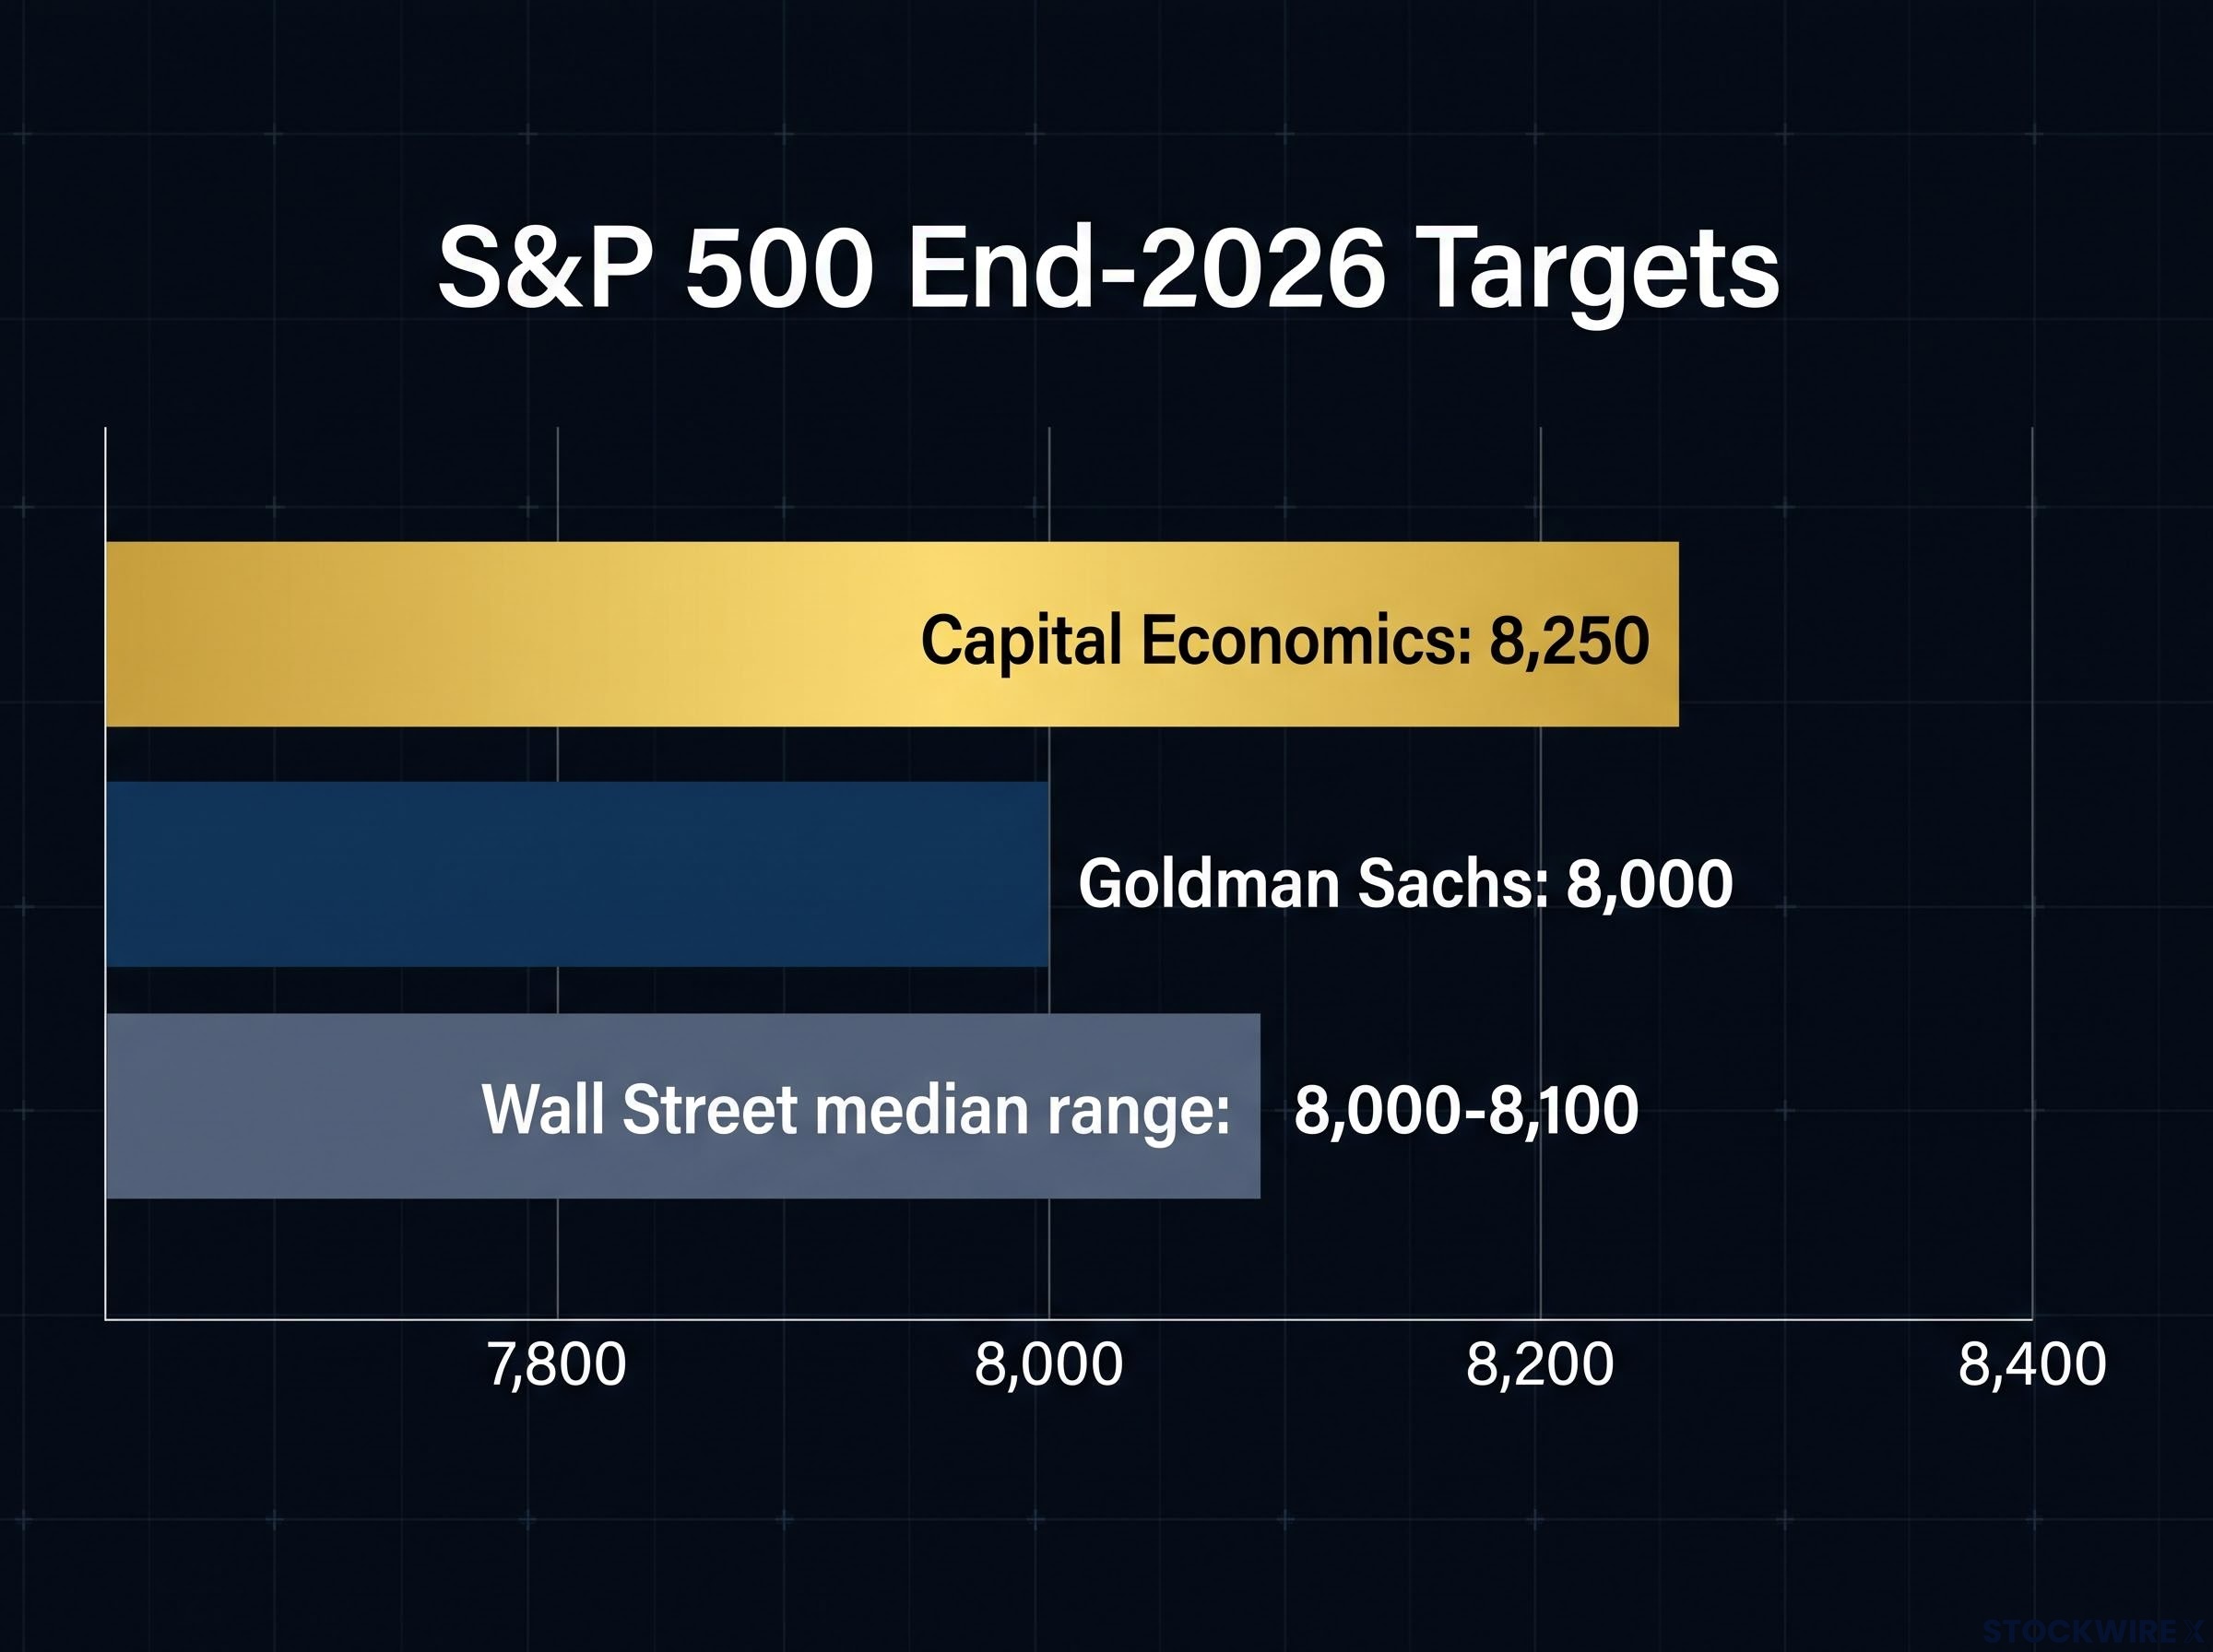
The firm’s 8,250 target places it at the high end of current Wall Street forecasts. The broader Street range for end-2026 clusters between 8,000 and 8,100, with Goldman Sachs projecting 8,000.
- Capital Economics: 8,250 (high end of Street range)
- Goldman Sachs: 8,000
- Wall Street median range: approximately 8,000-8,100
The fact that Capital Economics’ near-term target sits above most peers tells you the firm’s bull case is not a cautious one. That makes the simultaneous 2027 bearishness a more deliberate contrast, not a softened hedge. If AI enthusiasm cools faster than the firm expects, the 8,250 target loses its foundation before 2027 even arrives.
The Goldman Sachs US stocks forecast, updated in mid-2026, sets an 8,000 year-end S&P 500 target driven by stronger earnings expectations from AI infrastructure investment, placing Capital Economics’ 8,250 call meaningfully above the firm that represents the next highest-profile benchmark on the Street.
What “bubble-like” actually means and why 2027 is the named risk year
Capital Economics does not hedge its language. The firm explicitly characterises current AI-related valuations as “bubble-like” and identifies 2027 as the more likely timing for any unwind.
Capital Economics’ own framing: AI-related valuations are “bubble-like,” and the timing of any bursting is “more likely a 2027 event.”
The distinction matters: this is not a macro collapse thesis. Capital Economics does not require a recession for the correction to materialise. It requires only that AI-delivered earnings fail to meet the highly optimistic trajectories currently priced into AI-adjacent names.
The AI investment bubble debate is not settled even by mid-2026: Nvidia’s forward P/E of approximately 24x sits far below Cisco’s 150x at the dot-com peak, yet peer-reviewed econometric research detected speculative bubbles across all seven Magnificent Seven stocks between 2017 and 2025.
Why 2027 specifically? AI enthusiasm is expected to sustain above-consensus valuations through 2026, but the window for actual delivered results to confirm or disappoint that thesis opens as 2026 progresses and 2027 earnings visibility increases. The firm explicitly sees long-term structural advantages in AI while warning about near-term valuation excess. Those positions are compatible in its framing: the technology may be real, but the prices paid for it today may not be.
When a credible research firm applies the word “bubble-like” to a segment that now constitutes a dominant share of S&P 500 market capitalisation, it is a structural argument about the relationship between priced-in expectations and likely delivered reality. Strength through 2026 does not invalidate the 2027 risk thesis; it may be consistent with it.
The double-hit correction mechanism: how 8,250 becomes 6,500
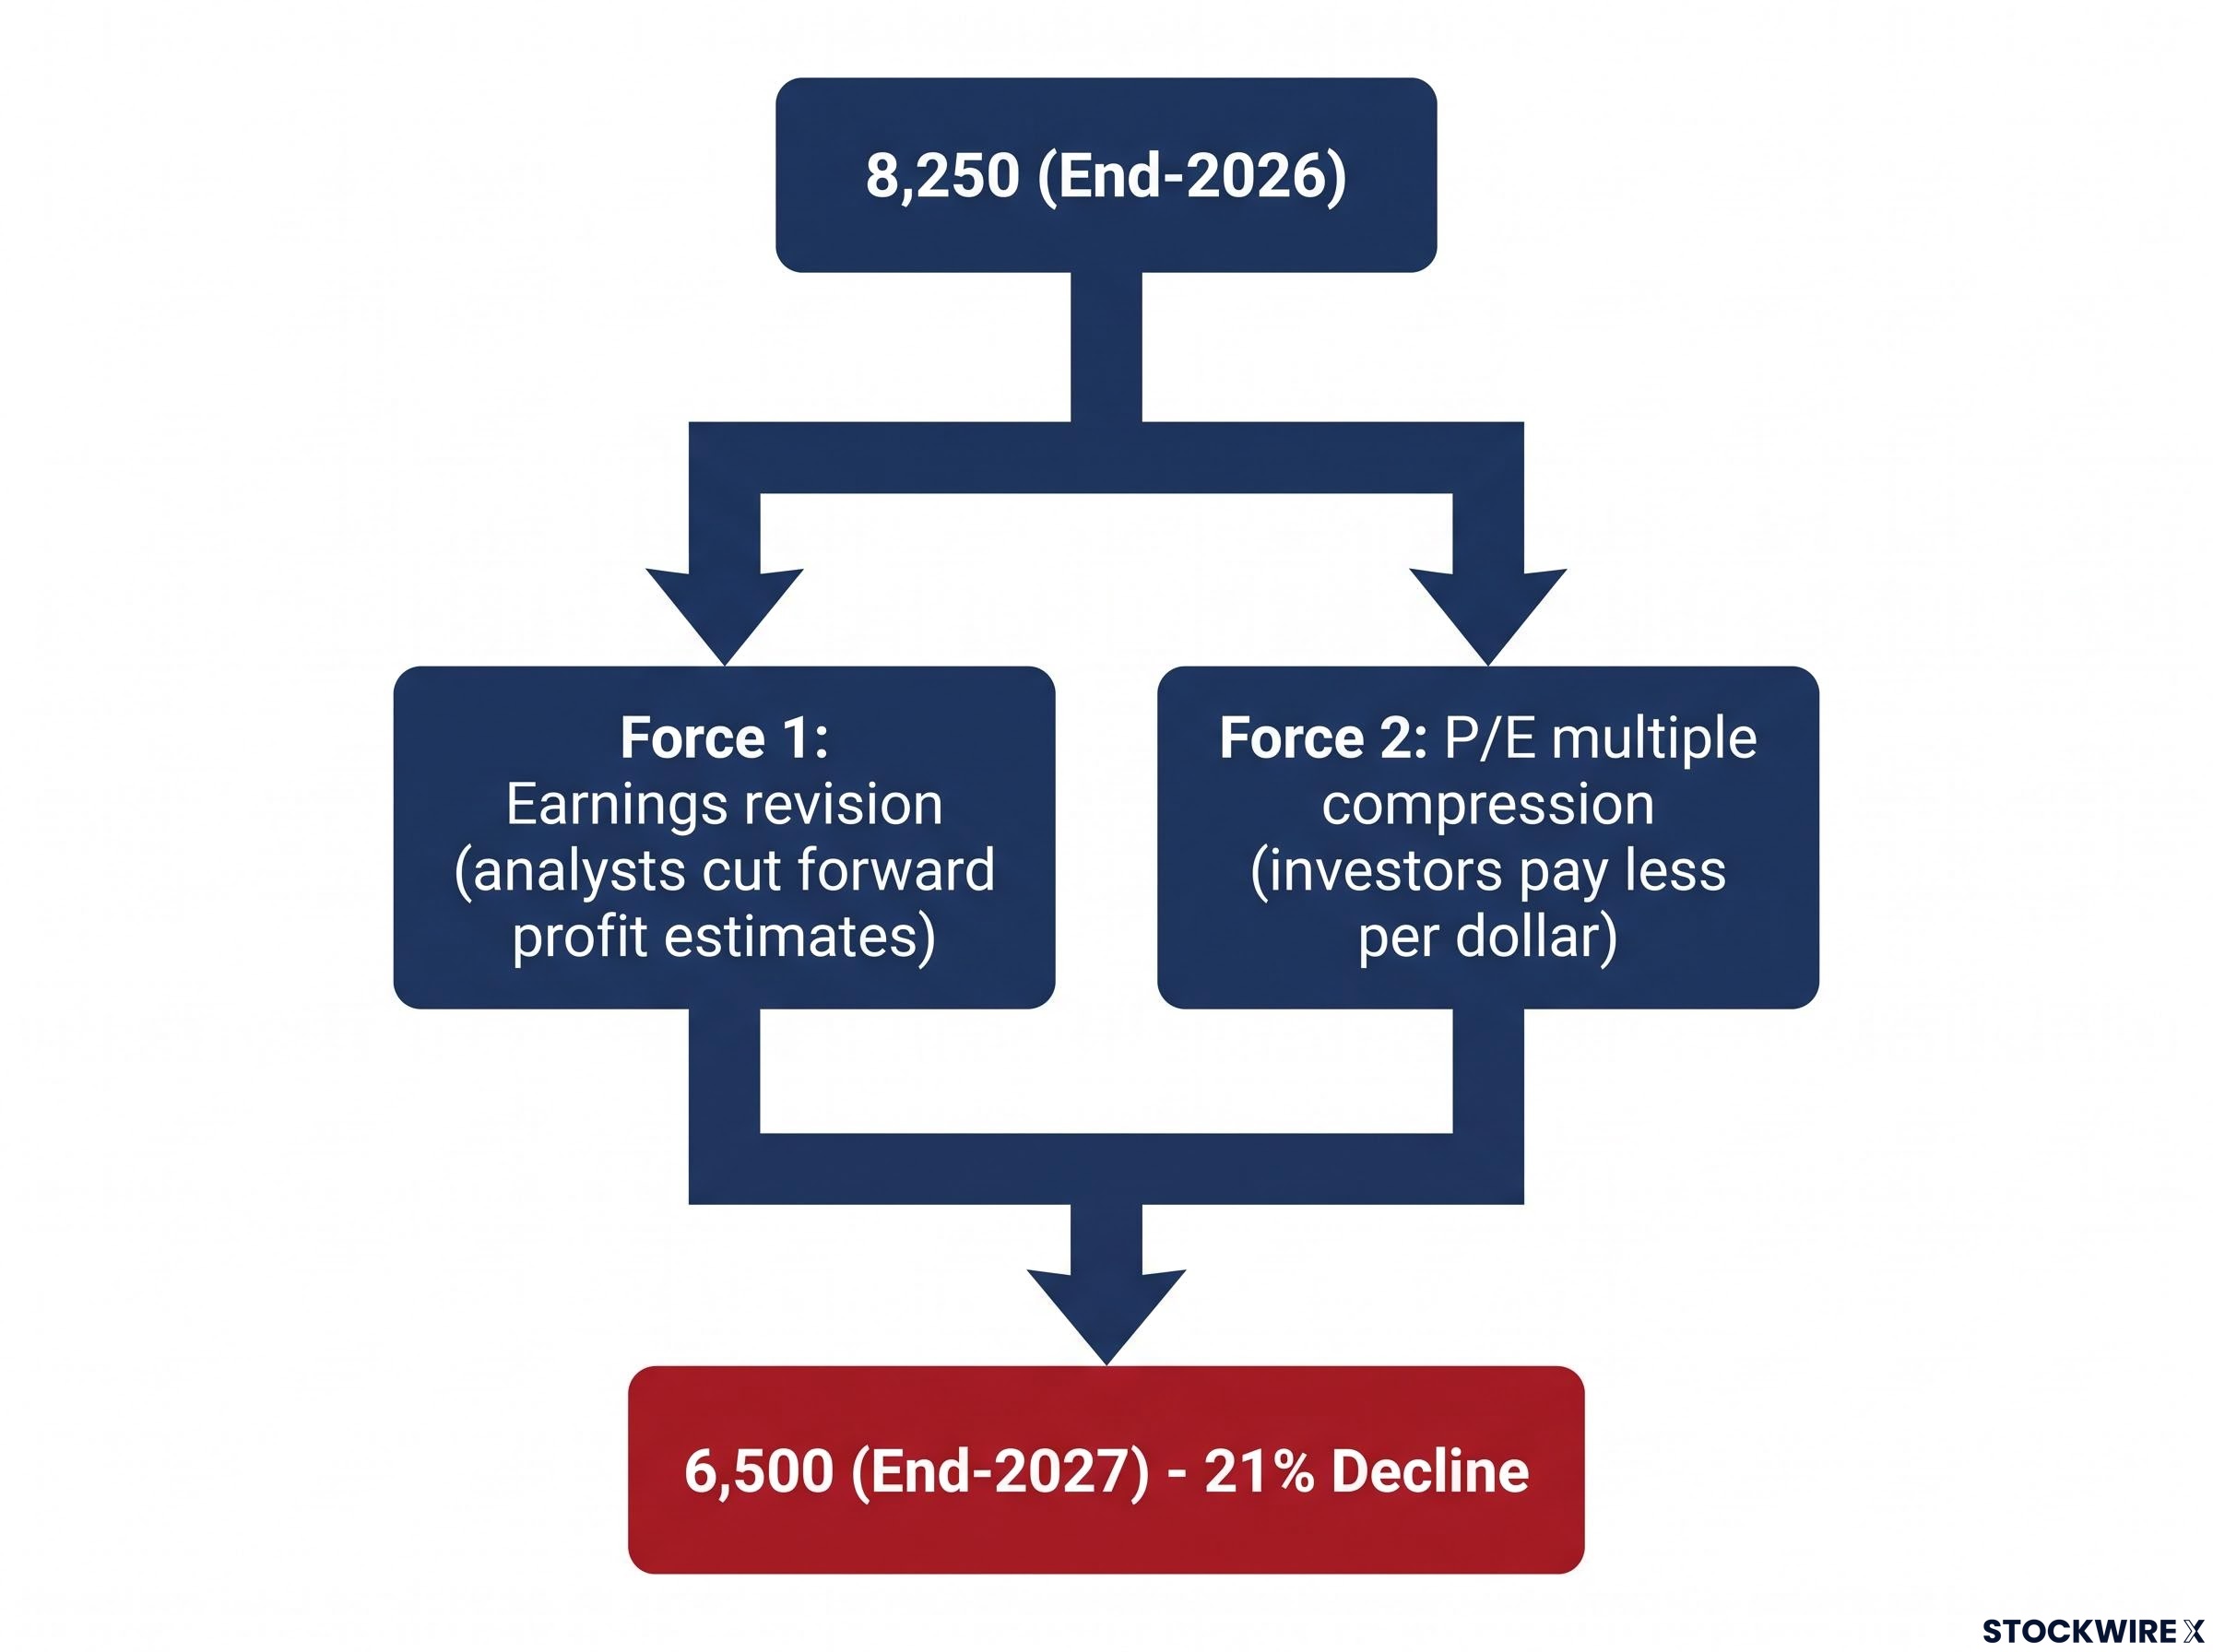
The 21% decline is not a single force applied once. Capital Economics identifies two compressing forces that can operate simultaneously, and their interaction is what drives the outsized move.
Earnings expectations get revised downward first. When delivered AI results fall short of the optimistic trajectories currently priced in, analysts cut their forward estimates. That alone moves the index lower.
Then the second force arrives. Price-to-earnings (P/E) multiples, the amount investors are willing to pay per dollar of earnings, compress as the market re-prices risk in AI-adjacent names. Lower earnings multiplied by a lower multiple produces a compounding effect on valuations.
| Force | What it means in practice |
|---|---|
| Earnings revision | Analysts cut forward profit estimates as delivered AI results fall short of optimistic projections |
| P/E multiple compression | Investors pay less per dollar of those now-lower earnings, re-pricing risk in AI-heavy names |
| Combined effect | Both forces compound simultaneously, driving an approximately 21% index-level decline from 8,250 to 6,500 |
Because AI mega-caps carry enormous index weights, this double adjustment can drive outsized index-level moves even if the broader economy remains reasonably healthy. A correction in a handful of very large names translates directly into significant index damage.
The double-hit structure is what separates this from a standard valuation pullback. When earnings come down and the multiple investors are willing to pay for those earnings also compresses, the downside compounds quickly. That mathematics is especially punishing for the most AI-concentrated portfolios. The early warning system this thesis points to is earnings guidance revisions from key AI names, not just price action.
What the 2026-2027 sequence means if you hold AI-linked equities today
What it means by investment horizon
The forecast carries materially different implications depending on your time horizon and concentration levels.
- Long-term diversified investors (5-10 year horizon): A 21% correction, while meaningful, sits within the range of historically normal equity drawdowns. You have likely experienced similar or worse declines before, and a diversified portfolio absorbs index-level resets over multi-year periods.
- Shorter-term or AI-concentrated investors (1-2 year horizon): Heavily AI-concentrated portfolios could face far more severe damage than the index-level decline suggests. Concentration effects mean that a 21% index drop driven primarily by AI mega-caps translates to potentially steeper losses in portfolios overweight those names.
AI stock concentration risk is particularly acute for investors who built positions across semiconductors, cloud infrastructure, and AI software platforms without accounting for how much of a standard S&P 500 index allocation they already carry in those same names.
Why timing the top is the wrong frame
8,250 and 6,500 are scenario markers, not precise roadmaps. A correction could begin earlier or later than any calendar year label implies, and the uncertainty band around 2027 timing is meaningful.
Staged risk management fits this uncertainty better than all-or-nothing market timing. Trimming on strength, diversifying away from the most stretched valuations, or using hedges are approaches compatible with not knowing the precise turning point. Capital Economics’ own framing supports this: the firm acknowledges uncertainty in timing while maintaining the directional view.
For any investor with a meaningful allocation to AI-themed equities, this forecast is not an abstract institutional view to file away. It is a reason to interrogate whether current AI concentration levels fit your risk tolerance if the 2027 scenario materialises even partially.
What the data actually confirms, and where the real uncertainty sits
Long-dated point targets are scenario markers with meaningful uncertainty bands, not precise commitments about where the index will trade on 31 December of any given year. Capital Economics itself frames the bubble burst as “more likely a 2027 event” rather than a definitive 2027 claim.
What is observable right now: the AI-driven rally exists, current AI-related valuations are stretched by historical standards, and earnings-expectations resets have ample precedent when priced-in optimism runs ahead of delivered reality. What remains projected: the specific timing and magnitude of any correction.
The earnings expectations gap is the core mechanism behind the Capital Economics correction thesis: when blended EPS growth came in at 27.1% year-over-year for Q1 2026, well above the pre-season consensus of 13.2%, markets illustrated precisely how dramatically priced-in optimism can diverge from delivered reality, and how quickly that gap closes when results disappoint.
The forward-looking variables that would confirm or challenge this thesis are identifiable:
- Earnings guidance revisions from AI mega-cap names
- P/E multiple trends in the semiconductor and hyperscaler segments
- AI capital expenditure delivery signals (are actual returns matching spend?)
- Analyst consensus earnings-per-share revision direction for AI-heavy index constituents
The directional structure of the Capital Economics forecast, AI-fuelled upside followed by an expectations-driven reset, is the durable insight regardless of whether the precise numbers prove accurate. Investors who understand that structure can monitor the right leading indicators rather than waiting for a headline to tell them the correction has already started.
This article is for informational purposes only and should not be considered financial advice. Investors should conduct their own research and consult with financial professionals before making investment decisions. Past performance does not guarantee future results. Financial projections are subject to market conditions and various risk factors.