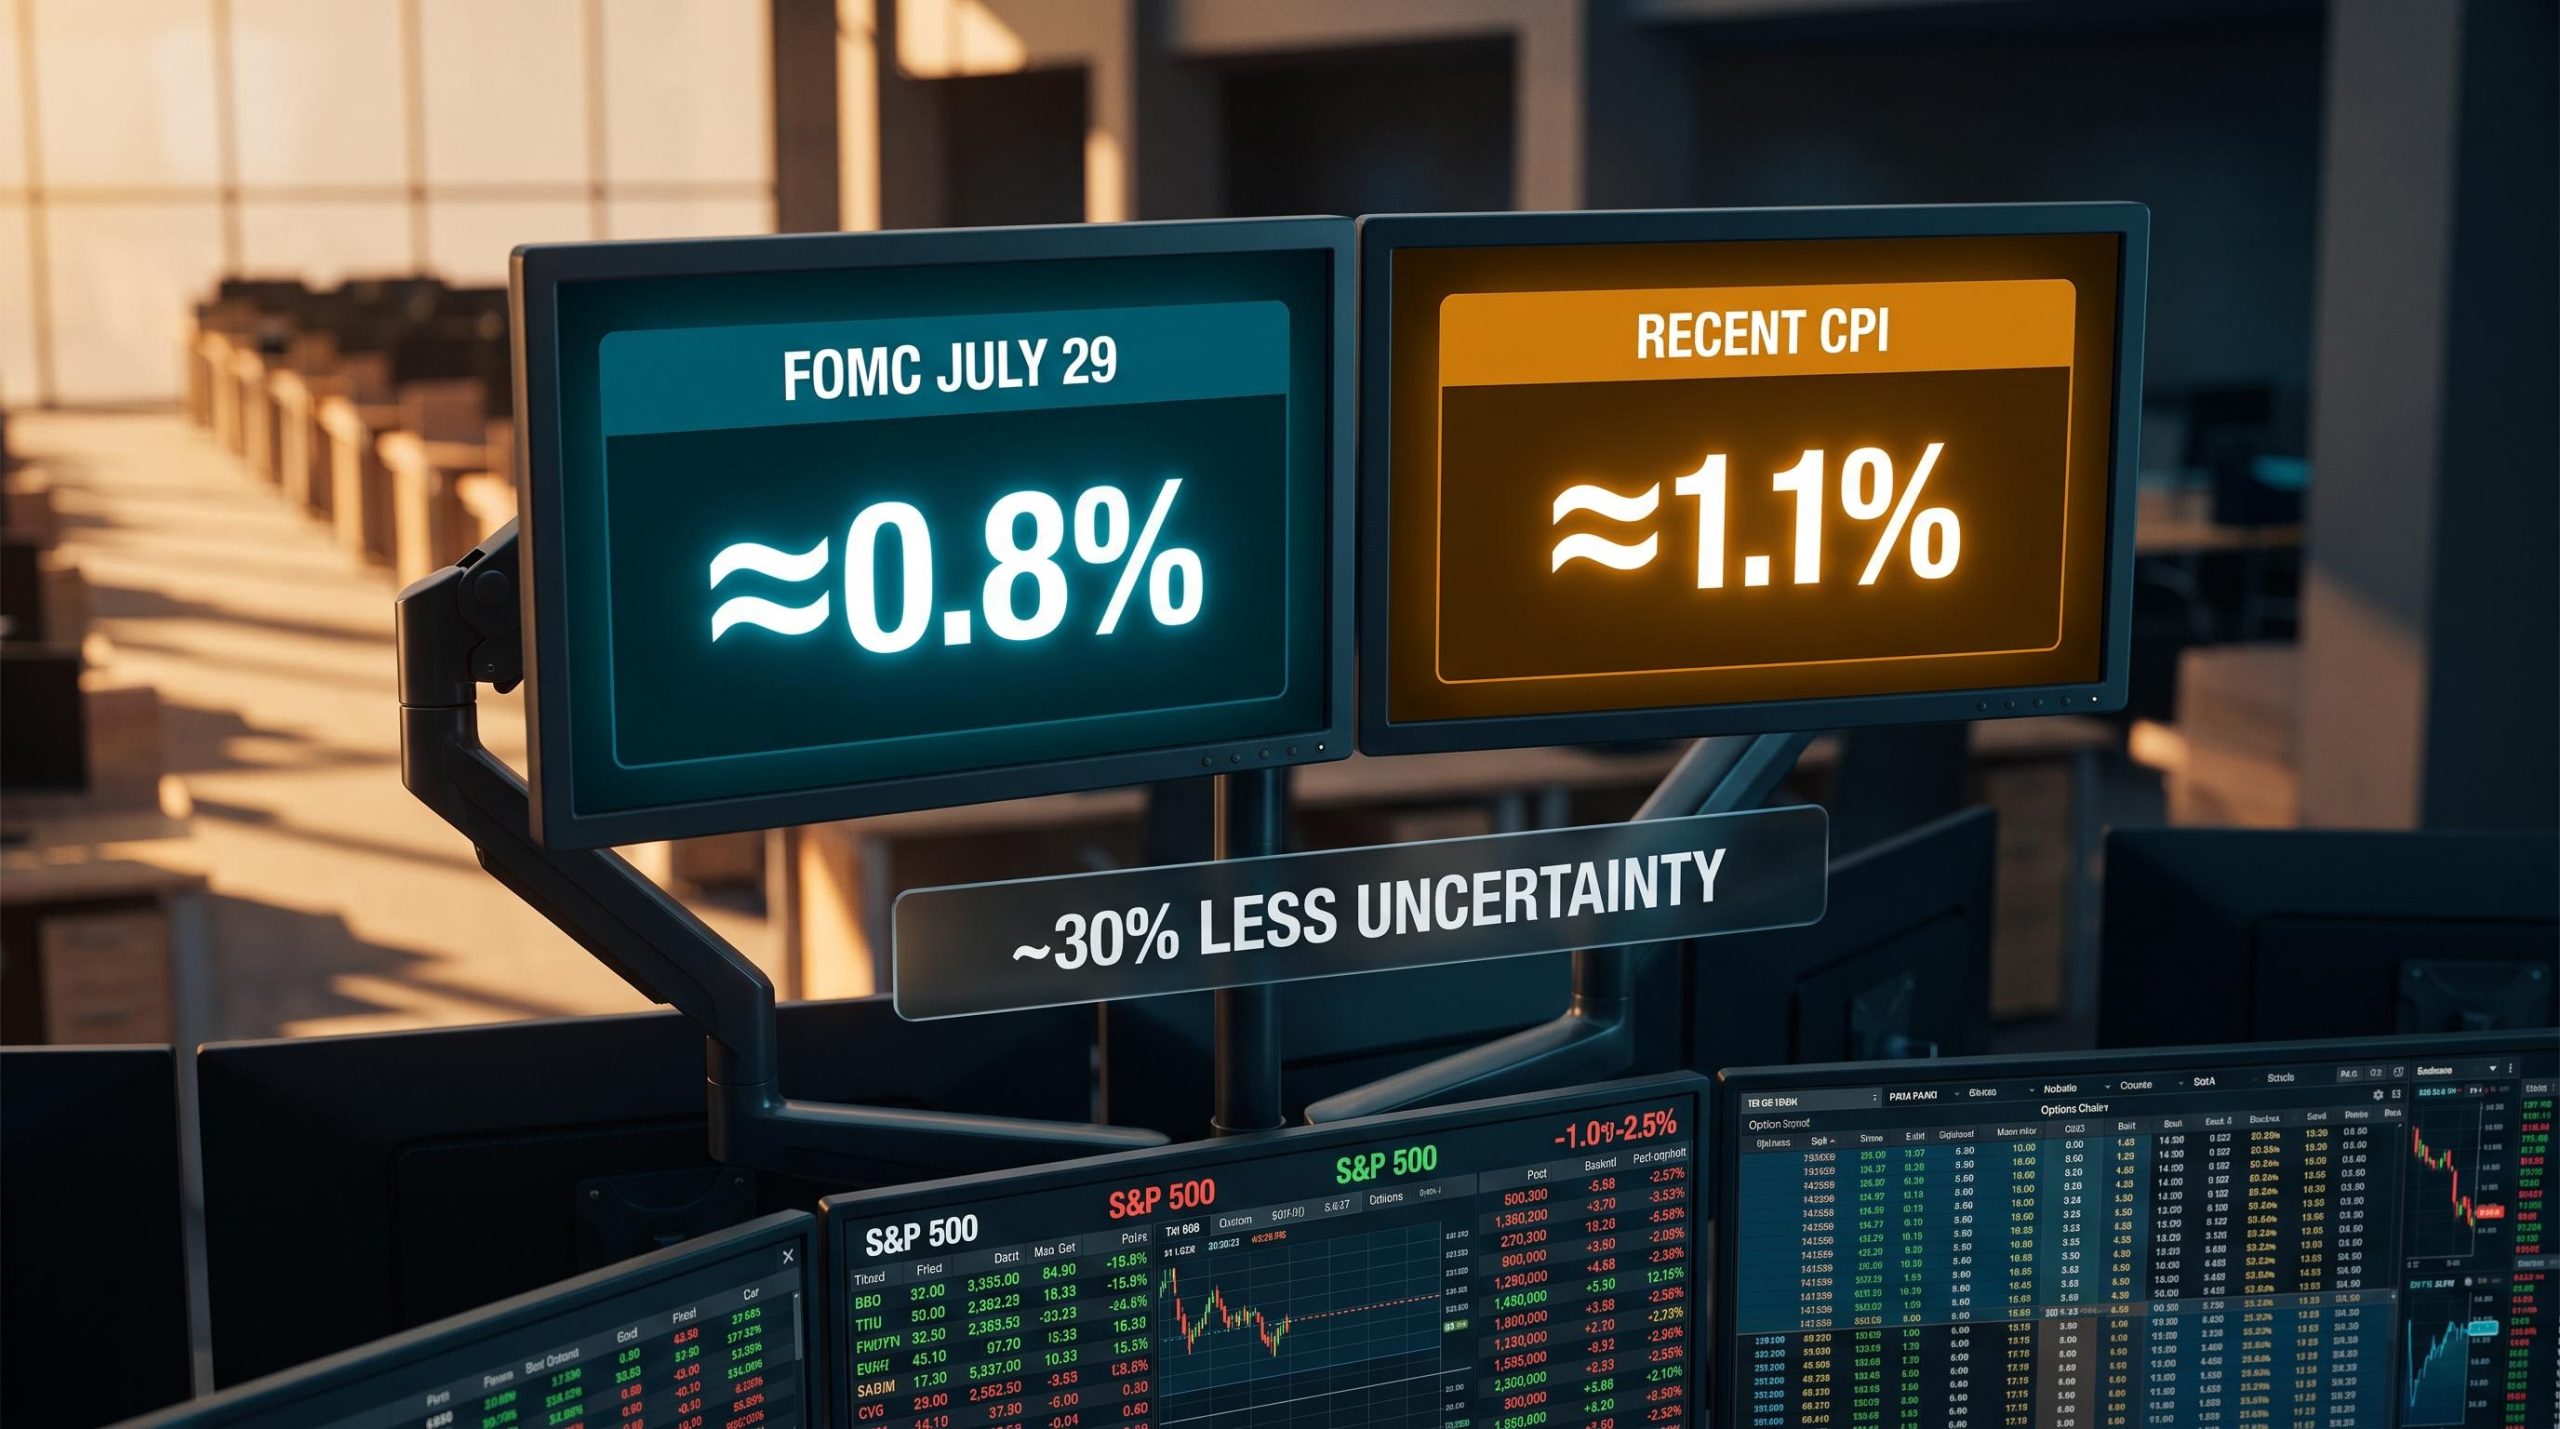
Options markets are telling a specific story about today’s Fed decision before a single word of the statement has been read: short-dated contracts on the S&P 500 imply a swing of around 0.8%, a figure that sits well below the 1.1% that options have typically embedded before recent CPI announcements. That gap is not noise. It is a precise signal about where professional traders believe the real uncertainty lives right now.
The July 28-29 FOMC meeting is widely expected to deliver a fifth consecutive hold at 3.50-3.75%, and that consensus is exactly why the options market looks the way it does today. When an outcome is predictable, the price of protection against surprise falls. Understanding why that happens, and how to read the signal, gives you a practical edge in interpreting any major macro event, not just this one.
After this piece, you will know how to look at an implied move figure for any upcoming Fed meeting or data release and understand what it is actually telling you about market confidence, uncertainty, and where the real risk is priced. That is a repeatable analytical lens you can apply to every macro event from here forward.
What options markets are saying about today’s Fed decision
Two figures define the options market’s read on today. JPMorgan, in a client note, placed the implied price move for the S&P 500 at around 0.8%, derived from contracts with a 29 July expiry. Saxo Bank, using a separate model and option set, estimated the implied move at approximately 0.63%, or roughly 47 points.
The difference between those two numbers reflects model variation, not a conflict. Both fall within the broadly cited 0.6-0.8% range. What matters is where they sit relative to other events the market is actively pricing.
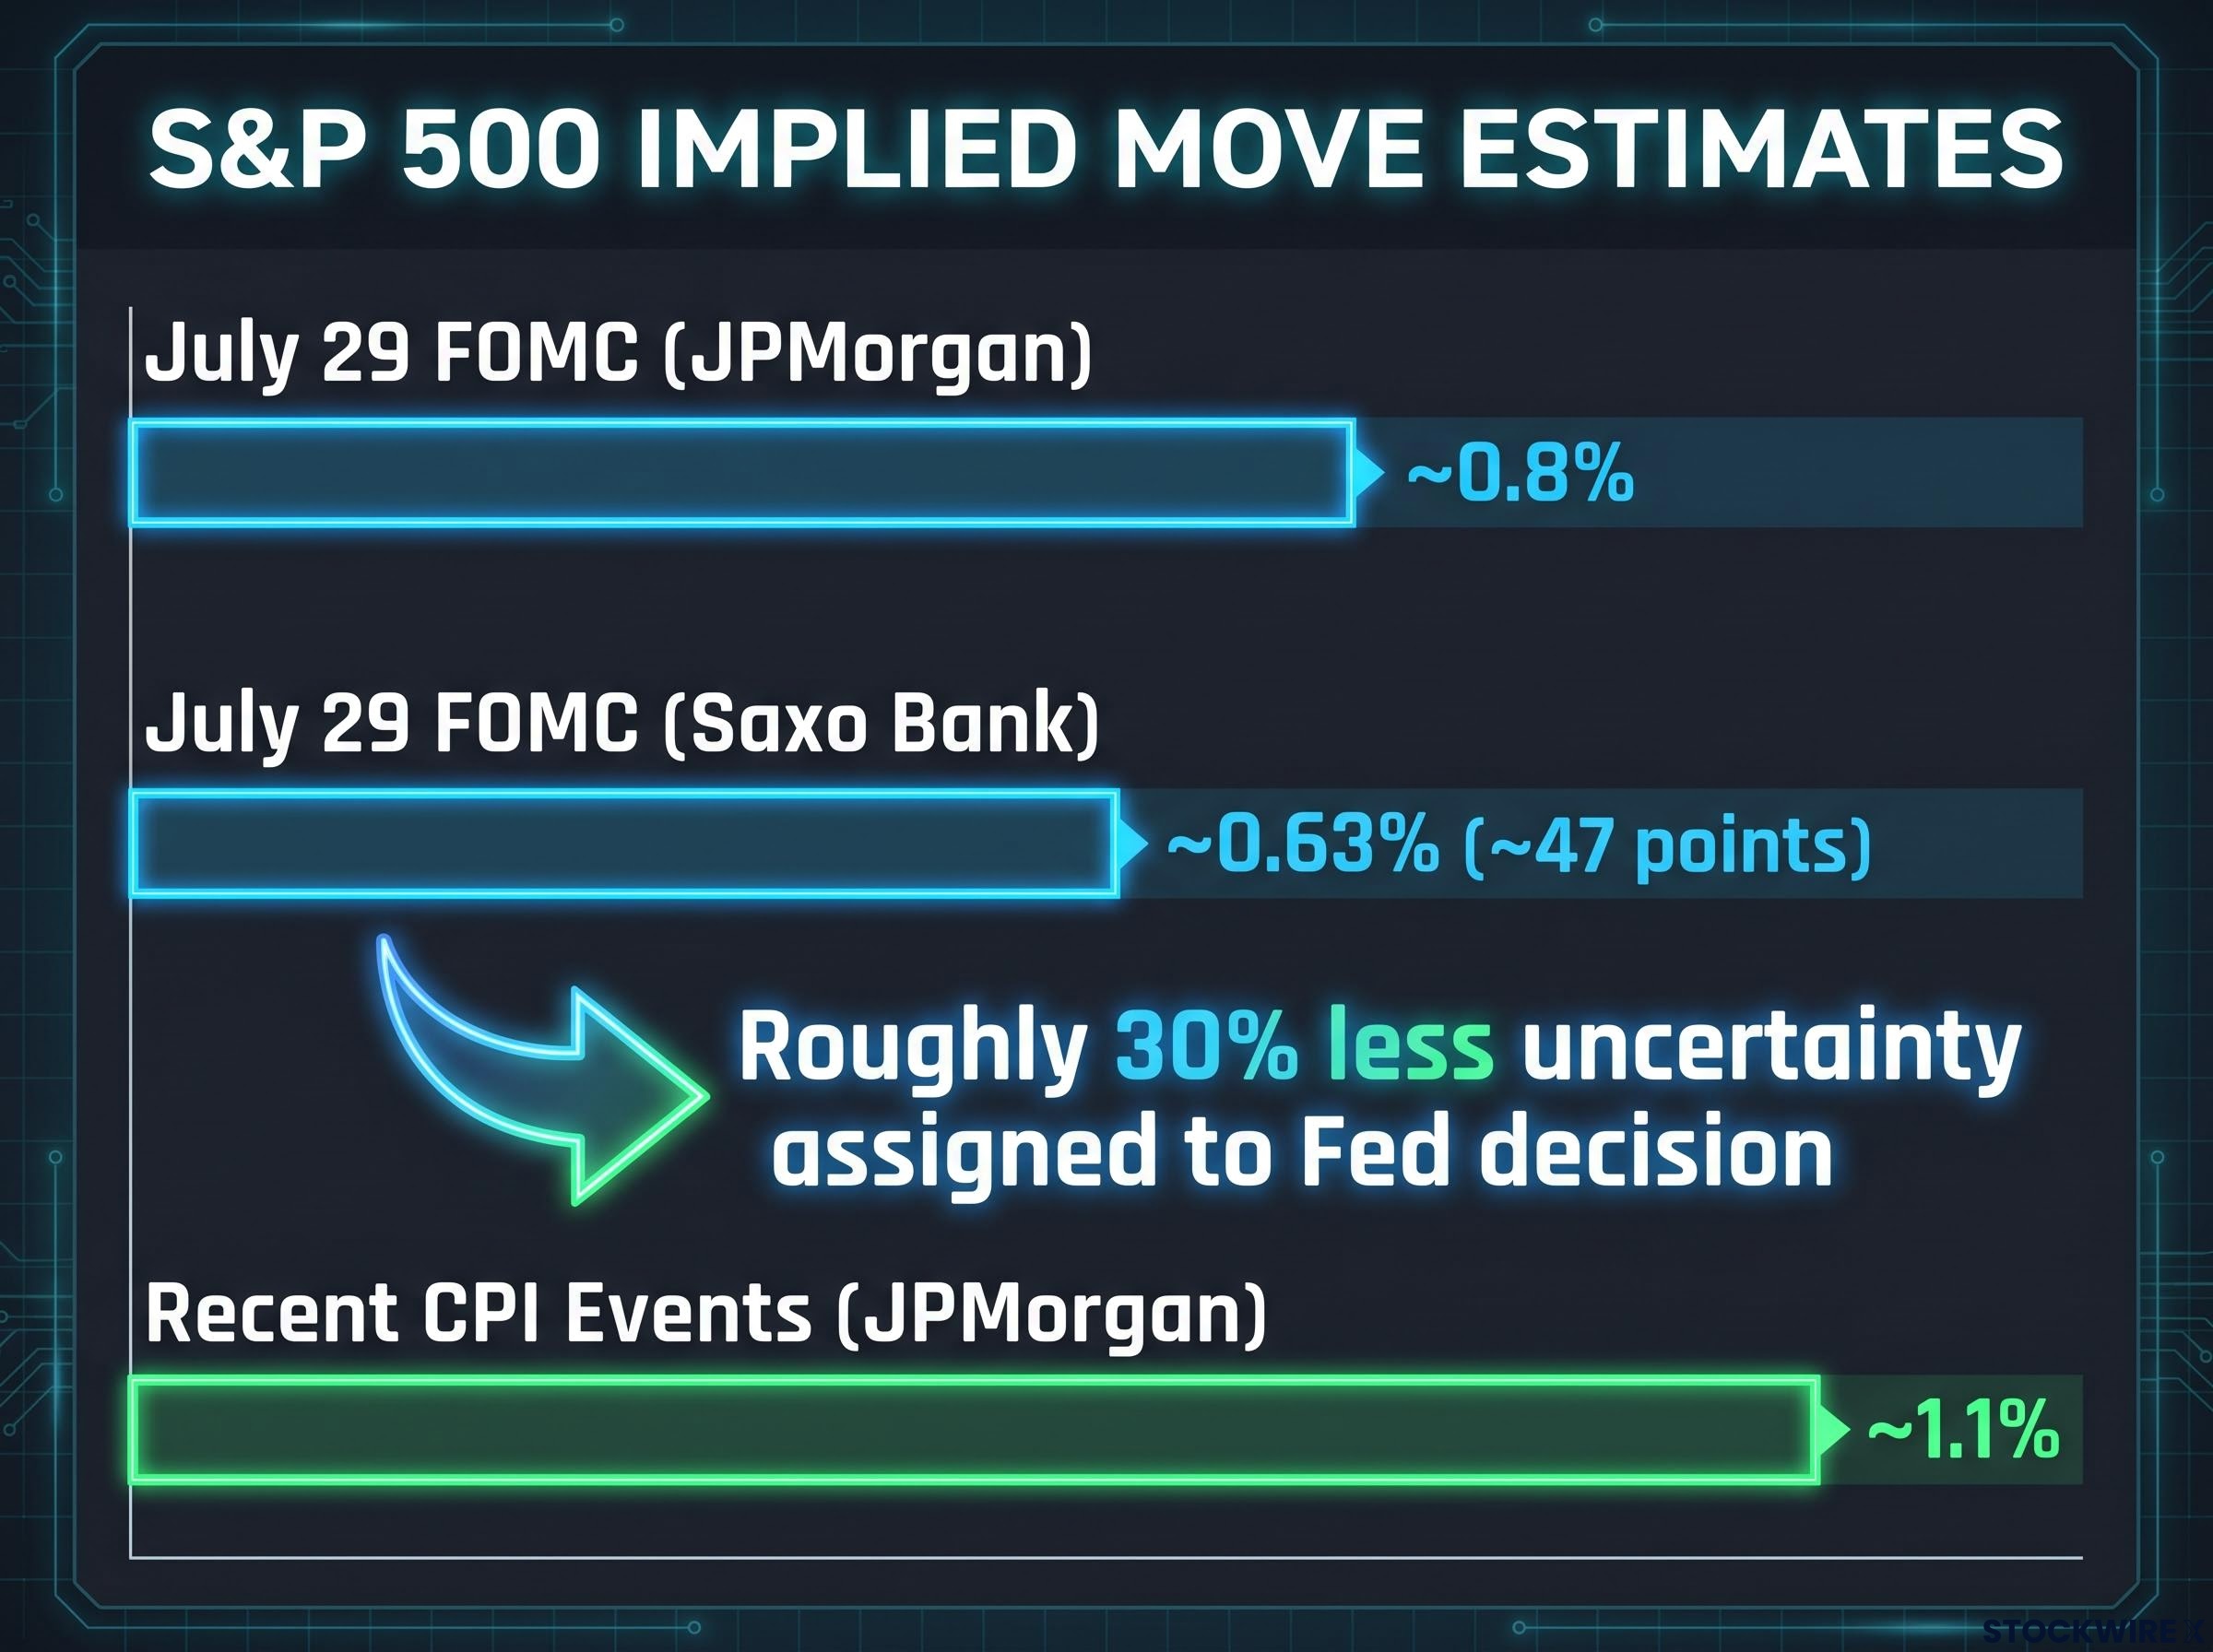
| Event type | Implied SPX move | Source |
|---|---|---|
| July 29 FOMC | ≈0.8% | JPMorgan client note |
| July 29 FOMC | ≈0.63% (~47 points) | Saxo Bank market note |
| Recent CPI events | ≈1.1% | JPMorgan client note |
Rate probability distributions reinforce the picture. CME-style futures and prediction markets show 60-76% probability of a hold, roughly 23-35% probability of a 25 basis point hike, and near-zero pricing for anything larger. This is the fifth consecutive meeting where a hold has been the dominant expectation since December’s quarter-point cut to 3.50-3.75%.
Why the CPI comparison is the key reference point
The anchor stat: According to JPMorgan, the implied move heading into today’s FOMC stands at around 0.8%, versus the 1.1% that has typically been baked into options ahead of recent CPI releases. Put another way, traders are assigning roughly 30% less uncertainty to the Fed decision than to incoming inflation data.
A figure like 0.8% in isolation tells you very little. You need a reference point. Comparing two different event types, a policy decision versus a data release, is what gives the FOMC implied move its analytical context. The 30% gap tells you that professional traders have already largely resolved their uncertainty about what the Fed will do today. They are directing their hedging dollars toward the data releases that will shape the Fed’s future path instead.
When big ASX news breaks, our subscribers know first
How implied moves are extracted from option prices
That 0.8% figure did not appear from nowhere. It was extracted from the prices traders are paying for very short-dated options, specifically contracts expiring on 29 July, designed to capture a single event’s expected impact.
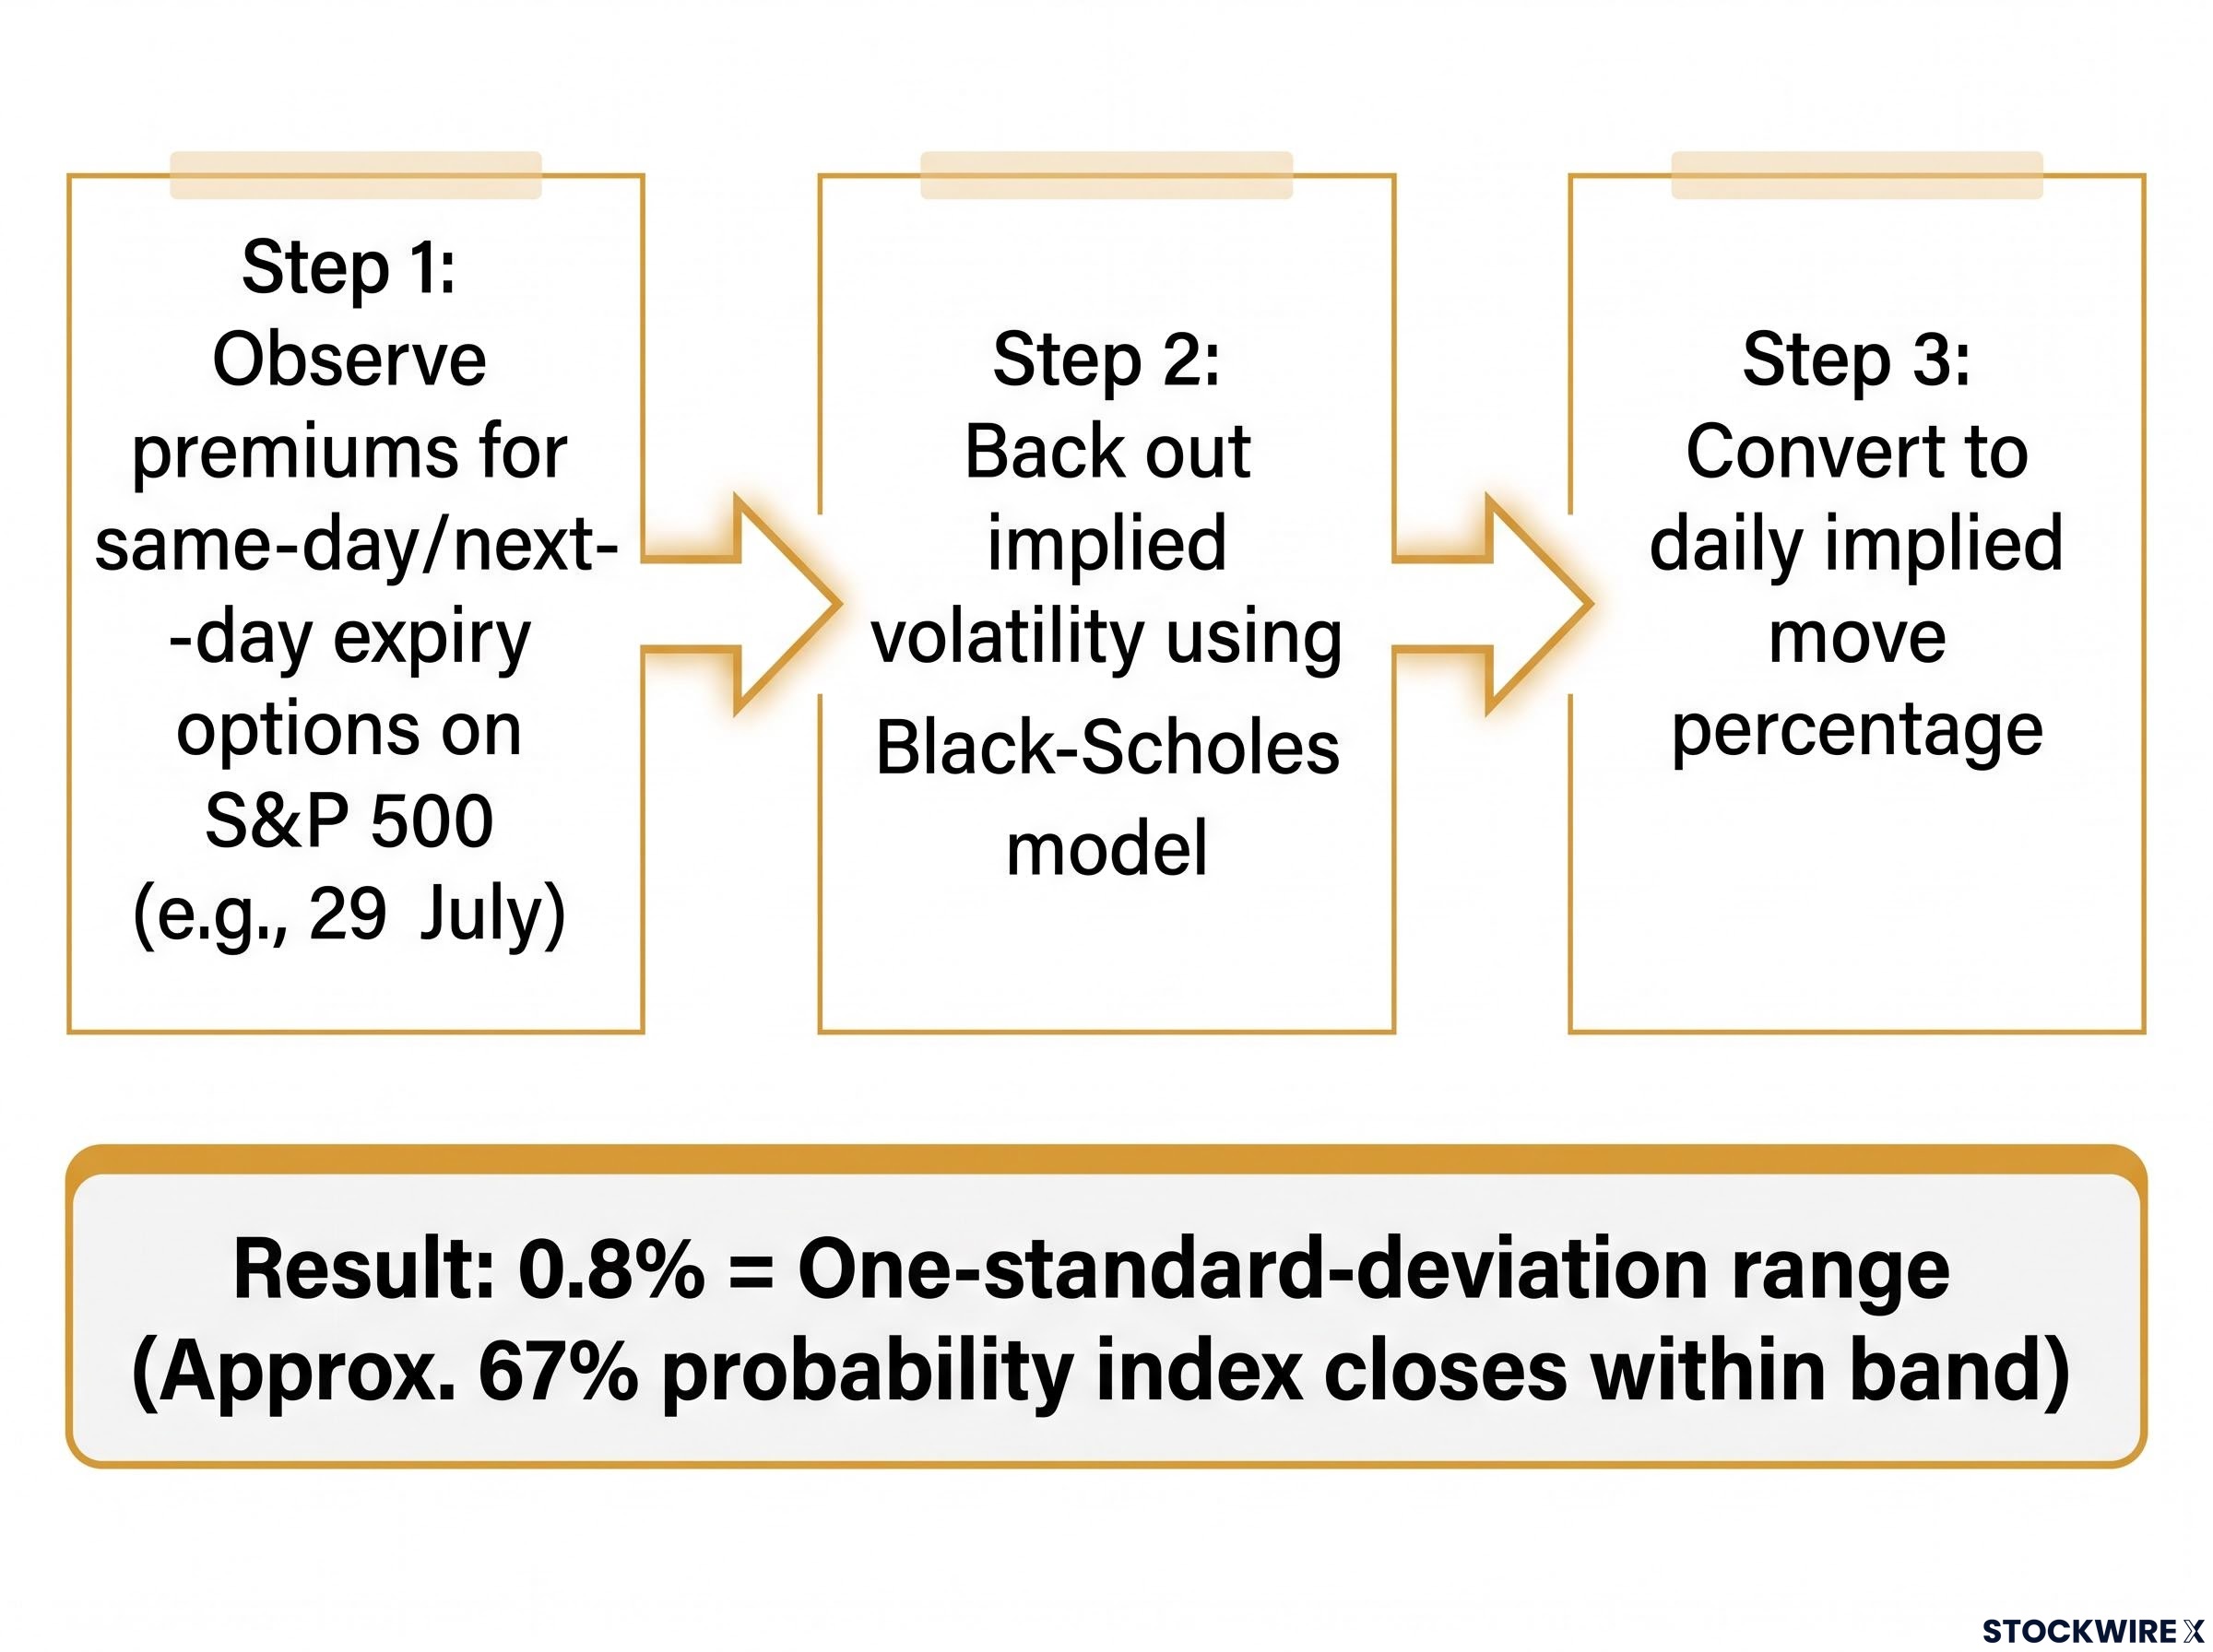
Here is the three-step process, simplified:
- Step 1: Observe the premiums traders are paying for same-day or next-day expiry options on the S&P 500.
- Step 2: Back out the implied volatility from those premiums using an option pricing model. Black-Scholes is the canonical framework, though you do not need to understand its mathematics to use the output.
- Step 3: Convert that implied volatility figure into a daily implied move percentage.
The result, in this case 0.8%, represents a one-standard-deviation range. In plain terms, that means approximately a 67% probability the index closes within that band on either side of its reference level. Larger moves are possible but are priced as tail outcomes.
Different desks produce slightly different estimates because they use different models and different sets of options. JPMorgan’s 0.8% and Saxo Bank’s 0.63% are not contradictory; they are two measurements of the same underlying signal.
The concept that matters most here: the 0.8% figure is not a forecast of what will happen. It is a measure of what the market is willing to pay to hedge against. That distinction is fundamental, and it is what makes implied move data useful rather than just interesting.
The same implied volatility signals that derivatives desks extract from short-dated options ahead of FOMC meetings apply directly to earnings events, where the comparison between current implied volatility and a stock’s 12-quarter historical average move reveals whether the market is pricing risk fairly or leaving it systematically underpriced.
Why this particular meeting is priced for low volatility
Start with the rate expectations. When 60-76% of the market prices a hold and nearly all of the remainder prices only a small 25 basis point hike, the distribution of plausible outcomes is narrow. A narrow distribution means less protection is needed, and less protection demand means lower option premiums.
60-76% probability of a hold at 3.50-3.75%, according to CME-style futures and prediction markets.
Add the Fed’s communication. The Federal Reserve has maintained a data-dependent stance throughout this cycle, and that framework has been remarkably consistent. Five consecutive holds since December’s cut, each accompanied by guidance that pointed to patience, have reduced the perceived probability of an abrupt surprise at any individual meeting. When a central bank’s reaction function is well understood, the event premium embedded in short-dated options compresses.
The Federal Reserve rate hold decision from June confirmed the target range remains at 3-1/2 to 3-3/4 percent, providing the consecutive-hold track record that has allowed traders to model the Fed’s behaviour with the confidence reflected in today’s compressed implied move.
Then ask where the genuine uncertainty actually sits. It is not in today’s decision. It is in the data that will arrive over the coming weeks and months:
Inflation data as the swing variable in Fed decision-making has become more concentrated than usual in 2026, with a 9-9 internal FOMC split meaning a single CPI print can effectively function as a casting vote on whether rates rise before year-end, which is precisely why options traders are directing their hedging dollars toward data releases rather than policy decisions.
- Narrow rate outcome distribution: Dominant probability of a hold compresses hedging demand directly.
- Clear Fed communication: A consistent, well-telegraphed reaction function reduces the likelihood of surprise, lowering the event premium.
- Real uncertainty residing in future data: Inflation and labour market prints, not today’s statement, will determine whether the Fed moves again and when. September remains the next plausible decision point for any additional tightening.
For you, this means the subdued implied move is not complacency. It reflects genuine analytical consensus built from futures pricing, forward guidance, and five meetings of continuity. That is a fundamentally different signal from a market that has simply stopped paying attention.
The gap between implied versus realised volatility is not unique to Fed meeting days; in 2026, implied volatility has run above 23% while realised daily moves have stayed below 14%, the same structural divergence that makes a sub-1% FOMC implied move meaningful when placed against the broader calendar of events driving hedging demand this year.
How to read implied move signals as an investor
You do not need to trade options to use this signal. Implied move figures are publicly available through financial data terminals and news coverage, and reading them as a confidence gauge costs nothing. Here is a practical framework you can apply before any major macro event:
- Find the implied move figure for the upcoming event. Financial news outlets and data providers routinely publish these ahead of FOMC meetings, CPI releases, and jobs reports. Today’s 0.8% is your baseline for a low-surprise event.
- Compare it to recent events of the same type. A figure of 0.8% means little on its own. Against the 1.1% typically priced for CPI, it tells you the market views this FOMC as materially less uncertain. If a future FOMC implied move jumped to well above 1%, that shift alone would signal a meaningful break in market confidence worth investigating.
- Track whether the realised move is larger or smaller than implied. This is where the calibration check lives.
The two-directional read is straightforward. A small implied move (sub-1%) signals market confidence in the expected outcome. A sudden spike to well above 1% signals that options traders see a materially higher probability of an unexpected shift. Monitoring that progression across successive meetings gives you an early warning system: a move from 0.8% to 1.5% between two consecutive FOMC meetings would be a significant change in market confidence, and it would arrive before the decision itself.
Implied versus realised: the calibration check
Once the meeting concludes, compare the actual market move to the implied figure. If post-FOMC moves are consistently larger than implied, it suggests markets are systematically underpricing Fed-day risk, possibly because traders are anchored to recent calm periods. That pattern, if sustained, tells you the event premium is too low and that protection is cheap relative to the actual uncertainty.
When realised moves consistently come in below implied, the opposite is true: traders are overpaying for protection, which itself signals excessive caution. Neither pattern persists indefinitely, but tracking the relationship over time sharpens your sense of whether the market’s confidence gauge is well-calibrated or drifting.
What this meeting’s pricing reveals about the macro moment
The compressed event premium across recent consecutive hold meetings is not an accident. It reflects something structural: markets have genuinely internalised the Fed’s reaction function. Five holds at the same rate, each accompanied by consistent language, have given traders enough data to model the Fed’s behaviour with relatively high confidence. A sub-1% implied move for today is representative of a deliberate, well-communicated policy period.
That confidence, however, is conditional. The real swing factors for the Fed’s next meaningful decision are not inside today’s statement. They are in the data releases that will arrive over the coming months:
- A materially surprising inflation print that shifts the trajectory of rate expectations.
- A significant labour market shift that changes the Fed’s calculus on economic resilience.
- A change in Fed communication tone that signals a departure from the current patient stance.
Any one of those would rapidly re-price future meeting implied moves upward. September remains the next plausible live meeting, and the implied move pricing around that decision will begin forming as soon as the next round of inflation and employment data arrives.
For you, the current calm in FOMC implied volatility is not a reason to stop paying attention to the Fed. It is a baseline. Any future spike in implied moves above this level would immediately stand out as a meaningful signal that the consensus has broken down and that genuine policy uncertainty has returned to the market.
The signal from today and what to watch next
Today’s 0.8% implied move reflects a market that has priced a specific, well-telegraphed outcome. The comparison to CPI’s 1.1% confirms that traders are directing their uncertainty toward data rather than the decision itself. The options market is telling you the Fed is not the source of surprise today; the numbers that feed into the Fed’s next decision are.
You now have a framework to apply to every upcoming FOMC meeting and major macro event. Find the implied move, compare it to the same event type’s recent history, and track whether the actual move comes in above or below the market’s expectation.
The specific action from here: note today’s realised move against the 0.8% implied baseline once markets close. Then begin watching implied move pricing for the September meeting as futures data becomes available. That is when the next genuine policy uncertainty is likely to crystallise, and the implied move figure will tell you how seriously the market is taking it before the decision arrives.
For readers wanting to understand the specific inflation data that will dominate September meeting pricing, our full explainer on June core CPI and its rate-cut implications covers how the largest downside miss in over a year has shifted rate-sensitive asset positioning and what it means for the Fed’s next decision point.
This article is for informational purposes only and should not be considered financial advice. Investors should conduct their own research and consult with financial professionals before making investment decisions.
—