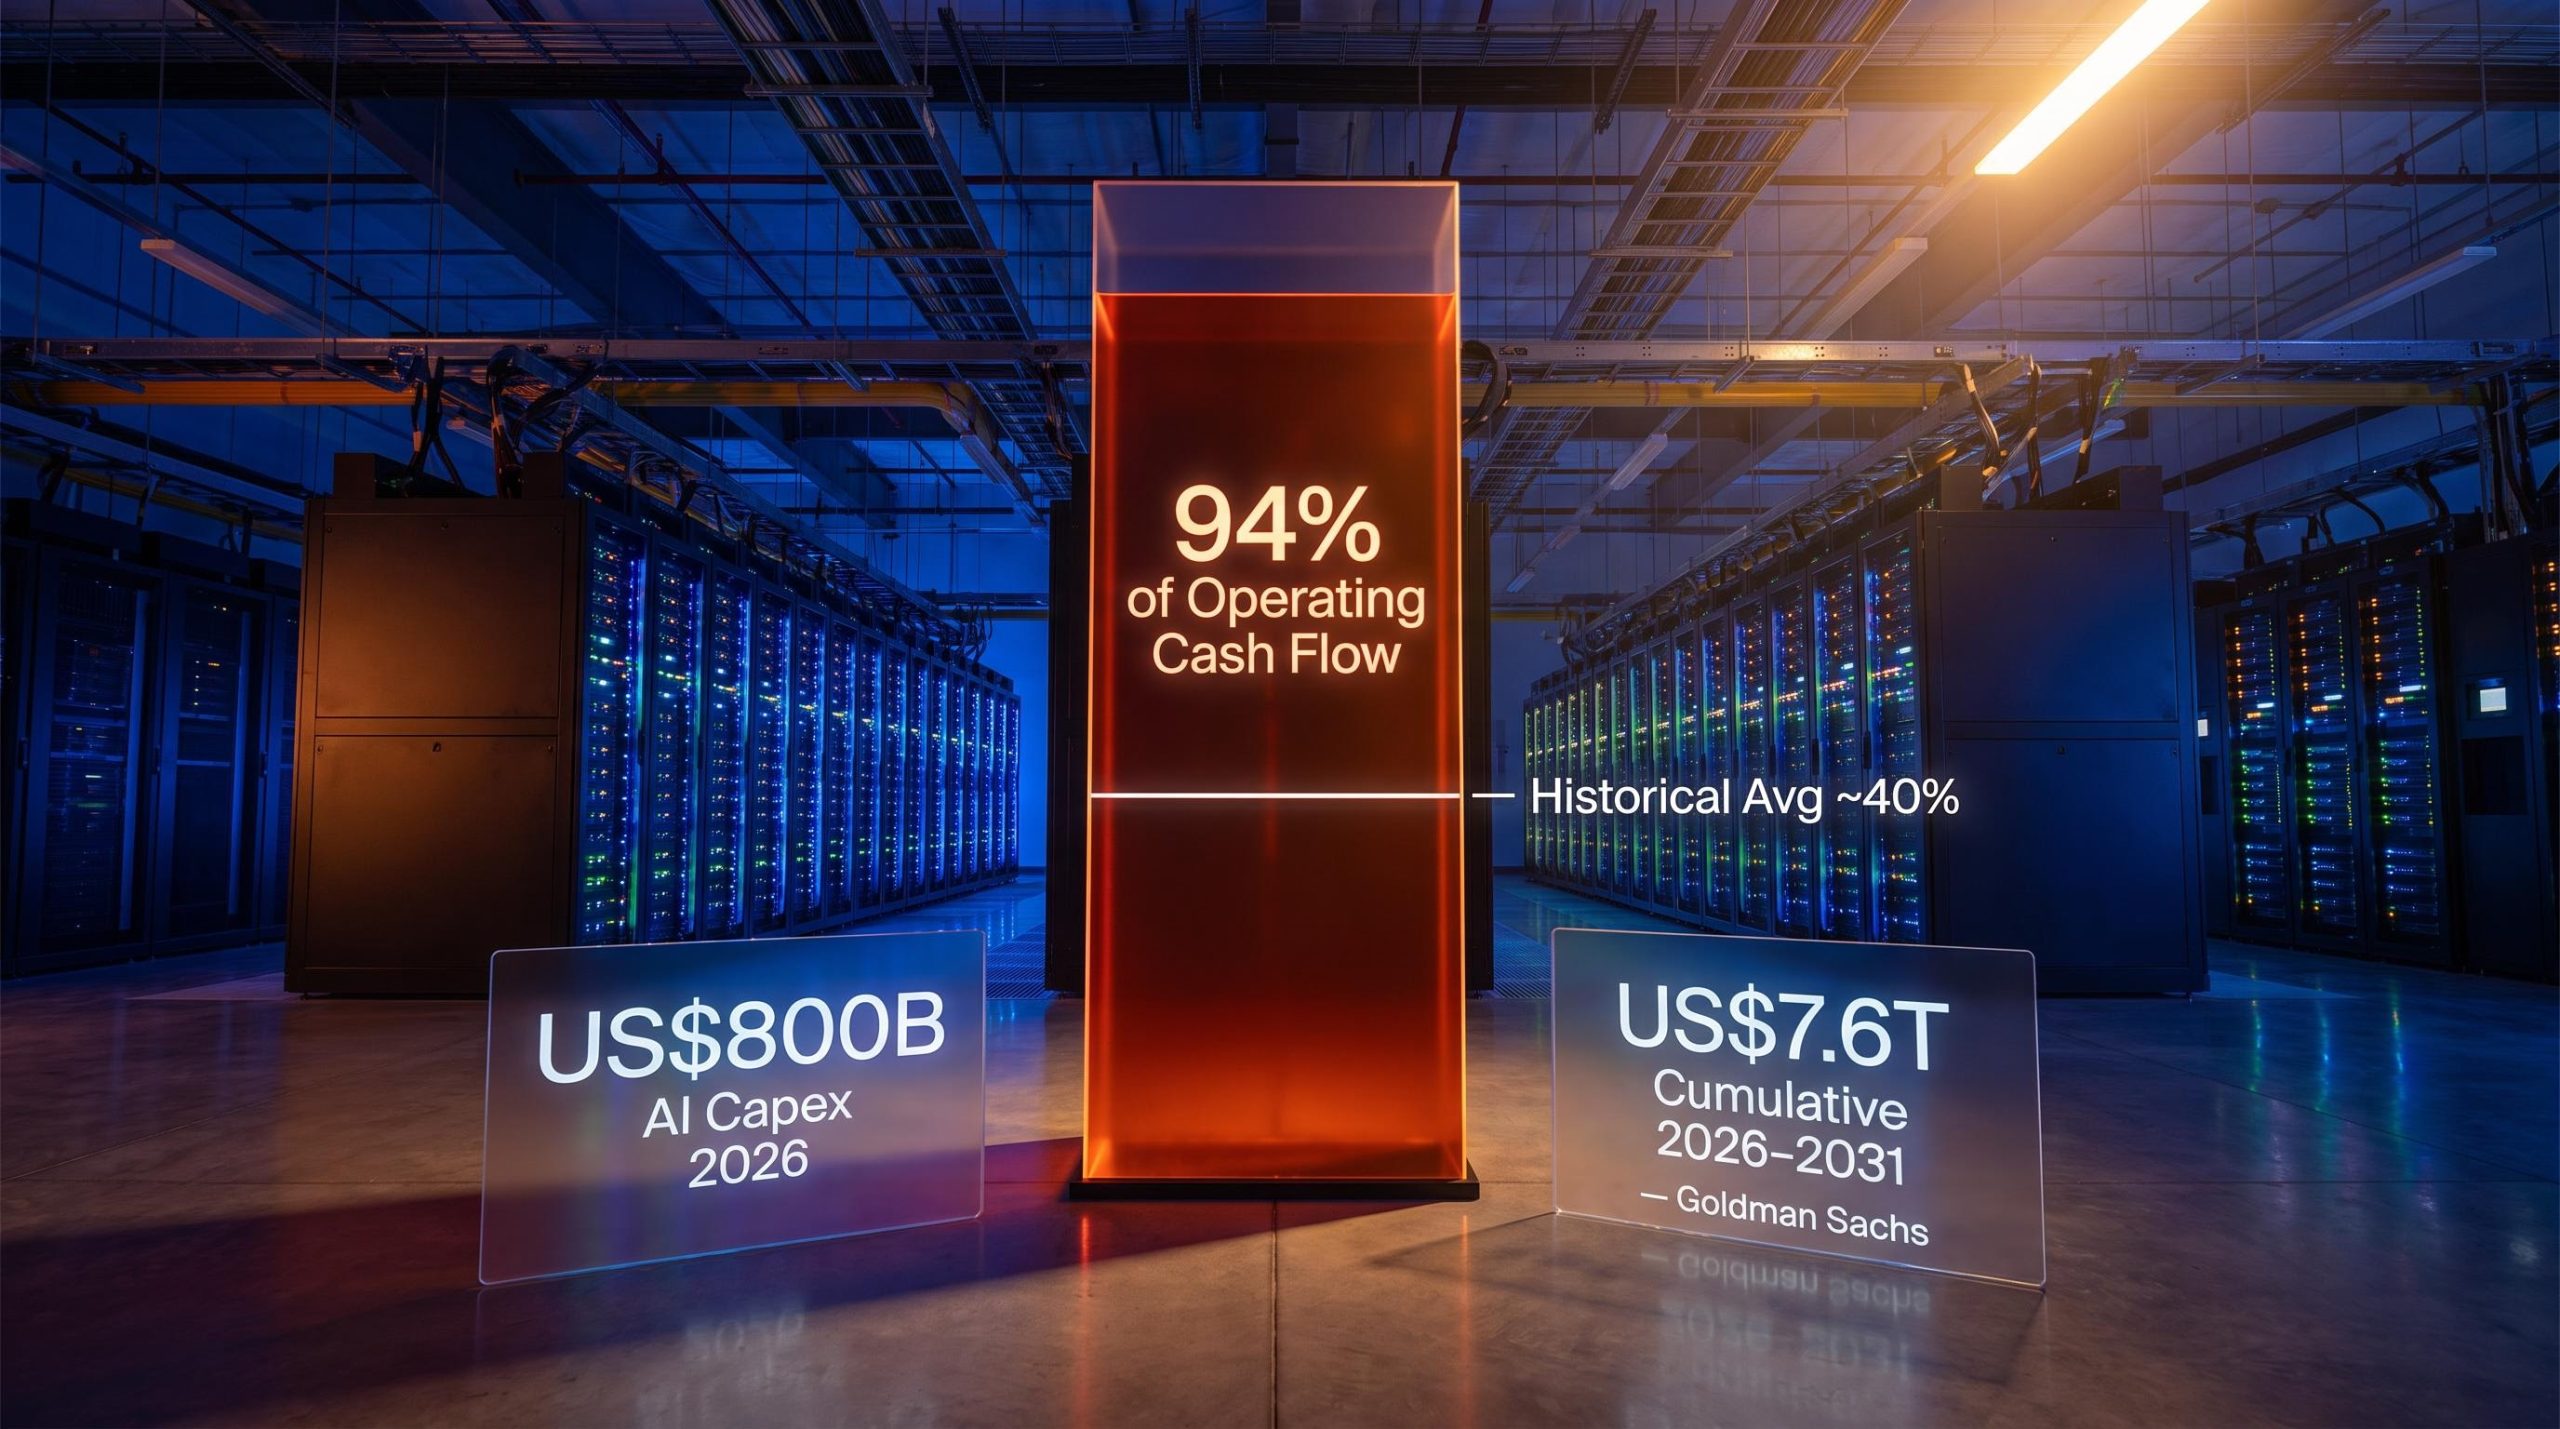
“The numbers sound like a bull case on their own: hyperscalers are projected to spend approximately US$800 billion on AI infrastructure in 2026, with Goldman Sachs forecasting cumulative spend of US$7.6 trillion between 2026 and 2031. But here is the figure markets are actually trading on: hyperscaler capital expenditure this year is on track to account for close to 94% of operating cash flow, a dramatic increase from the historical norm of roughly 40%. Spending at scale and making money from that spending are two very different things.\n\nMarkets in the first half of 2026 made the distinction explicit, rotating sharply toward infrastructure hardware and away from application-layer software after a single shift in AI architecture, the emergence of agentic AI, which knocked roughly US$2 trillion off software market capitalisations at its peak. The AI capital cycle is real, large, and accelerating. But it is not homogeneous, and treating it as a single investable theme produces portfolios that conflate very different risk profiles.\n\nHere is how to read the AI capital cycle layer by layer: where durable profits are being generated today versus where they are being promised for later, and a structured framework for evaluating AI-linked positions in a portfolio context. Where you sit in the stack matters more than knowing the aggregate spend figures.\n\n## The scale of the build-out, and why the cash flow number matters more than the headline figure\n\nThe headline numbers are extraordinary. Goldman Sachs models approximately US$765 billion in AI-targeted capital expenditure for 2026, and consensus estimates after first-half earnings revisions push the broader figure toward US$800-900 billion, with 2027 expected to exceed US$1 trillion. JPMorgan projects US$5.5 trillion in AI-related capital expenditure through 2030. Goldman’s long-run model sees cumulative spend reaching US$7.6 trillion between 2026 and 2031.\n\nIndividual hyperscaler guidance gives shape to the aggregate:\n\n1. Amazon: approximately US$200 billion flagged for 2026\n2. Alphabet: approximately US$175-185 billion, with some guidance trending higher\n3. Meta: approximately US$115-135 billion\n4. Microsoft: approximately US$120-190 billion, depending on fiscal and calendar framing\n\nThe ranges are wide, and the revisions have been consistently upward.\n\n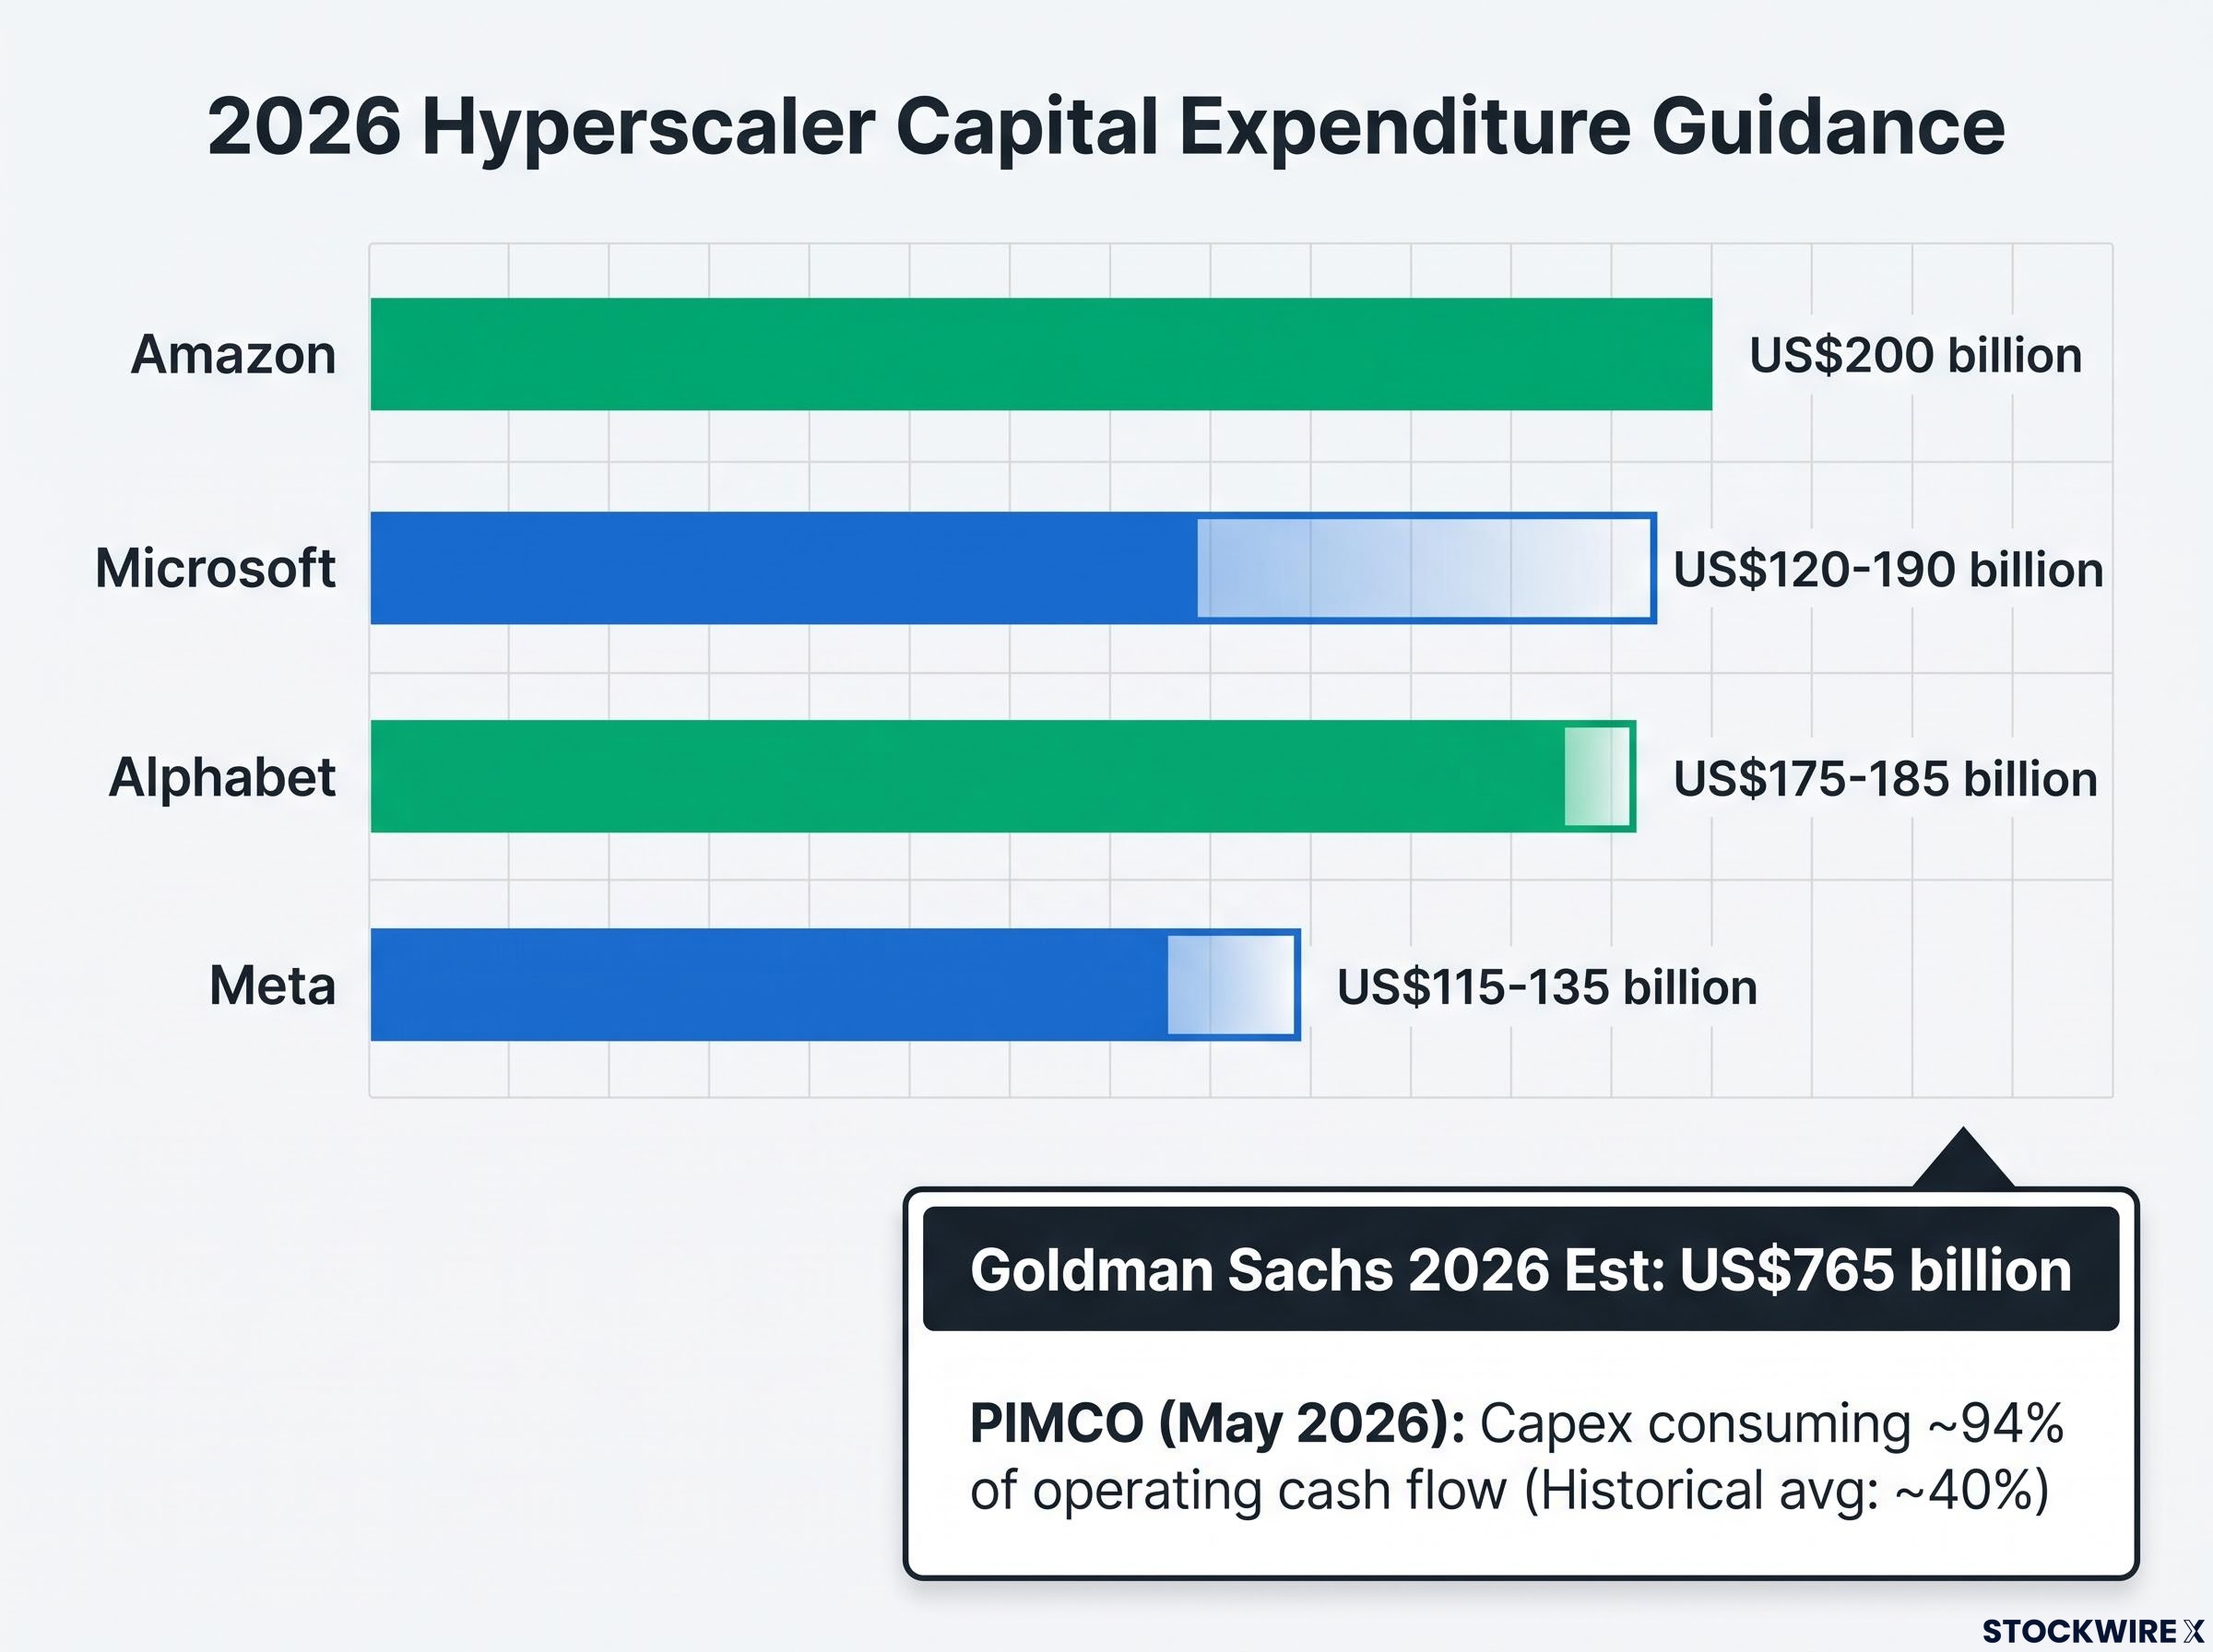 \n\nBut here is where the investment signal actually lives. According to PIMCO’s May 2026 analysis, \”AI Credit Expansion: Assessing the Micro and Macro Risks\”:\n\n> Capital expenditure is projected to consume approximately 94% of hyperscaler operating cash flow in 2026, compared with a historical average of around 40%.\n\nThat compression tells you something the headline spend figures do not. Hyperscalers are effectively pre-funding a long-duration monetisation thesis, betting that today’s infrastructure translates into durable platform revenues over many years. Every time you hold these stocks, you are underwriting that same thesis. Upward revisions to capital expenditure forecasts are not a buy signal on their own; the question is whether the cash coming back justifies the cash going out.\n\n## Where the money is actually flowing: reading the value chain from infrastructure to software\n\nThe AI capital cycle has a layered structure, and each layer carries a different risk profile. Understanding where a company sits in the stack is a precondition to evaluating its investment case.\n\nMapping value-chain position precisely matters because a GPU designer, a copper miner, and a foundation model company occupy structurally different AI supply chain layers with different moat types, macro sensitivities, and binding constraints, even though all three are routinely described as AI plays in the same analyst coverage.\n\nAt the base sits infrastructure hardware: chips, servers, networking equipment, data centres and power systems. IDC estimates AI infrastructure hardware spending alone at US$497 billion in 2026, up approximately 56% year on year from US$318 billion in 2025. Supply scarcity in leading-edge GPUs and advanced packaging capacity is supporting exceptional pricing power for top-tier hardware vendors, with backlog visibility stretching across multiple quarters.\n\nThat scarcity premium is real. It is also finite. Enormous capital is being deployed to expand foundry, packaging and data centre capacity. AI accelerators that are state-of-the-art in 2025-2026 can be economically obsolete within a few years. If you hold semiconductor positions at current valuations, the question is whether your thesis accounts for the capacity expansion already underway, or whether it assumes scarcity persists longer than industry buildout timelines suggest.\n\n
 \n\n
\n\n
\n
\n\n\n\n\n\n\n\n\n\n\n\n\n\n\n\n\n\n\n\n\n\n\n\n\n\n\n\n\n\n\n\n\n\n\n\n\n\n\n\n\n
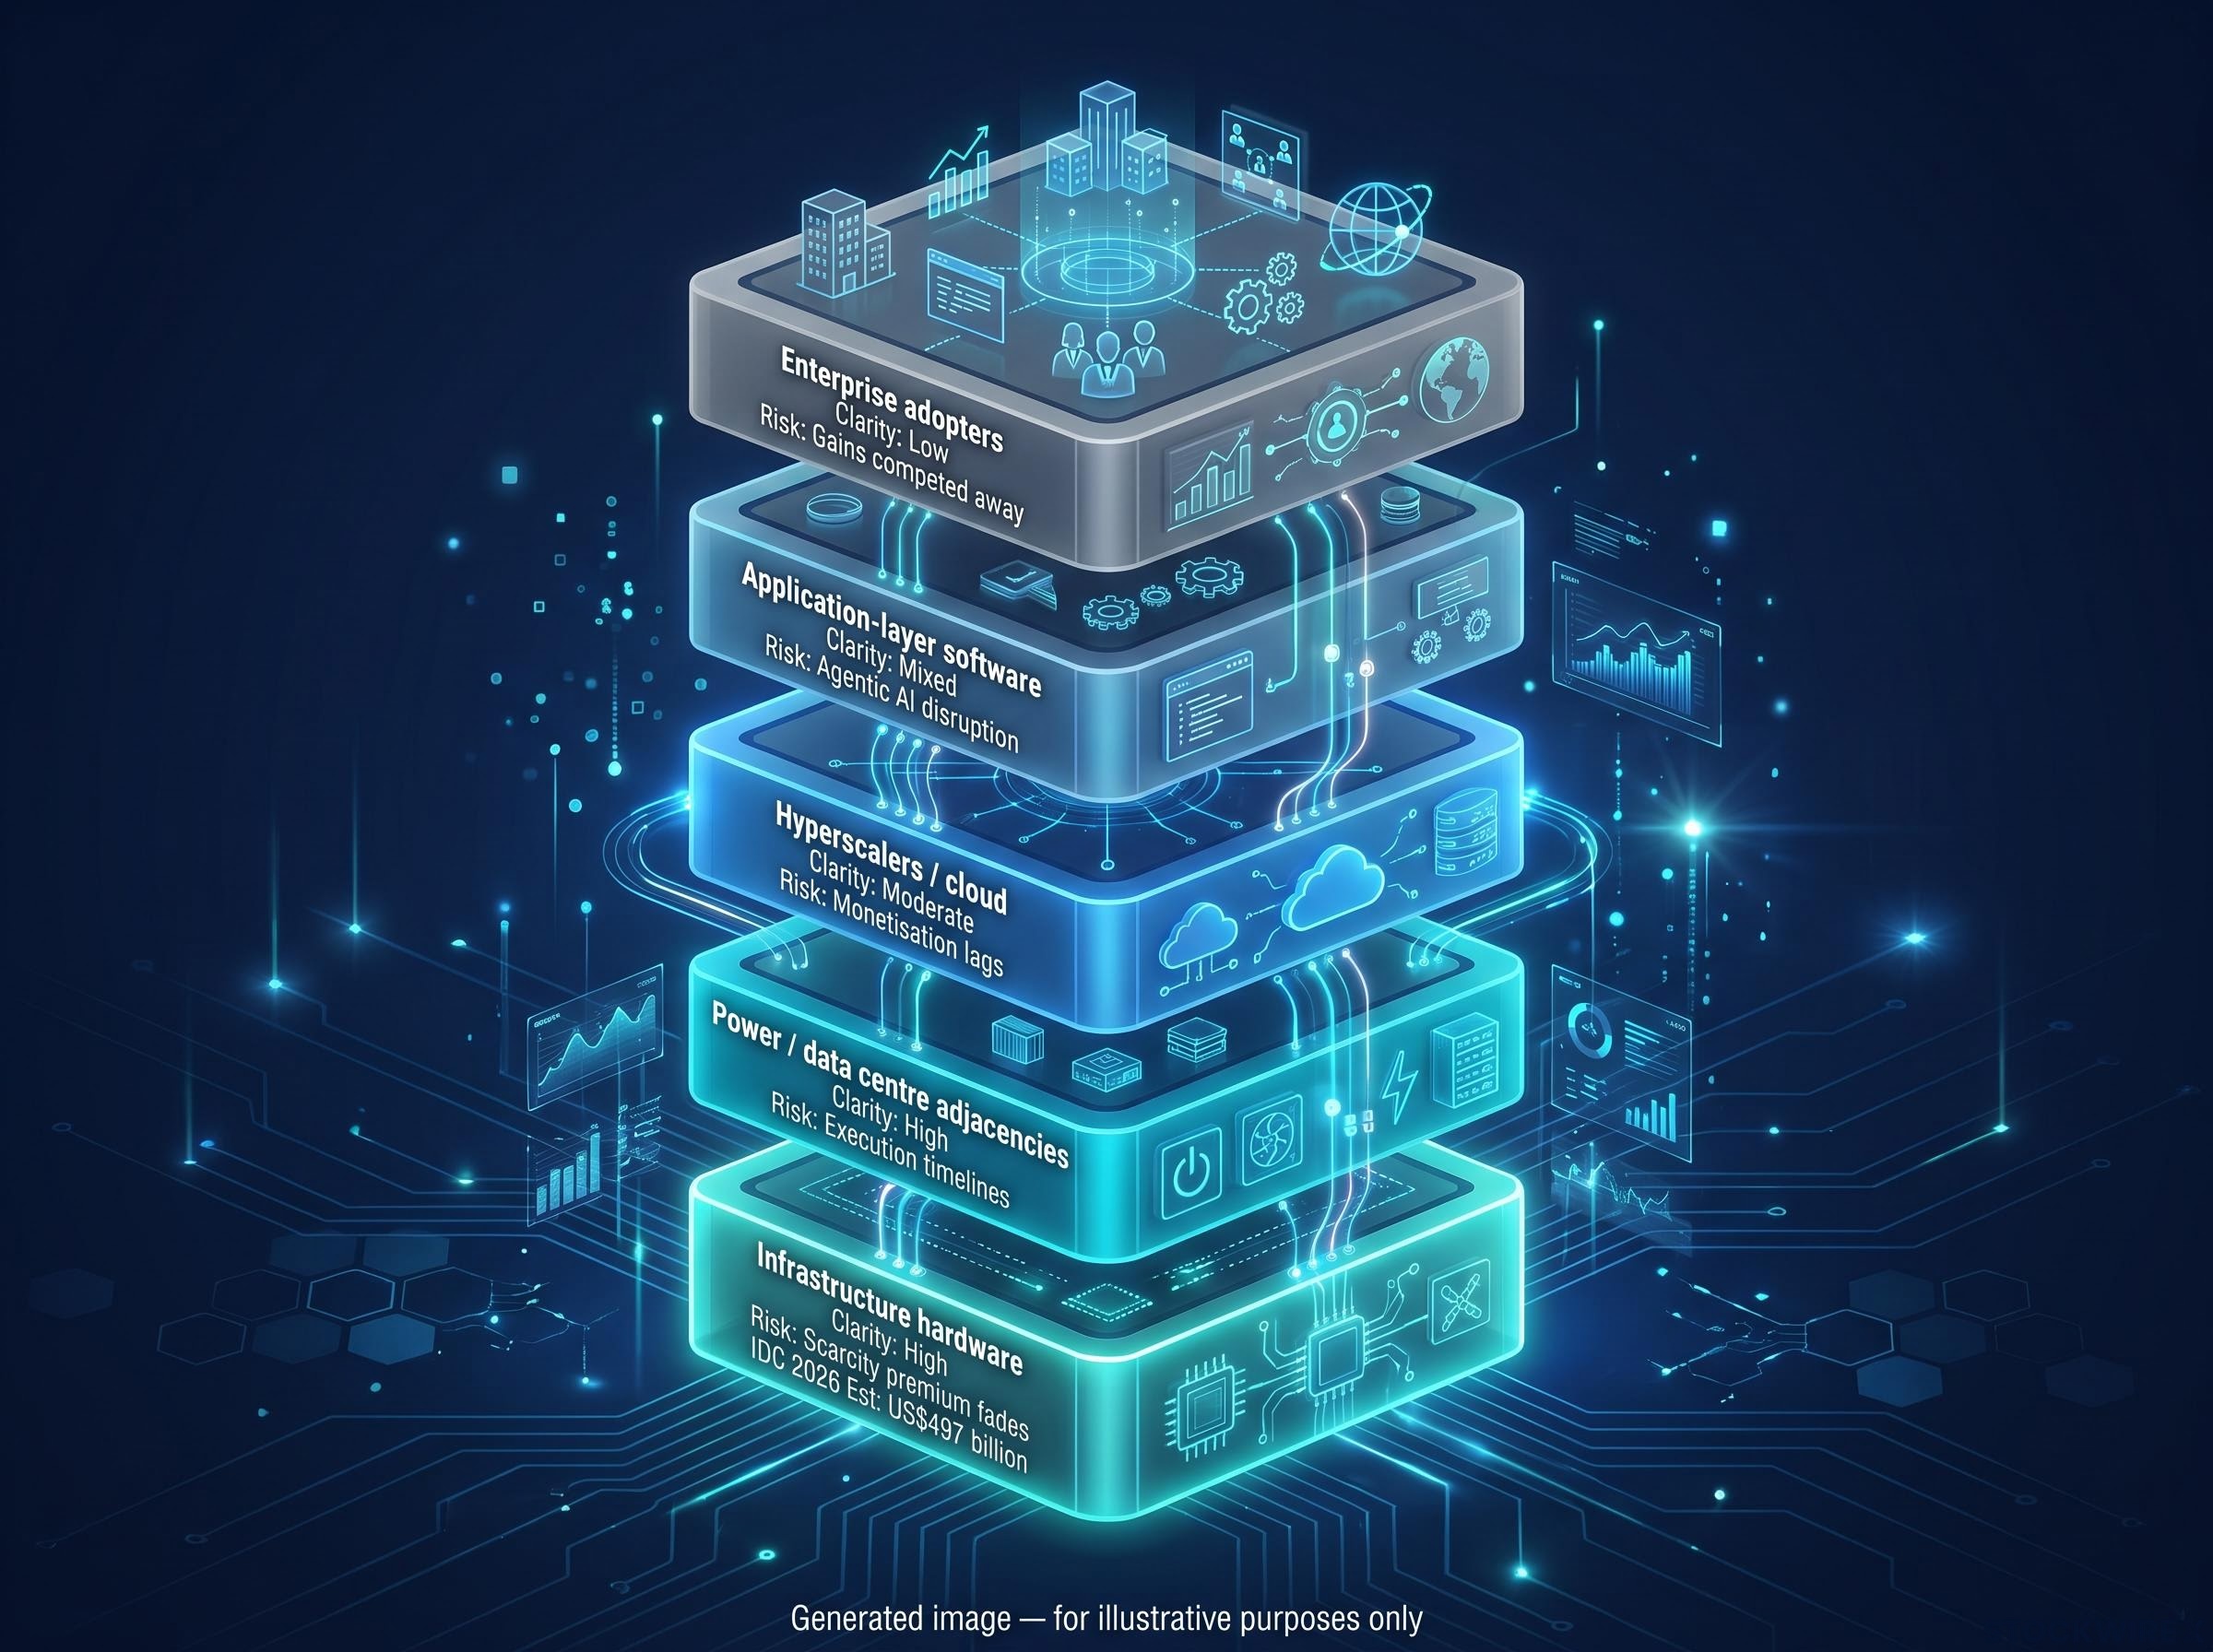
| Layer | Examples | Near-Term Profit Clarity | Primary Risk |
|---|---|---|---|
| Infrastructure hardware (chips, servers, networking) | GPU designers, server OEMs, optical interconnects | High: backlog visibility, scarcity pricing | Scarcity premium fades as capacity expands |
| Hyperscalers / cloud platforms | Large-scale cloud and AI platform operators | Moderate: revenue growing, free cash flow compressed | Monetisation lags capex; long-duration thesis |
| Application-layer software | Enterprise SaaS, vertical AI solutions | Mixed: depends on pricing model adaptability | Per-seat models disrupted by agentic AI |
| Enterprise adopters (non-vendors) | Companies using AI for productivity gains | Low standalone: AI is a lever, not a thesis | Gains competed away into lower prices over time |
| Power / data centre adjacencies | Utilities, data centre REITs, cooling specialists | High: contracted or regulated revenues | Lower upside; execution risk on buildout timelines |
\n
\n\n### Power, data centres and the contracted-revenue angle\n\nBeyond chips and hyperscalers, a distinct set of infrastructure adjacencies offer a different risk profile entirely. Data centre developers and REITs, electric utilities, grid operators, and specialist cooling and fibre providers benefit directly from AI-driven demand growth. The difference is that their revenues tend to be contracted or regulated, with less direct exposure to whether any given AI application succeeds.\n\nHyperscaler expansion into Asia-Pacific is driving regional data centre demand, with Australia emerging as one of the key hubs. For Australian investors, industrial REITs with data centre exposure, electricity utilities and engineering firms tied to large infrastructure projects represent domestic pathways into the AI capital cycle. These exposures may offer diversifying cash flow profiles, including regulated returns and contracted rents, compared with the higher-beta positioning of owning US semiconductors or hyperscalers outright.\n\n## What agentic AI did to software valuations, and what it revealed about pricing-model risk\n\nThe sell-off was sudden and severe.\n\n> At its worst point, the arrival of agentic AI systems stripped approximately US$2 trillion from the collective market value of software stocks, as investors reassessed the durability of existing business models.\n\nAgentic AI refers to systems that can autonomously execute multi-step workflows, completing sequences of tasks that previously required human oversight at each stage. The economic implication is structural: one AI agent can potentially execute the work of multiple human users across the same application stack, breaking the proportionality between software value and human headcount that underpins per-seat SaaS pricing.\n\nThe market repriced accordingly. Then leading software companies recovered by shifting from per-user charges to billing based on AI-completed work, helping revenue hold up as automation displaced headcount. The episode was not an overreaction. It was a logical repricing of a real business-model risk, followed by a recovery among companies that demonstrated pricing-model adaptability.\n\nAI-native competitors are entering enterprise markets with consumption-based models designed to undercut incumbent SaaS costs by 80-90%, and the mechanism driving per-seat pricing erosion is more structural than cyclical: one AI agent executing work across multiple user contexts removes the proportionality between headcount and software spend that justified the legacy model.\n\nFor a reader holding diversified software exposure, the diagnostic questions are now specific:\n\n- Does the company own the workflow, or does it just provide a tool within someone else’s workflow?\n- Has its commercial model already shifted to usage-based or outcome-based pricing?\n- Can the company demonstrate stable or rising revenue even as customers automate tasks and reduce human headcount?\n- Is AI a feature bolted onto the existing product, or is the platform the orchestrator of AI agents?\n\nSoftware is no longer a homogeneous sector bet. The pricing model a company uses is now as important as the product it sells. Companies that passed the test recovered; companies that could not answer those questions have not.\n\n## How the boom is being financed, and what that means for the risk profile\n\nGiven that hyperscaler capital expenditure is running at close to 94% of operating cash flow, hyperscalers are increasingly turning to debt issuance to bridge the gap between investment plans and internal cash generation. JPMorgan’s upward revision of AI-related capital expenditure to US$5.5 trillion through 2030 specifically cites increased debt financing as a driver.\n\nThis is a structural shift. For the better part of a decade, mega-cap tech companies were defined by fortress balance sheets, self-funding their growth from internal cash flows and returning excess capital to shareholders. That description no longer fits the current cycle. Some hyperscalers are now issuing debt at scale while simultaneously maintaining shareholder return programmes, a combination that adds leverage to what equity investors have traditionally treated as a low-leverage allocation.\n\nFor credit investors, this shift creates opportunity. Investment-grade bond supply from historically cash-self-sufficient technology companies offers a new access route to AI-linked cash flows. For equity investors, the implications are different and less straightforward. Leverage adds an interest-rate sensitivity dimension to the AI monetisation thesis, meaning the timing of revenue realisation now interacts with rate cycles and credit spreads, not just topline growth.\n\nThe monitoring metrics for financing sustainability are specific:\n\n- Is the capital expenditure-to-operating-cash-flow ratio widening or stabilising over successive quarters?\n- Is the trend in debt issuance accelerating relative to shareholder return programmes?\n- How sensitive is the business model to higher-for-longer interest rates?\n\nAccording to PIMCO estimates, the convergence of AI, defence and energy-security spending could add approximately US$14 trillion to global capital expenditure across roughly five years beginning in 2026. Debt-funded growth has different risk characteristics than equity-funded growth in an elevated-rate environment, and a reader who thinks of mega-cap tech as a balance-sheet-safe allocation needs to update that assumption.\n\n## The index concentration problem: why passive AI exposure is a bigger active bet than most investors realise\n\nHere is the counterintuitive reality: if you own a broad US index fund, you already have a large, concentrated AI bet.\n\nAccording to MSCI data, the top 10 names in the S&P 500 collectively account for close to 40% of the index by weight, and the technology sector is responsible for roughly half of all US earnings growth. That is not passive diversification. That is a concentrated wager on a single monetisation thesis.\n\n> D. E. Shaw & Co.’s February 2026 paper, \”The Concentration Game,\” calculated that for the largest 10 stocks to return to the roughly 20% combined weighting they held before 2020, the other 490 constituents would need to gain more than 160% in value while the top holdings went nowhere.\n\nThe concentration extends beyond US equities:\n\n- US index exposure: approximately 40% of the S&P 500 concentrated in 10 stocks, most with direct AI monetisation dependencies\n- Emerging market index exposure: South Korea and Taiwan together account for roughly 50% of MSCI EM capitalisation, meaning EM passive allocation can function in practice as a semiconductor supply-chain bet\n- ASX exposure: heavy bank and mining weighting means Australian investors seeking AI exposure via domestic equities are directed toward infrastructure-adjacent plays rather than pure-play technology\n\nA reader running a supposedly diversified global equity portfolio almost certainly already has a large, implicit AI monetisation bet embedded in their index allocations. Understanding that is a precondition to sizing any additional AI-themed positions rationally. Treating broad passive allocations as neutral and then adding AI tilts on top can create unintended concentration in a single thesis.\n\nA position-sizing discipline that caps individual AI names at 3-5% of total portfolio value, combined with a quarterly rebalance trigger, converts awareness of AI concentration risk into actual portfolio behaviour during the kind of short-duration sell-offs the sector has already demonstrated in 2026.\n\n## A framework for evaluating AI exposure without chasing the narrative\n\nThe analysis above maps the cycle. This section gives you a tool. Five evaluation dimensions, each drawn from the specific findings in this piece, that you can apply to any AI-linked holding.\
| Evaluation Dimension | Key Question to Ask | Warning Sign |
|---|---|---|
| Monetisation vs. spending | Is AI-driven revenue growing in line with capital expenditure, or is capex outpacing revenue? | Capital expenditure absorbing more than 90% of operating cash flow with no clear monetisation timeline |
| Value chain position | Does the company sit at a layer with tangible near-term revenues, or is its thesis long-duration? | Valuation priced for infrastructure-layer scarcity while the company actually operates at the application layer |
| Pricing-model resilience | Has the company shifted to usage or outcome-based pricing, and can it show stable revenue as customers automate? | Per-seat licensing still dominant with no disclosed transition plan |
| Valuation vs. cycle position | Does the valuation assume scarcity pricing or margin levels that industry expansion is likely to normalise? | Hardware multiples implying multi-year pricing power in a segment where capacity is actively expanding |
| Financing sustainability | Is growth funded internally or increasingly via debt, and how sensitive is that to interest rates? | Rising leverage alongside maintained shareholder returns with widening capex-to-cash-flow gap |
The framework is only useful if it can produce a \”no\” verdict. Many companies currently marketed as AI beneficiaries will not pass all five dimensions simultaneously, and that is the point. The investor’s task is not whether to engage with AI exposure, but how to structure it with discipline around current monetisation, financing quality, and genuine competitive advantage rather than narrative momentum. Infrastructure and adjacency plays, including utilities, data centre REITs and contracted-revenue infrastructure providers, offer one way to dial AI exposure toward more predictable cash flows and away from the most cyclical or richly valued parts of the stack.\n\nFor investors ready to translate the five-dimension framework above into specific allocation decisions, our dedicated guide to AI portfolio layer selection covers the S-curve position, cycle risk, and sizing logic for each of the six value-chain segments, including cybersecurity and energy as non-discretionary beneficiaries.\n\n## What this cycle gets right and where the uncertainty remains\n\nSome things are empirically established. The AI capital expenditure cycle is historically large, hyperscaler spend keeps being revised upward, and near-term profit clarity is strongest in infrastructure hardware and in select software companies with resilient pricing models. The data from Goldman Sachs, PIMCO, JPMorgan and IDC all converge on this.\n\nWhat remains unresolved is the question that actually matters for valuations. History of technology buildouts shows capital regularly overshoots what underlying economics can sustain in the early phase. The investor risk is not whether AI is real. It is whether today’s spending converts into durable, compounding free cash flow at prices that still offer a margin of safety.\n\n> Goldman Sachs models annual AI-related spending reaching approximately US$1.6 trillion by 2031, a figure that underscores both the duration of this investment cycle and the magnitude of the monetisation burden it creates.\n\nThe takeaway is a positioning principle, not a prediction. Structure AI exposure around current monetisation evidence, disciplined financing, and explicit value-chain awareness rather than aggregate spend momentum. The capital expenditure revisions are not the buy signal. The monetisation evidence, and its absence, is the filter that matters.\n\nThis article is for informational purposes only and should not be considered financial advice. Investors should conduct their own research and consult with financial professionals before making investment decisions. Past performance does not guarantee future results. Financial projections referenced in this article are subject to market conditions and various risk factors.”
Meanwhile, institutional capital facing a massive corporate refinancing wall is increasingly pivoting toward speculative artificial intelligence ventures to seek higher yields.
Xero recently demonstrated this shift by outlining a three-pronged monetisation strategy for its AI agents that targets bundled, add-on, and usage-based pricing.
In fact, US IT hardware and software spending recently reached a record 4.9 percent of GDP in early 2026, surpassing the previous dot-com era peak as hyperscalers accelerated their capital commitments.