Tesla Posts Record 480,126 Deliveries, Ending Two-Year Sales Slump
22 mins ago

A single week of data ending 1 May 2026 delivered GDP prints, final PMI readings, payrolls, and central bank signals across five major economies simultaneously. The density of that macro calendar has crystallised where the global economic outlook actually stands, and the picture is neither uniformly optimistic nor uniformly weak. Investors are pricing central bank divergence, a US soft-landing thesis, and China’s contested recovery narrative all at once. What follows cuts through the individual releases to identify the structural patterns, the divergences, and what the combined picture signals for global equity markets heading into Q2 2026.
The final April 2026 Services PMI readings, published on 5 May 2026 by S&P Global, confirm that services activity is expanding in four of the five largest economies. The US printed 51.0, the UK 52.0, Japan landed in the 52-53 range, and China’s Caixin Services PMI came in at 52.6. All four sit above the 50-expansion threshold. All four indicate that the services sector, which accounts for more than 70% of US GDP alone, continues to provide a growth floor.
Then there is the Eurozone, at 47.4.
The Eurozone Services PMI of 47.4 makes it the clearest outlier among major economies, contracting in services as well as manufacturing and serving as the primary source of global PMI pessimism heading into Q2 2026.
The common shorthand of “services up, manufacturing down” also requires correction. US manufacturing PMI held above 50 in the April final, and China’s Caixin Manufacturing PMI printed 52.2 alongside an NBS reading of 50.3. Both economies are expanding across sectors, not relying on services alone. The binary framing holds for Japan (where manufacturing remains soft) and for the Eurozone (where both sectors are contracting), but not as a global rule.
| Economy | Services PMI | Manufacturing PMI | Signal |
|---|---|---|---|
| US | 51.0 | 50+ | Expanding |
| UK | 52.0 | 49.5 | Services expanding; manufacturing contracting |
| Eurozone | 47.4 | ~47.6 | Contracting |
| Japan | ~52-53 | ~48-49 | Services expanding; manufacturing soft |
| China | 52.6 (Caixin) | 52.2 (Caixin) / 50.3 (NBS) | Broad-based expansion |
PMI readings are the earliest available signal of economic direction, arriving before GDP and employment data. Investors tracking where earnings growth is most likely to materialise in Q2 2026 should start with this table.
The US economy grew at an annualised rate of 2.0% in Q1 2026, according to the first estimate. That figure fell short of consensus forecasts, but it represents a meaningful acceleration from Q4 2025’s 0.5% annualised rate, re-establishing a recovery trajectory after a quarter that had briefly revived recession speculation.
The four data points that define the current US picture:
Preliminary March 2026 durable goods orders also came in above consensus at +0.8% month-over-month, adding a further signal of underlying demand resilience. Goldman Sachs economists forecast Q2 2026 GDP at approximately 1.8% annualised, suggesting momentum may moderate further without breaking.
Beneath the 2.0% headline, AI-driven business investment was the single most dynamic component of the Q1 2026 accounts, growing at 10.4% annualised with information processing equipment surging 43.4%, a pace that explains why technology and services sectors remain the favoured equity allocation even as consumer spending decelerated to 1.6% annualised.
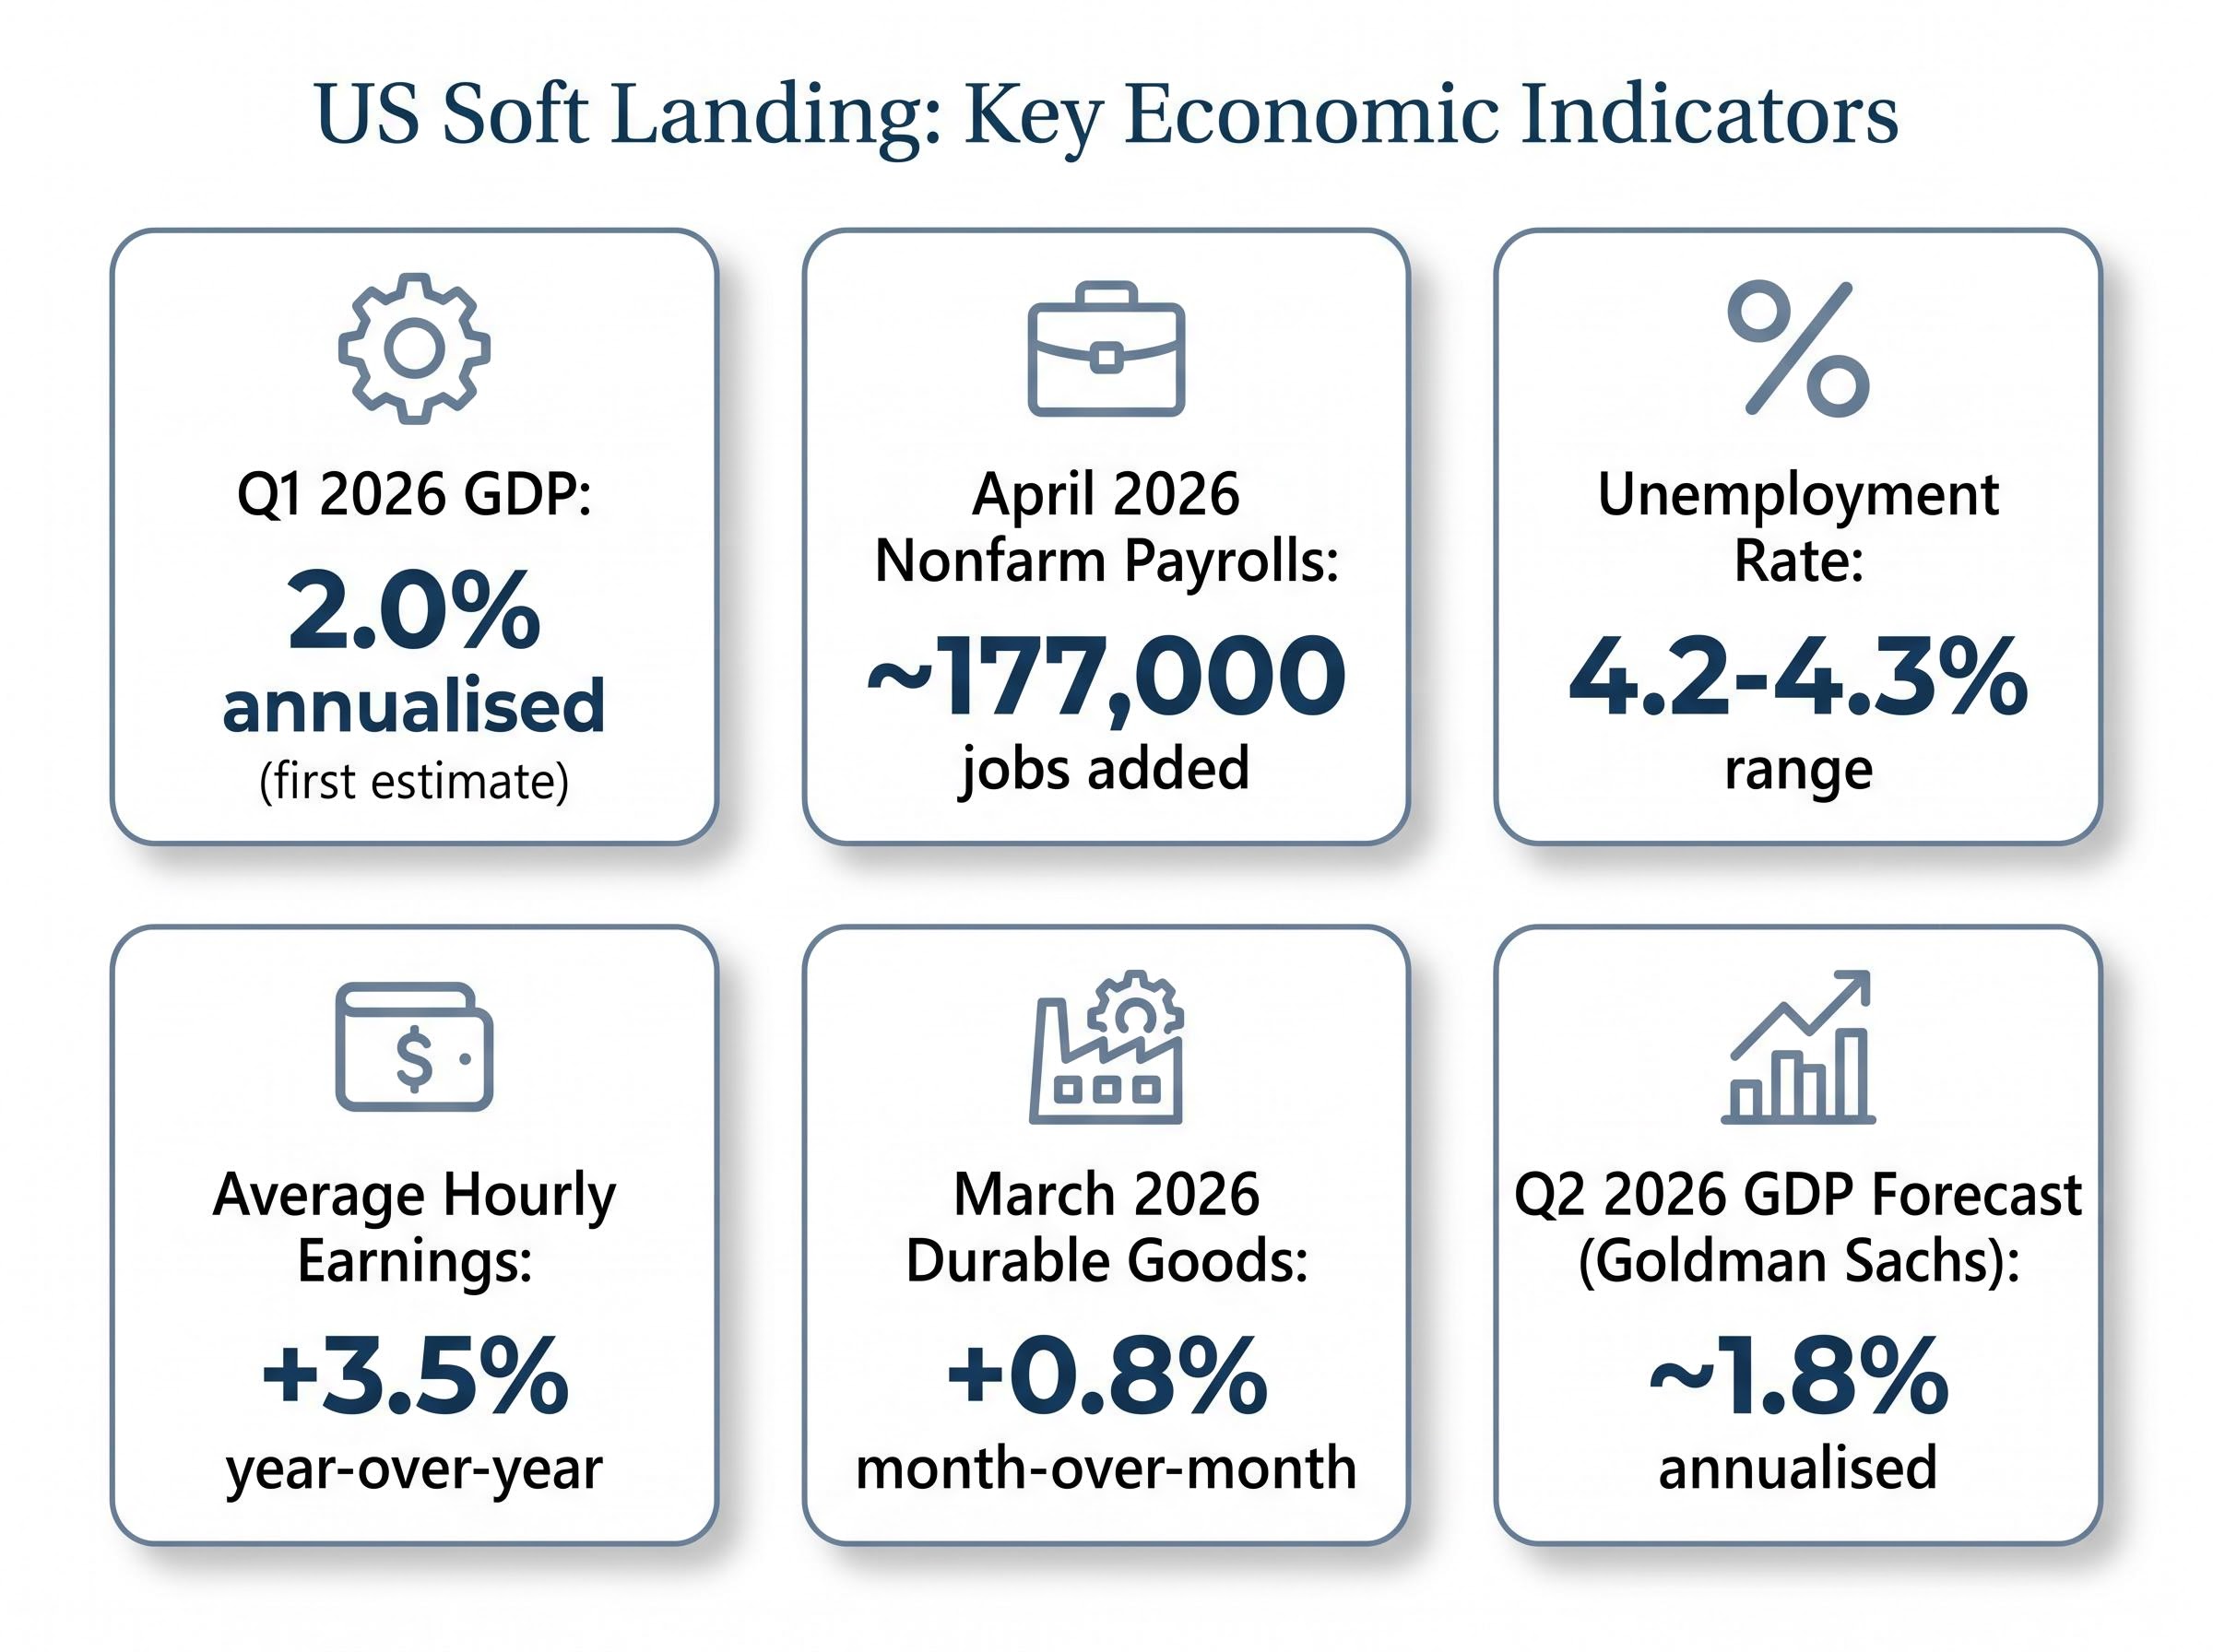
The wage growth reading is the thread that ties the macro picture together. At 3.5% year-over-year, average hourly earnings are consistent with ongoing disinflation. Wages are growing fast enough to support consumption, but not fast enough to reignite the kind of wage-price spiral the Federal Reserve spent 2022-2024 fighting. The configuration is often described as neither too hot for inflation nor too cold for growth.
The distinction matters. April’s approximately 177,000 payrolls gain, following March’s +178,000, represents a controlled cooling from the 200,000+ monthly averages of early 2025. Unemployment edging from 4.2% toward 4.3% is consistent with that cooling, not a deterioration. The FOMC minutes have flagged labour market softening as a watchpoint, lending institutional weight to the monitoring requirement. What the data does not yet confirm is a recessionary trajectory; job growth remains positive, claims are not spiking, and the unemployment rate has stabilised rather than accelerated upward.
The Purchasing Managers’ Index (PMI) is a monthly survey of business conditions across manufacturing and services sectors. It measures the breadth of change, not the magnitude, making it a directional signal rather than a growth rate.
The S&P Global PMI methodology defines the 50-threshold as the precise dividing line between expansion and contraction, with the index constructed from weighted survey responses across new orders, output, employment, supplier delivery times, and inventories, meaning the headline number reflects breadth of change rather than its magnitude.
A PMI reading above 50 indicates that more businesses reported expansion than contraction. A reading below 50 indicates the reverse. The further from 50, the stronger the signal in either direction.
Three things a PMI reading tells an investor:
The China NBS-versus-Caixin divergence is the clearest current illustration of how survey methodology shapes the reading. The NBS Manufacturing PMI printed 50.3 in April; the Caixin Manufacturing PMI printed 52.2. Goldman Sachs attributes this gap to sampling bias: the NBS captures a broader universe including larger state-owned enterprises, while Caixin’s sample skews toward private-sector firms more responsive to recent fiscal stimulus measures. Both readings point to expansion, but investors reading only one survey would draw a different conclusion about the recovery’s strength.
PMI data is released within days of month-end, making it the fastest available read on economic conditions, often weeks before GDP and employment figures arrive. That speed is its primary value; its limitation is that a single survey number, read in isolation, can mislead.
The PMI and GDP data already presented explain why the world’s four largest central banks are moving in four different directions. The European Central Bank (ECB), facing a 47.4 Services PMI and persistent weakness, has the clearest case for easing. OIS markets imply approximately 90% probability of a 25bp rate cut at the 11 June meeting, making it the highest-conviction central bank call in the current cycle.
The Federal Reserve occupies the opposite end of the spectrum. With US GDP at 2.0%, payrolls still positive, and wages at 3.5%, the data-dependent hold remains intact. CME FedWatch pricing implies only 7-12% probability of a cut at the July meeting. The Fed is not tightening, but it is not ready to ease.
The Bank of England (BoE) sits between the two. Governor Bailey welcomed the UK Services PMI improvement to 52.0 but maintained a restrictive Bank Rate of 3.75%. OIS markets price approximately 40bp of BoE cuts in H2 2026, a cautious easing path.
The Bank of Japan (BoJ) is standing pat at 0.75%. Governor Ueda signalled no imminent hikes despite services resilience, with yen weakness acting as the binding constraint. Markets project steady BoJ rates into 2027.
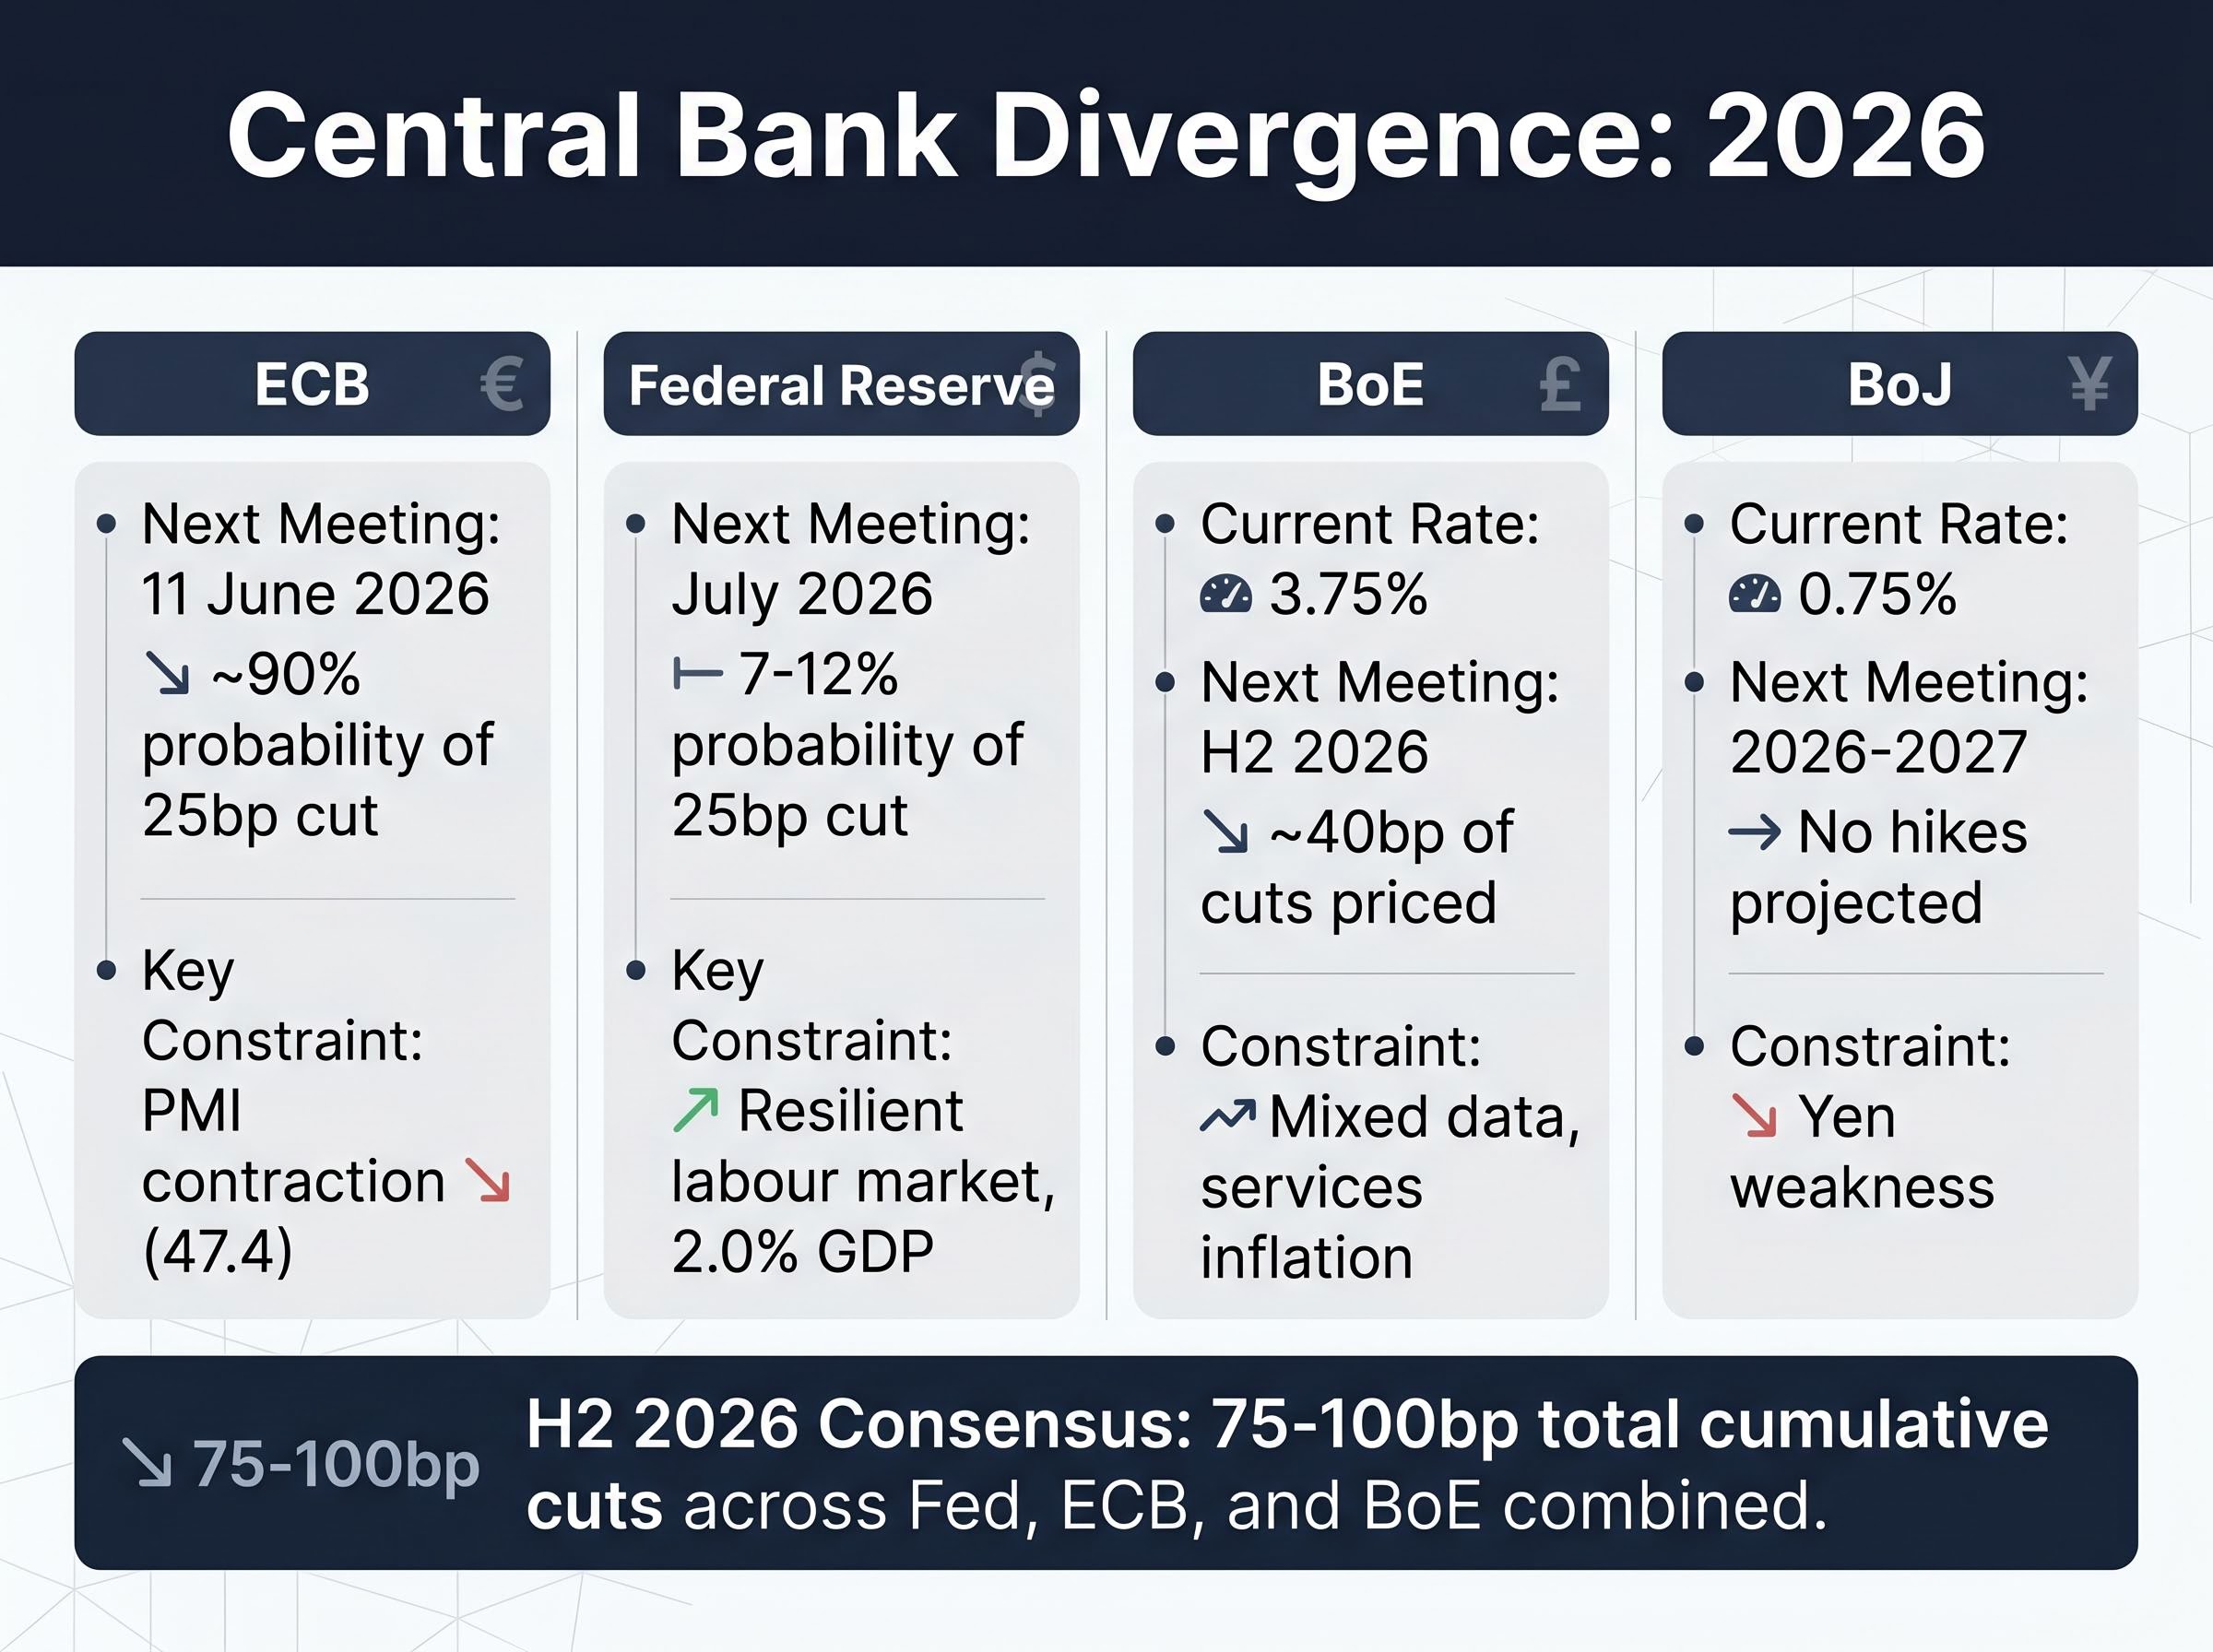
| Central Bank | Current Rate | Next Meeting | Market-Implied Move | Key Constraint |
|---|---|---|---|---|
| ECB | TBD (easing cycle) | 11 June 2026 | ~90% probability of 25bp cut | PMI contraction (47.4) |
| Federal Reserve | Restrictive hold | July 2026 | 7-12% probability of 25bp cut | Resilient labour market, 2.0% GDP |
| BoE | 3.75% | H2 2026 | ~40bp of cuts priced | Mixed data, services inflation |
| BoJ | 0.75% | 2026-2027 | No hikes projected | Yen weakness |
The H2 2026 consensus projects 75-100bp of total cumulative cuts across the Fed, ECB, and BoE combined.
For investors wanting to translate the central bank divergence picture into specific portfolio positioning, our full explainer on valuation dislocations from the Fed hold identifies where the rate-hold has created historically rare discounts across technology, growth, and small-cap equities, and examines JPMorgan’s 35% stagflation probability scenario alongside the credit market stress signals that could accelerate any repricing.
The Fed-ECB rate differential has driven approximately 2% USD appreciation against major currencies in early 2026, tightening financial conditions for USD-denominated emerging market borrowers. Yen weakness from the BoJ hold provides a specific tailwind for Japanese exporters and supports Nikkei outperformance; JPMorgan has upgraded its Nikkei year-end target to 70,000, citing the AI boom and weak yen.
Both NBS and Caixin manufacturing PMIs sit in expansion territory. Caixin Services printed 52.6. The recovery is not confined to one survey or one sector; it is broad-based across the measurement frameworks that matter.
The IMF’s April 2026 World Economic Outlook forecasts China’s 2026 GDP growth at 4.4%, below earlier estimates. The property sector correction and US-China trade tensions, with bilateral talks stalled following tariff escalations, account for the downgrade. March 2026 exports rose +2.5% year-over-year, showing positive momentum, but the trade backdrop remains a headwind.
The broader emerging market picture extends beyond China:
India’s 6.8% GDP growth forecast stands in contrast to the Eurozone’s sub-1% annual growth, underscoring why emerging markets now account for the majority of global GDP expansion.
Oil at approximately $108/barrel is a dual-edged factor: a commodity-export tailwind for Brazil and resource-heavy emerging economies, but an inflation complication for oil-importing nations and central banks already managing easing paths. Investors who conflate China’s complexity with outright weakness risk misallocating capital away from markets showing genuine expansion.
Fisher Investments’ view that US momentum sustains the broader global bull market finds support in the data, so long as the labour market does not deteriorate further. The soft-landing configuration, moderate GDP growth with cooling but positive employment, keeps the earnings growth cycle intact.
The PMI and policy data imply a specific regional and sector rotation:
The VIX at approximately 17-19 indicates moderate, not complacent, volatility. Markets are pricing genuine uncertainty without signalling acute risk. Analyst preferences from Goldman Sachs and JPMorgan favour US and Asian markets over Europe, consistent with the PMI divergence.
Consumer sentiment divergence from market performance has reached historically extreme levels in this cycle: the University of Michigan’s April 2026 final reading hit a record low of 49.8 while the S&P 500 closed above 7,200, a gap that historical precedent, including the 2022 trough, suggests has tended to coincide with market bottoms rather than the start of sustained declines.
Two releases have the capacity to materially shift the Q2 outlook. A deterioration in US unemployment claims or payrolls, moving the unemployment rate decisively above 4.3%, would challenge the soft-landing thesis at its foundation. A significant upside move in US CPI, reignited by $108/barrel oil feeding through to consumer prices, would compress the Fed’s window for any 2026 cuts and tighten financial conditions further. These are the data points worth monitoring week by week.
The interaction between oil shock and central bank policy has been more disruptive than most Q1 forecasts anticipated: Brent above $110 per barrel has already stripped approximately 50 basis points of priced Fed cuts from market expectations, forced the ECB to reassess whether its easing path remains viable, and widened emerging market sovereign spreads by roughly 150 basis points since February 2026.
The full dataset resolves into a three-tier structure that offers a durable framework for interpreting each subsequent macro release:
Central bank divergence is a consequence of this three-tier structure, not a cause. The ECB cuts because the Eurozone is contracting. The Fed holds because the US is not.
The weight of the data favours continued global expansion, but the Eurozone drag, $108/barrel oil as an upside inflation risk, and the US labour market monitoring requirement mean the outlook carries material caveats. The next signposts are the upcoming US CPI print, Eurozone GDP revisions, and China’s April loan growth and money supply data.
This article is for informational purposes only and should not be considered financial advice. Investors should conduct their own research and consult with financial professionals before making investment decisions. Past performance does not guarantee future results. Financial projections are subject to market conditions and various risk factors.
The global economic outlook for Q2 2026 is characterised by three distinct tiers: the US in soft-landing mode with 2.0% annualised GDP growth, Asia expanding broadly led by India at 6.8% and China with PMIs above 50, and the Eurozone contracting with a Services PMI of 47.4 and near-zero quarterly GDP growth.
PMI (Purchasing Managers Index) data signals the direction and breadth of economic activity across manufacturing and services sectors, with any reading above 50 indicating expansion and below 50 indicating contraction. It is released within days of month-end, making it one of the fastest available leading indicators, often arriving weeks before GDP and employment figures.
Central bank divergence in 2026 reflects the underlying economic divergence between major economies: the ECB is cutting rates because the Eurozone is contracting, the Fed is holding because US GDP and labour markets remain resilient, the Bank of England is cautiously easing, and the Bank of Japan is on hold due to yen weakness constraining its options.
April 2026 nonfarm payrolls of approximately 177,000 and average hourly earnings growth of around 3.5% year-over-year support the Fed's data-dependent hold, as the labour market is cooling gradually rather than deteriorating sharply, while wage growth remains consistent with ongoing disinflation rather than reigniting inflation pressures.
Based on PMI readings, GDP forecasts, and central bank positioning, analysts at Goldman Sachs and JPMorgan favour US equities (supported by a 51.0 Services PMI and resilient earnings), Japanese equities (backed by yen weakness and a Nikkei target of 70,000), and selective emerging market exposure through India and China, while European equities remain a structural underweight given broad PMI contraction.