
Most options traders reach for the same move by instinct: sell premium, collect the credit, let time decay do the work. In most environments that instinct has merit. In a low-volatility product, it quietly works against you.
Consider TLT, the iShares 20+ Year Treasury Bond ETF. When its implied volatility sits around 14%, options are priced for so little movement that selling an at-the-money contract might generate just $1.46 in credit while tying up roughly $1,500 in capital. You are accepting the full risk of the position for a payoff that barely registers.
This is not a rare edge case. TLT and GLD, the SPDR Gold Shares ETF, spend long stretches in low-to-mid volatility regimes. Traders who carry their equity premium-selling playbook into these products are not mistiming the market. They are using the wrong tool for the environment, which is a regime-matching problem, not a forecasting one.
What follows gives you the decision logic, the mechanics, and the specific structures to deploy when volatility is working against the premium seller. This is options trading built for low IV ETFs, where cheap premium changes everything about which side of the trade you want to be on.
What the IV data on TLT and GLD is actually telling you
Start with the raw numbers, because they set the stage for everything else. As of September 2026, TLT’s 30-day at-the-money implied volatility clusters tightly in the low teens. Vendor snapshots from 11-18 September 2026 put it between 10.5% and 11.5%: OptiView cites 10.8% and 11.5%, OptionCharts reports 11.23%, and MarketChameleon shows 10.5%.
GLD sits higher in absolute terms but still modest. September 2026 data shows its 30-day ATM IV ranging from 12.8% to 24.5% across platforms.
Implied volatility, or IV, is the market’s estimate of how much a security will move, expressed as an annualised percentage. A low IV means options are priced for calm.
The entire framework here rests on a precise reading of implied volatility basics: IV is not a directional forecast but a real-time measure of how much movement the market is collectively pricing in, extracted from live option prices rather than historical data.
| ETF | 30-day ATM IV range | IV rank range | IV percentile range | 52-week IV high/low |
|---|---|---|---|---|
| TLT | 10.5% – 11.5% | 33.5 – 68 | 59.1% – 78% | Compressed, low absolute band |
| GLD | 12.8% – 24.5% | Low teens – mid-30s | Low-60s | 43.1% high / 14.8% low |
The raw number is only half the picture. The other half is context.
Why IV rank alone can mislead you in fixed-income and commodity ETFs
IV rank and IV percentile tell you where today’s volatility sits within its own 52-week range. A reading near the annual floor signals something very different from one sitting mid-band.
Here is where TLT trips people up. Its IV rank ranges from 33.5 to 68, with IV percentiles between 59.1% and 78%. That looks moderate, even slightly elevated.
But the entire 52-week range is compressed. A 60th-percentile IV rank in TLT still corresponds to premium that is low in dollar terms, because the ceiling itself is low. VolRadar’s mid-2026 analysis classified TLT’s low-IV periods as the “cheap quartile” for exactly this reason.
Contrast that with a volatile tech stock, where a 60th-percentile IV rank might mean 45% annualised IV and genuinely fat premiums. Same rank, completely different dollar reality.
The takeaway for you is simple: orient your strategy selection around the absolute IV level, not the rank alone. Cheapness in dollar terms is what determines how much a seller collects and how much a buyer pays, and in these products, options are cheap even when the rank says otherwise.
When big ASX news breaks, our subscribers know first
The math that makes premium selling fail in low-IV products
Let the arithmetic build the case. Selling an ATM TLT option with roughly 70 days to expiration generated about $1.46 in credit. That required around $1,500 in buying power and capped your maximum profit at $150.
Run that again and the pattern holds. A second TLT example collected a mere $0.60 credit against $1,200 in buying power. This is not an outlier; it is structural to the product.
- TLT example one: $1.46 credit, ~$1,500 buying power, $150 maximum profit
- TLT example two: $0.60 credit, $1,200 buying power
- The pattern: tiny credits against large capital commitments, with full downside risk on the underlying
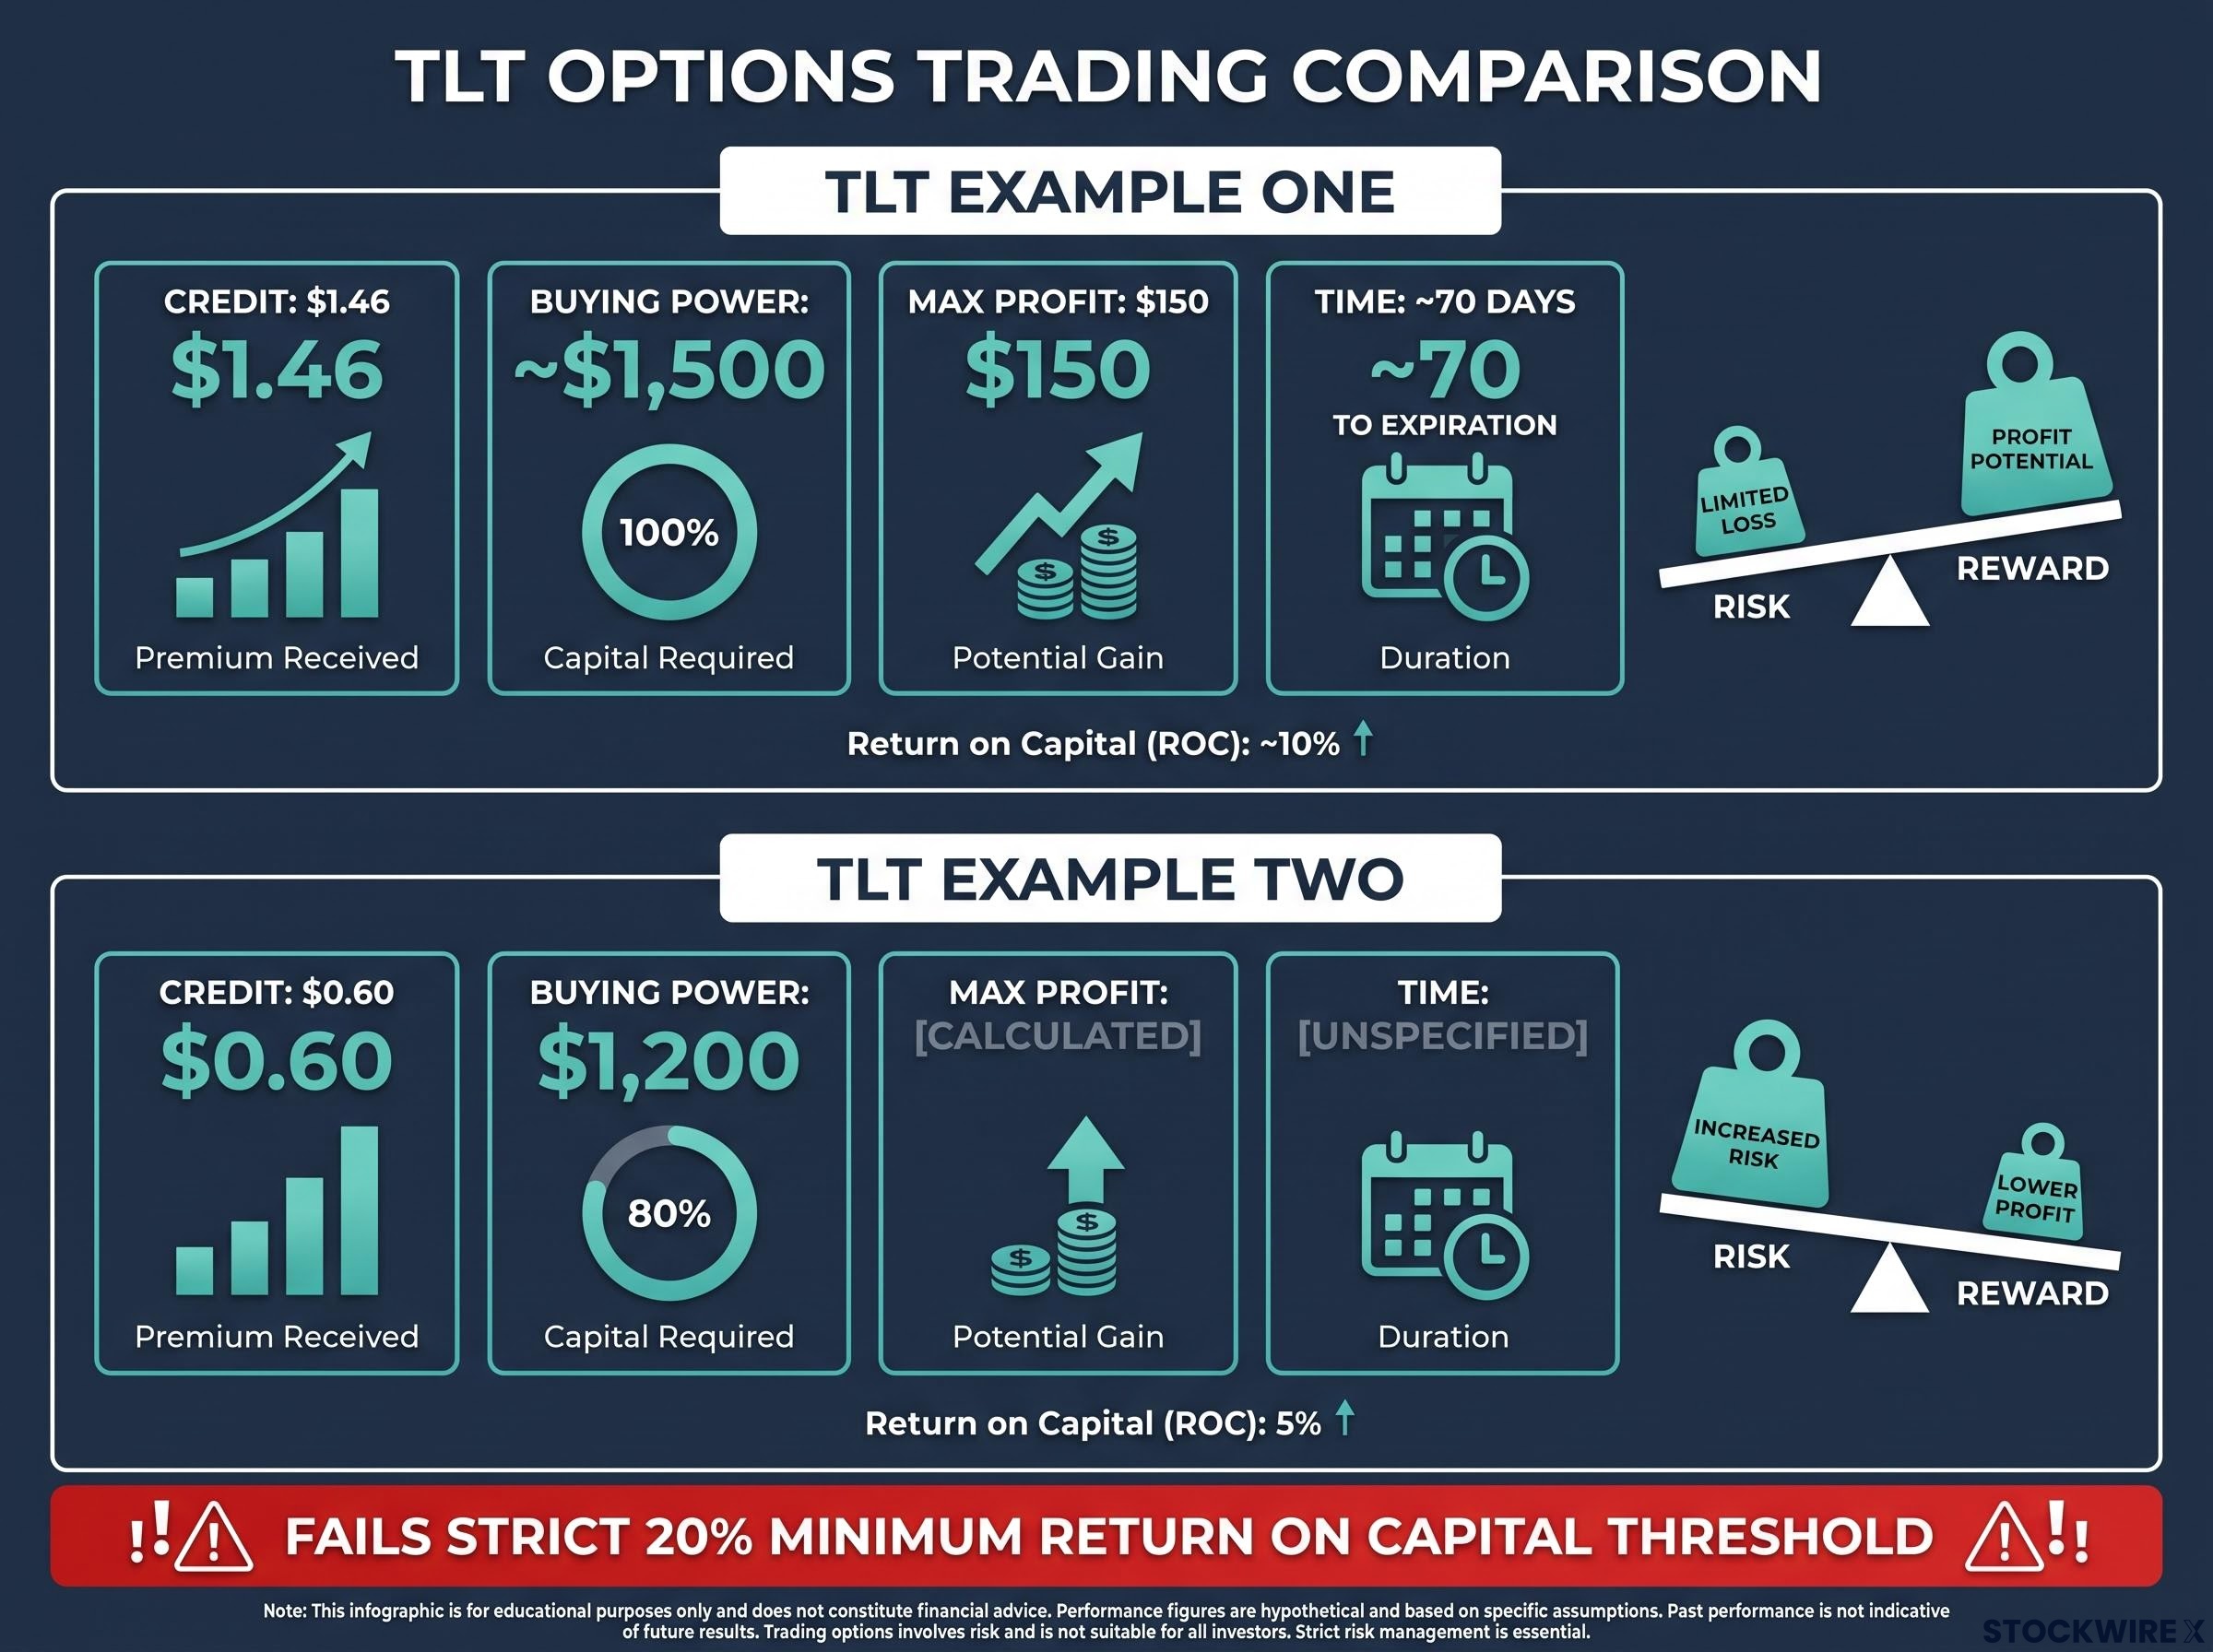
There is a debate about how to measure whether a credit is good enough. The original source analysis applied a strict 20% minimum return on capital, credit divided by capital at risk, and TLT fails it easily. That specific threshold is not a universal rule, but the principle behind it is echoed across platforms in different language.
Saxo (October 2025) suggests a baseline premium yield of 1-2% per 30 days on collateral for cash-secured puts, and advises collecting at least one-third of the spread width on defined-risk credit spreads. VolatilityBox (February 2026) targets 3-6% return on capital when closing at 50% of maximum profit, and flags a VIX below 14-15 as the signal to avoid selling premium on broad indices.
Whichever benchmark you prefer, TLT struggles to clear it.
Here is what the $1,500-for-$150 trade really asks of you. You accept full downside risk on the underlying for a theoretical 10% return that only materialises if the outcome is perfect. That asymmetry, large capital exposed for thin compensation, is the core reason premium selling breaks down when volatility is this low.
Seeing it in dollars rather than percentages tends to change minds. Many traders have been quietly accepting this trade-off without recognising just how lopsided it is.
Why debit structures are structurally matched to cheap-premium environments
If selling cheap premium is the problem, buying it is the answer, and not as a consolation. When IV sits below roughly 30% annualised, options are historically cheap. Buying something below fair value is sound logic whether you are buying options or anything else.
Authoritative platforms including Schwab, tastylive, and Option Alpha converge on the same guideline: an IV rank below 20-30 places options in the historically cheap quartile, where debit-side strategies carry better economics for the buyer.
A debit spread is a two-leg trade where you buy one option and sell another to reduce your cost, paying a net debit up front. Your maximum loss is strictly that debit, and nothing more.
Here is the logic chain:
- IV is cheap, so options cost less than they typically do.
- Buying cheap options carries positive expected value when IV reverts toward its historical mean.
- Selling a further-out option caps your cost and engineers the reward-to-risk ratio.
- Positive vega adds a tailwind, because the position gains value as volatility expands back toward normal.
That fourth point deserves emphasis. Vega measures how much an option’s price changes when IV moves. Debit vertical spreads typically carry positive vega, so when volatility mean-reverts upward, the trade benefits.
Engineering reward-to-risk with the short leg placement
The placement of your short option is where the real design happens. Move it further out of the money and you shift the spread from a near-even bet toward a two-to-one, three-to-one, or even four-to-one structure.
The original source cited a bullish call debit spread in IBIT, the iShares Bitcoin ETF, using the 44/46 strikes. Maximum risk was $83; maximum profit was $120. That is a favourable ratio built entirely by where the short call sat.
Apply the same reasoning to TLT or GLD strikes and the benefit becomes clear. This engineered asymmetry means you do not need to be right about direction as often as a coin-flip trade would require.
In a slow-moving product like TLT, that is the structural advantage that replaces the premium income you gave up. You trade thin, unfavourable credits for a defined-risk position with the volatility wind at your back.
The ZEBRA strategy: near-zero extrinsic value in a defined-risk structure
Take the debit spread logic to its endpoint and you arrive at the ZEBRA, short for Zero Extrinsic Back Ratio. It is frequently cited as a preferred directional trade for low-IV products like TLT.
The construction is precise: you buy two in-the-money options and sell one at-the-money option. The ratio is set so the net extrinsic value, the time-and-volatility portion of an option’s price, sits near zero.
Strip out extrinsic value and what remains is almost pure directional exposure. A ZEBRA delivers roughly 100 deltas of stock-equivalent exposure, meaning the position behaves like owning 100 shares of the underlying, but with a hard maximum loss equal to the debit you paid.
The ZEBRA’s core appeal is its delta exposure: by targeting roughly 100 short deltas, the position behaves like short stock but with a hard loss limit, and because delta polarises toward the extremes as expiration nears, a correctly-timed ZEBRA can accelerate in sensitivity exactly when a directional move materialises.
Building a bearish TLT ZEBRA looks like this:
- Identify the at-the-money strike.
- Select two in-the-money puts with sufficient delta.
- Sell one at-the-money put.
- Calculate the net debit and confirm extrinsic value is near zero.
- Verify total delta exposure is close to 100 short deltas.
A bearish TLT ZEBRA built this way was shown to cost under $500 in total debit while providing close to 100 short deltas of exposure. That is meaningful directional firepower for a small, defined outlay.
Why bother with directional exposure in a product this calm? Because low IV cuts both ways.
When TLT dropped roughly 1.25% in a single session, an 80-strike put moved from about $1.00 to $1.50, a gain of around 50% in one day. That happened even though the implied price range for TLT over the following 71-day period was only about $3.00.
With so little extrinsic value in the way, price moves flow almost directly into option value.
| Strategy | Capital required | Max loss | Max gain | Delta exposure |
|---|---|---|---|---|
| ZEBRA (bearish TLT) | Under $500 debit | Debit paid | Uncapped directional | ~100 short deltas |
| Long put (single) | Premium paid | Premium paid | Uncapped directional | Partial, decays with theta |
| Short put (naked) | High buying power | Substantial | Capped at thin credit | Long delta, unwanted here |
For a trader with a directional view on TLT who will not stomach the uncapped downside of shorting shares or the thin compensation of a naked short option, the ZEBRA is the practical answer. You get stock-like exposure with a hard loss limit under $500, which also makes position sizing straightforward.
What can go wrong, and when premium selling still has a place
No structure is free of risk, and debit and ZEBRA trades carry their own distinct failure modes. Naming them precisely is what lets you manage them.
- Directional and timing risk: These are net-long directional trades, so if TLT or GLD fails to move enough in your direction, the debit you paid is at risk of being lost entirely.
- Time decay on slow movers: Slow-moving products can drift for weeks, and theta will erode the position while you wait for the move.
- Liquidity and slippage: ZEBRAs rely on deep in-the-money long legs, which often carry wider bid-ask spreads and raise your real entry and exit costs.
- Pin risk and early assignment: Short strikes near the money create pin risk at expiration, and early assignment risk is elevated because TLT is dividend-bearing.
- Volatility-regime shifts: An unexpected drop in IV can compress extrinsic value across multi-leg structures, trimming your mark-to-market gains even when the underlying moves your way.
Each of these is manageable once you know it exists before entering the trade. None of them is a reason to abandon the framework; they are simply the checklist you run against before committing capital.
Volatility regime shifts represent the most acute risk for debit positions built in persistently calm environments: an unexpected compression of IV can trim mark-to-market gains even when the underlying moves in your favour, because the option’s extrinsic value deflates faster than intrinsic value accrues.
The conditions under which selling premium in low-IV ETFs can still work
The debit-default rule is not dogma, and there are specific, checkable conditions where selling premium remains viable:
- Both metrics above 50: VolatilityBox (February 2026) advises avoiding premium selling on broad indices when the VIX is below 14-15, but idiosyncratic selling can still work on individual stocks or ETFs where IV rank and IV percentile are both strictly above 50.
- The neutral zone with reduced sizing: When IV rank sits between 30 and 50, selling premium can work provided you cut your position size.
- Ultra-high-probability setups: ApexVol (June 2026) notes that traders insisting on selling in low IV should rely on setups with 85%+ probability, paired with aggressive management and tight profit targets. This is practitioner guidance, not peer-reviewed research, so weight it accordingly.
One practical caution on that last point. In low IV, premiums are so thin that a 30-delta short strike can sit only 5-7% from the current price, which compresses your cushion and leaves little room for error.
The boundary is clean. If IV rank is below 50 and IV percentile is below 50, the debit framework applies and these exceptions do not.
Applying the decision framework before your next options trade
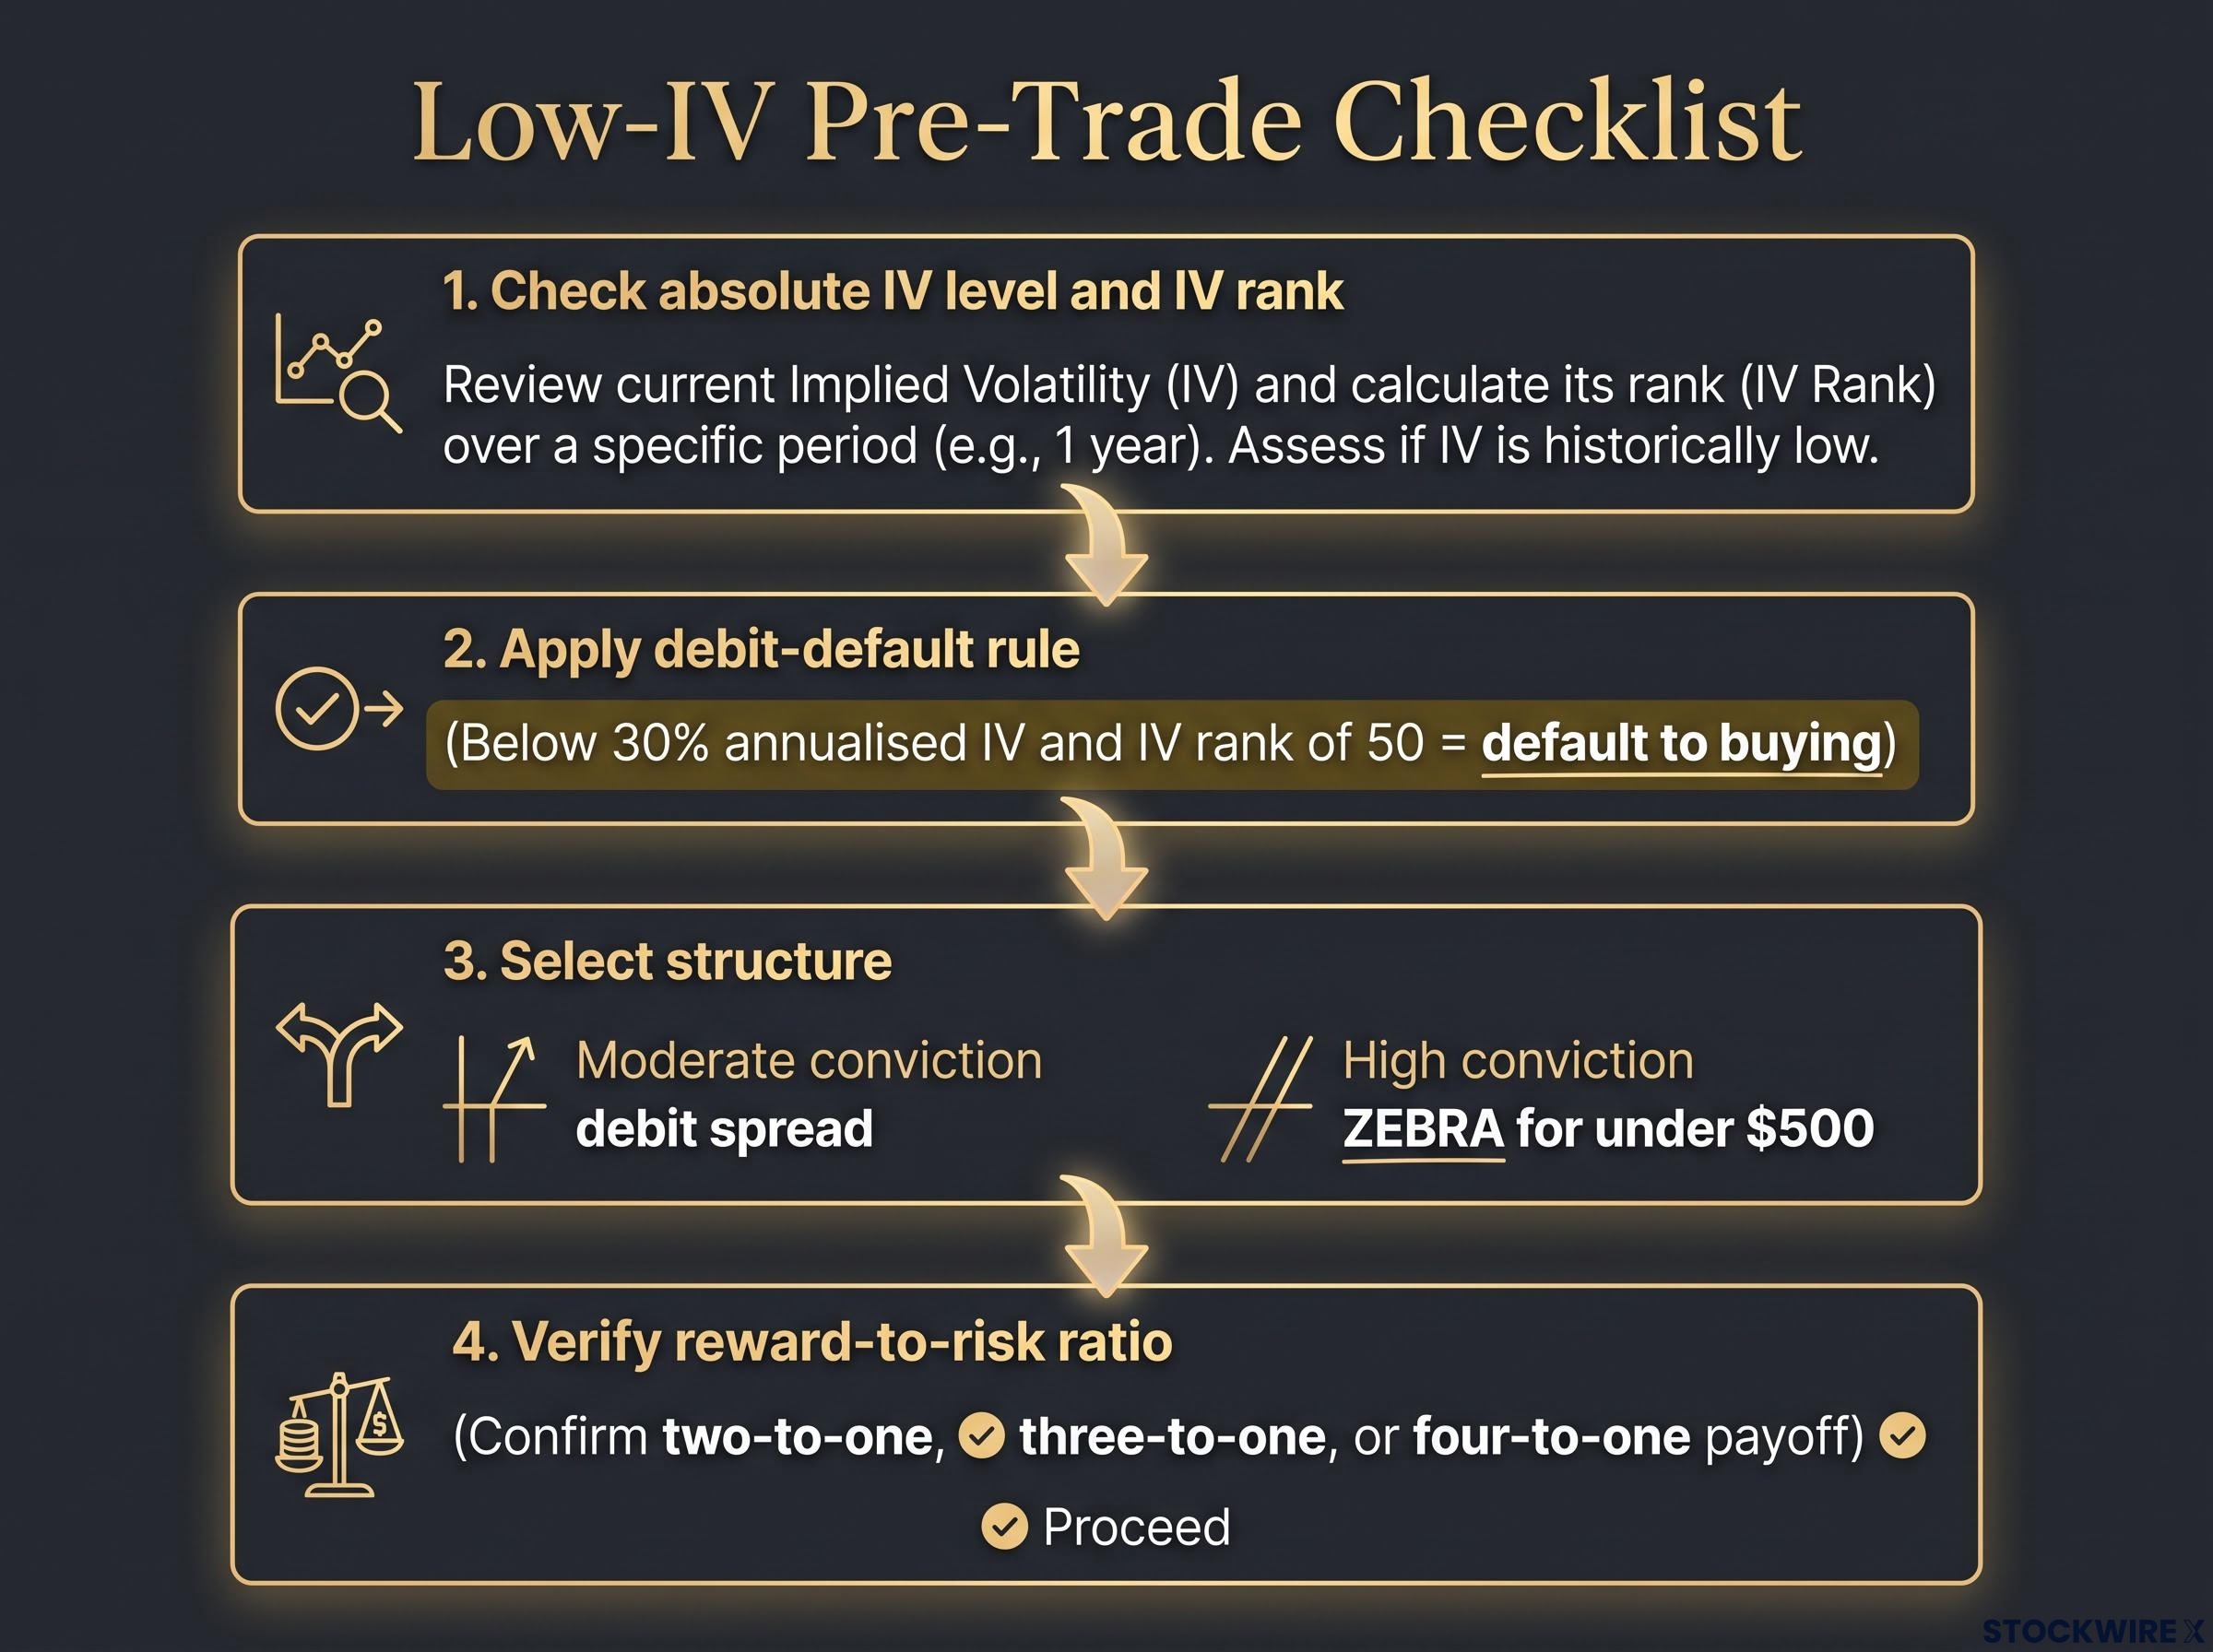
Everything above collapses into a short sequence you can run before entering any options position in a low-volatility product. Treat it as a pre-trade checklist.
- Check the absolute IV level and IV rank. Read both, because a mid-range rank in a compressed product still means cheap options in dollar terms.
- Apply the debit-default rule. Below roughly 30% annualised IV and below an IV rank of 50, default to buying premium, not selling it.
- Select the structure by conviction. Moderate directional conviction points to a debit spread; high conviction points to a ZEBRA, which can be built for under $500 in TLT-scale products.
- Verify the reward-to-risk ratio. Confirm the trade offers at least a two-to-one, three-to-one, or four-to-one payoff, engineered through short-leg placement, before you commit.
TLT and GLD are named examples of a category, not the only members of it. Any ETF with persistently low absolute IV, corroborated by VolRadar’s “cheap quartile” framing, faces the same mechanics.
Seasonal volatility patterns matter here because low-IV conditions in TLT and GLD rarely persist indefinitely: three decades of VIX data show the late-August to early-October window has historically marked the start of the year’s most sustained implied volatility expansion, which is precisely when debit positions with positive vega stand to benefit.
The value here is not the current reading on TLT or GLD. It is the process. Volatility regimes shift, but a repeatable four-step check applies to any product where absolute IV is persistently low, which keeps the framework useful long after today’s numbers have changed.
Run this check every time and you sidestep the single most common structural error in options trading: applying a high-IV, premium-selling playbook to a product that cannot support it.
This article is for informational purposes only and should not be considered financial advice. Investors should conduct their own research and consult with financial professionals before making investment decisions. Options trading carries substantial risk and is not suitable for all investors. Past performance does not guarantee future results, and the strategies described are subject to market conditions and various risk factors.