
Most options explainers tell you delta measures “price sensitivity” and move on. That definition is technically correct and almost entirely useless on its own. What actually matters is understanding how delta shifts as time runs out and how that shift changes the risk profile of a trade you are already in.
Delta is not a fixed property of an option. It is a live number that changes with the stock price, with how far a strike sits from the current price, and with how much time remains before expiration. If you treat it as a static label, you miss the most important thing it can tell you.
This guide builds from first principles through to a worked vertical spread example showing how delta evolves across a 42-day window. By the end, you will have a clear framework for using delta to choose between spread structures and calibrate your directional exposure with the same intuition you already apply to sizing a share position.
What delta actually measures (and its two jobs at once)
For every $1 move in the underlying stock, delta tells you how much an option’s price is expected to shift in response, assuming all other variables stay constant. If a call carries a delta of 0.30, you can expect the option to gain roughly $0.30 when the stock climbs $1.
But that same number is doing a second job simultaneously. Delta also expresses your stock-equivalent directional exposure: owning an option is not equivalent to owning no shares, and delta quantifies that exposure by expressing how many shares the position effectively behaves like. A call with a delta of 0.30 is not the same as holding nothing; it carries a risk profile broadly comparable to a position of 30 shares in the underlying.
These are not two separate concepts. They are two ways of describing the same relationship. The stock-equivalent framing is the more actionable of the two, because it lets you size an options position with the same intuition you already use when buying or selling shares.
| Option Type | Delta Range | Example |
|---|---|---|
| Calls | 0 to +1.00 | Delta +0.30 ≈ exposure to 30 shares |
| Puts | -1.00 to 0 | Delta -0.49 ≈ exposure to short 49 shares |
Two worked examples to anchor this:
- A call with delta +0.30 gains approximately $0.30 if the stock rises $1 and carries risk roughly equivalent to holding 30 shares.
- A put with delta -0.49 gains approximately $0.49 if the stock drops $1 and behaves roughly like being short 49 shares.
The stock-equivalent reading is what makes delta a practical risk-management tool rather than an abstract Greek. It tells you, in shares terms, how much market exposure you are actually carrying inside your options position.
When big ASX news breaks, our subscribers know first
How moneyness shapes delta across the options chain
Open a Microsoft options chain with approximately 42 days to expiration and the stock trading near $485, and the pattern in the delta column tells you something before you read a single explainer.
Start at the $440 strike calls. Delta sits at approximately +0.80. These are deep in-the-money (ITM), meaning the stock price is well above the strike. The option already holds substantial intrinsic value and behaves almost like the stock itself.
Move up to the $485 strike. Calls show delta approximately +0.51; puts show approximately -0.49. This is at-the-money (ATM), where the strike roughly equals the current stock price. The market is saying, in effect, that it is close to a coin flip whether this option finishes in-the-money.
Keep moving to the $515 strike calls. Delta drops to approximately +0.26. These are out-of-the-money (OTM), meaning the stock needs to climb $30 before these calls carry any intrinsic value. The lower delta reflects both lower sensitivity and a lower probability of paying off.
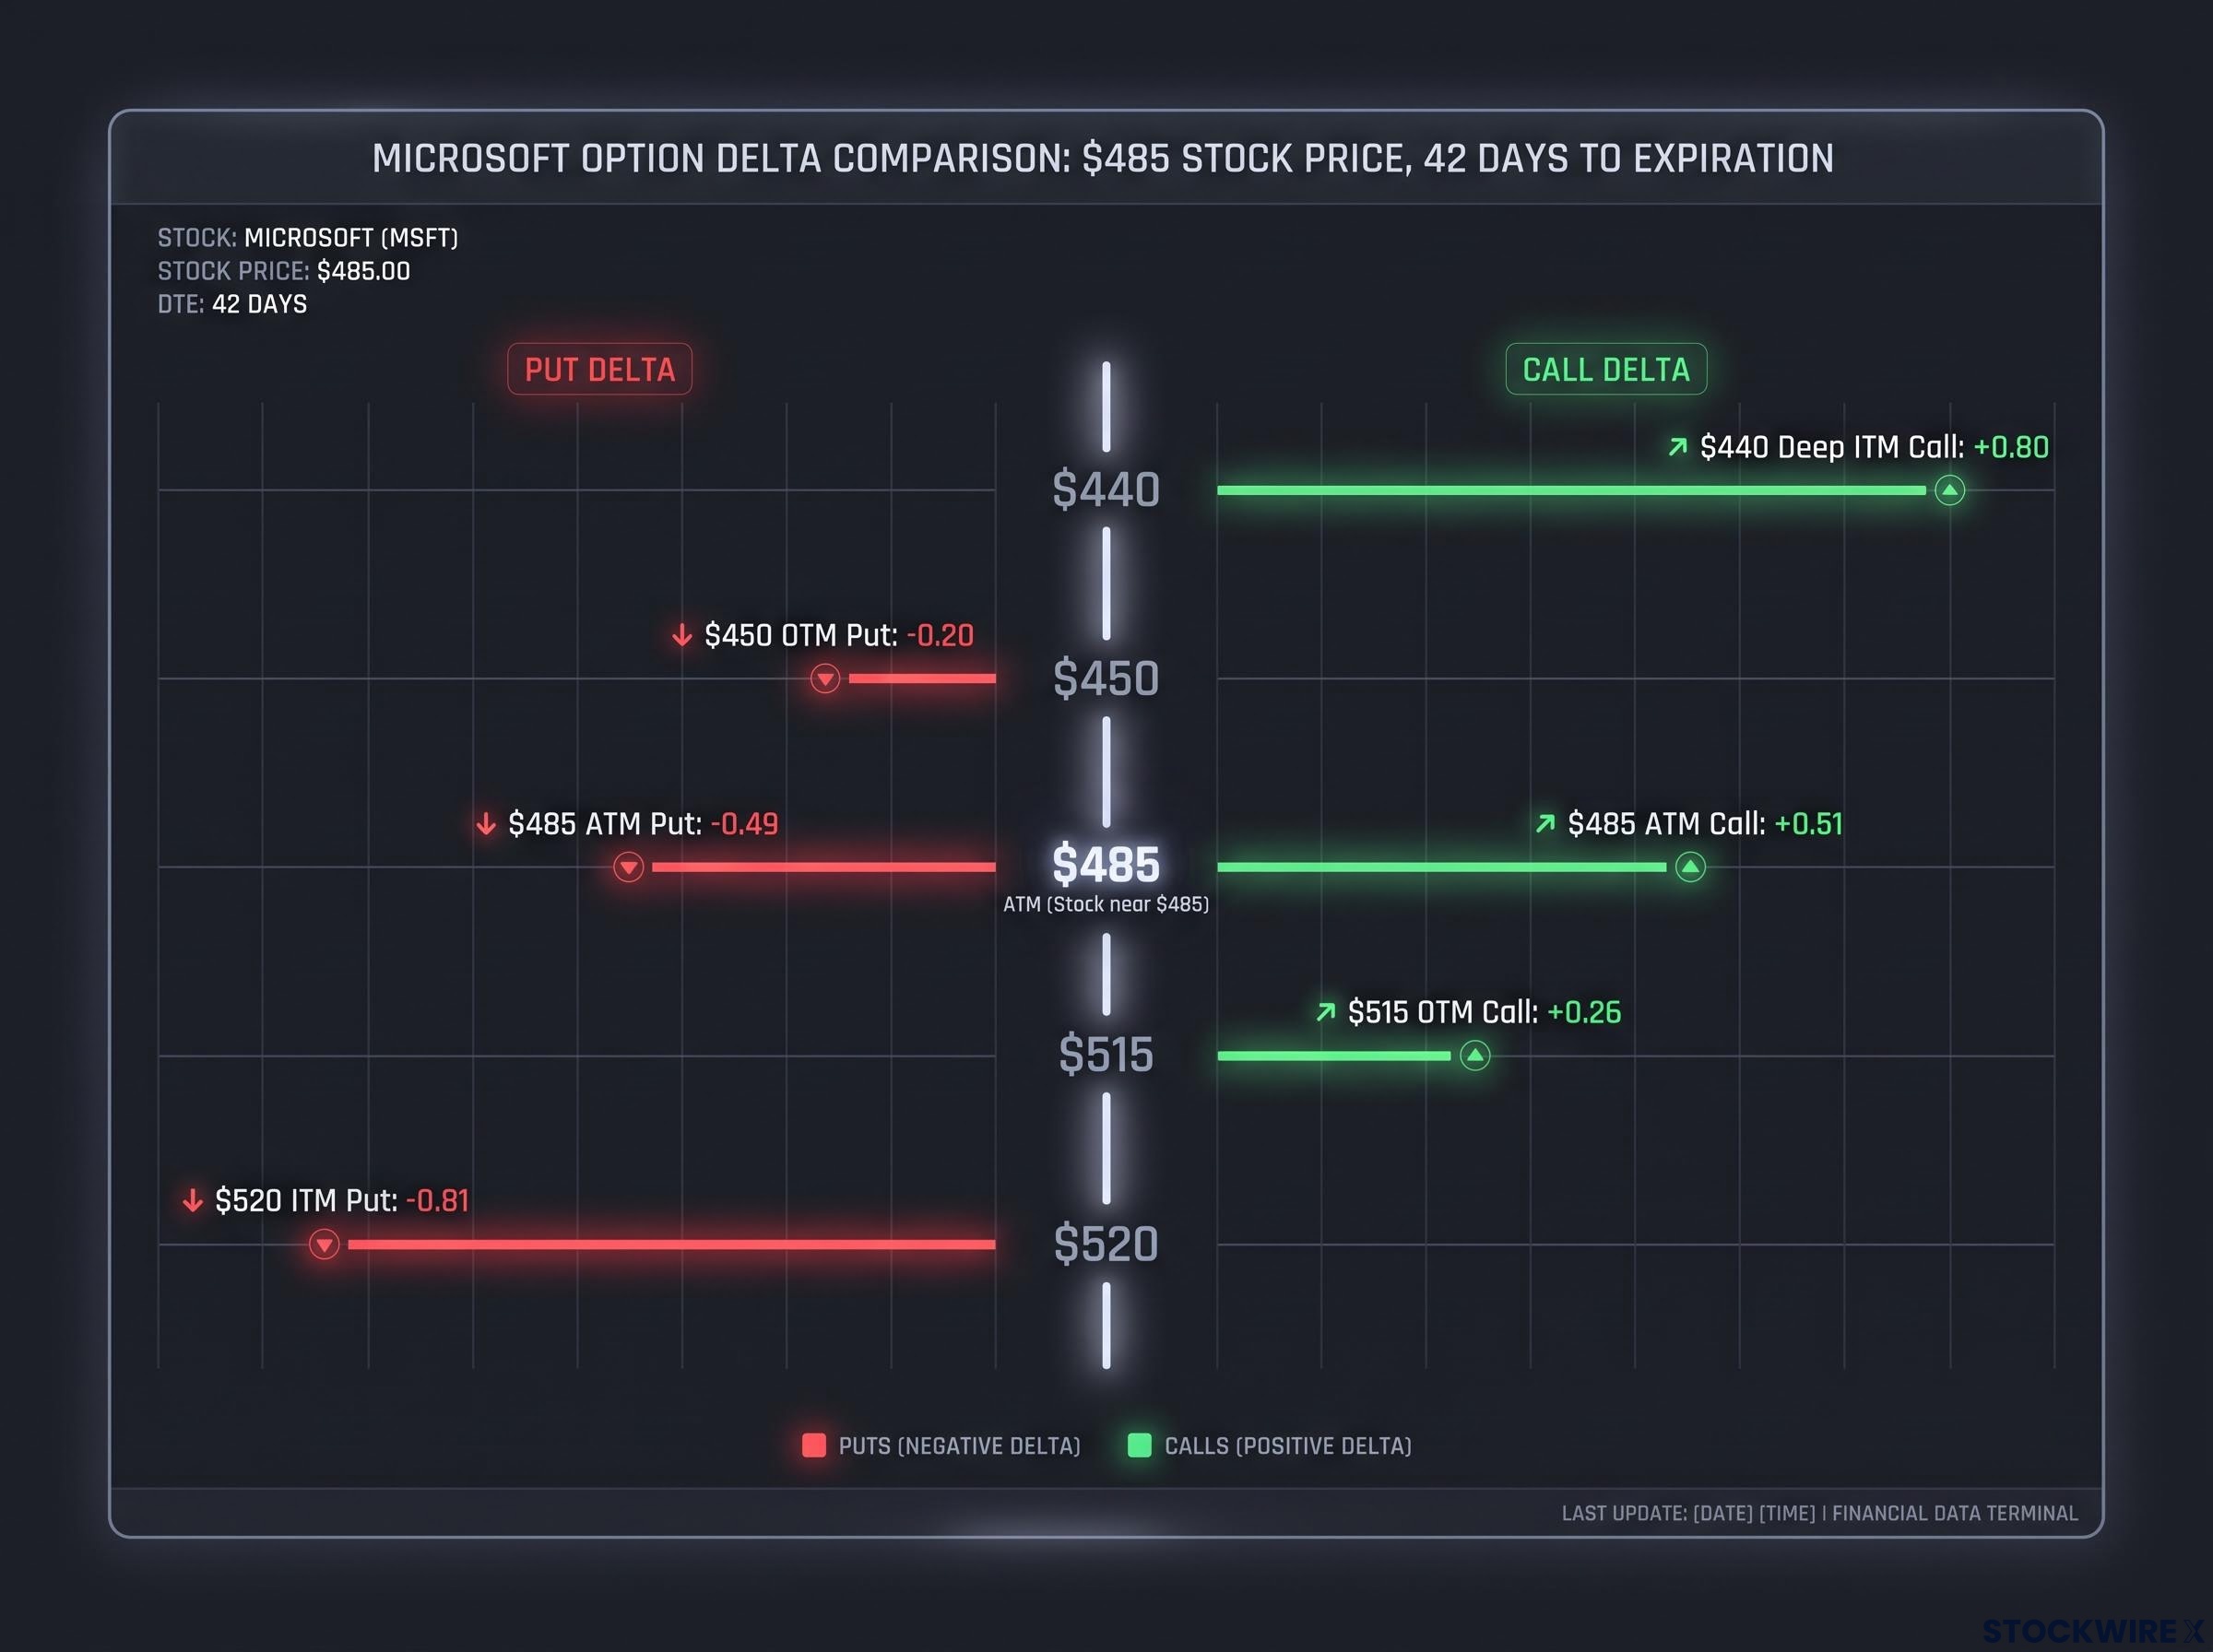
| Strike | Option Type | Moneyness | Delta |
|---|---|---|---|
| $440 | Call | Deep ITM | +0.80 |
| $485 | Call | ATM | +0.51 |
| $485 | Put | ATM | -0.49 |
| $515 | Call | OTM | +0.26 |
| $520 | Put | ITM | -0.81 |
| $450 | Put | OTM | -0.20 |
The pattern across the chain is consistent. ATM options cluster near ±0.50. Deep ITM options approach ±0.80 or above. Far OTM options fall toward ±0.20 or below.
Delta approximates the risk-neutral probability of an option finishing in-the-money. Higher absolute delta implies a higher probability of expiring with value; lower absolute delta implies a lower one.
When you pick a strike for a directional trade, you are implicitly picking a delta. That means you are choosing both how much the option moves per dollar of stock movement and how likely the market thinks it is to finish in-the-money. Strike selection and delta selection are the same decision.
Delta is not the only number shifting as you move across the chain: implied volatility sits behind every Greek and probability estimate your platform displays, and when it changes, delta, theta, and all derived figures shift with it.
Why delta is not a fixed number: the role of time to expiration
Time creates uncertainty, and uncertainty is what keeps OTM options alive. With several months to expiration, even a $515 strike call on a $485 stock has a plausible path to finishing in-the-money. The stock only needs to rise roughly 6%. That possibility sustains a moderate delta.
Strip the time away, and the picture changes completely. With three days left, that same $515 call has almost no realistic chance of reaching its strike. Its delta collapses toward zero. The option becomes nearly inert, barely responding to stock movement at all.
The same time-driven polarisation that amplifies a debit spread’s directional sensitivity also works in reverse for sellers: credit spread traders use time decay as a structural edge, collecting premium that erodes daily as long as the underlying stays away from the short strike.
The broader pattern:
- Long-dated options (several weeks or months remaining) distribute deltas closer to the middle of the range, roughly ±0.30-0.60 across most strikes, regardless of moneyness. Time keeps the distribution compressed.
- Short-dated options (days remaining) force deltas to polarise. The market is effectively deciding which strikes will finish in-the-money and which will not, and the delta column races to reflect that verdict.
If you buy an OTM option and the stock does not move, you are not just sitting still. Time is actively shrinking your delta, and with it, your option’s responsiveness to any eventual move that does arrive. Being directionally correct is not enough; the move must arrive while delta is still substantial enough to produce meaningful profit.
What happens to delta when expiration arrives
At expiration, the polarisation is complete. There is no middle ground left.
ITM options settle at ±1.00, moving in lock-step with the underlying on a dollar-for-dollar basis. In theory, every in-the-money option at this point carries full delta, though in practice small residual factors can introduce minor deviations.
OTM options settle at 0, losing all sensitivity to stock movement. The market has resolved the question of which options finish with value and which do not, and out-of-the-money strikes receive a delta of zero to reflect that resolution.
Graphical models of this behaviour capture the divergence across time: as expiration draws closer over a roughly 50-day window, an ITM call’s delta pushes progressively higher toward 1.00 while an OTM call’s delta drifts steadily lower toward 0. What begins as a modest separation between the two curves widens into a dramatic split by the final days.
Net delta in vertical spreads: how two legs combine
A vertical spread involves buying one option and selling another at a different strike within the same expiration. The net delta is simple arithmetic: long leg delta minus short leg delta. That subtraction gives you the spread’s combined sensitivity to a $1 move in the underlying.
Start with a Microsoft 480/490 put spread. With the stock near $485, you buy the 490 put (ITM, since the strike is above the stock price) and sell the 480 put (OTM, since the strike is below the stock price). The spread has a net negative delta, meaning the position benefits from the stock declining.
Simple enough so far. The interesting part is what happens to that net delta over time.
| Days to Expiration | Spread Delta (approx.) | Approx. Profit per $1 Drop |
|---|---|---|
| 42 | -9.87 | $9.87 |
| 35 | -10.82 | $10.82 |
| 28 | -12.09 | $12.09 |
| 21 | -13.00 | $13.00 |
| 14 | -16.00 | $16.00 |
| 7 | -23.00 | $23.00 |
| 5 | -29.00 | $29.00 |
| 3 | -48.00 | $48.00 |
With six weeks remaining, a $1 decline in Microsoft produces roughly $9.87 of theoretical profit on the spread. Compress that window to three days and the same $1 decline produces roughly $48 of theoretical profit from the identical position.
At 3 DTE, the spread generates approximately $48 per $1 stock drop versus approximately $9.87 at 42 DTE: nearly five times the sensitivity from the identical position.
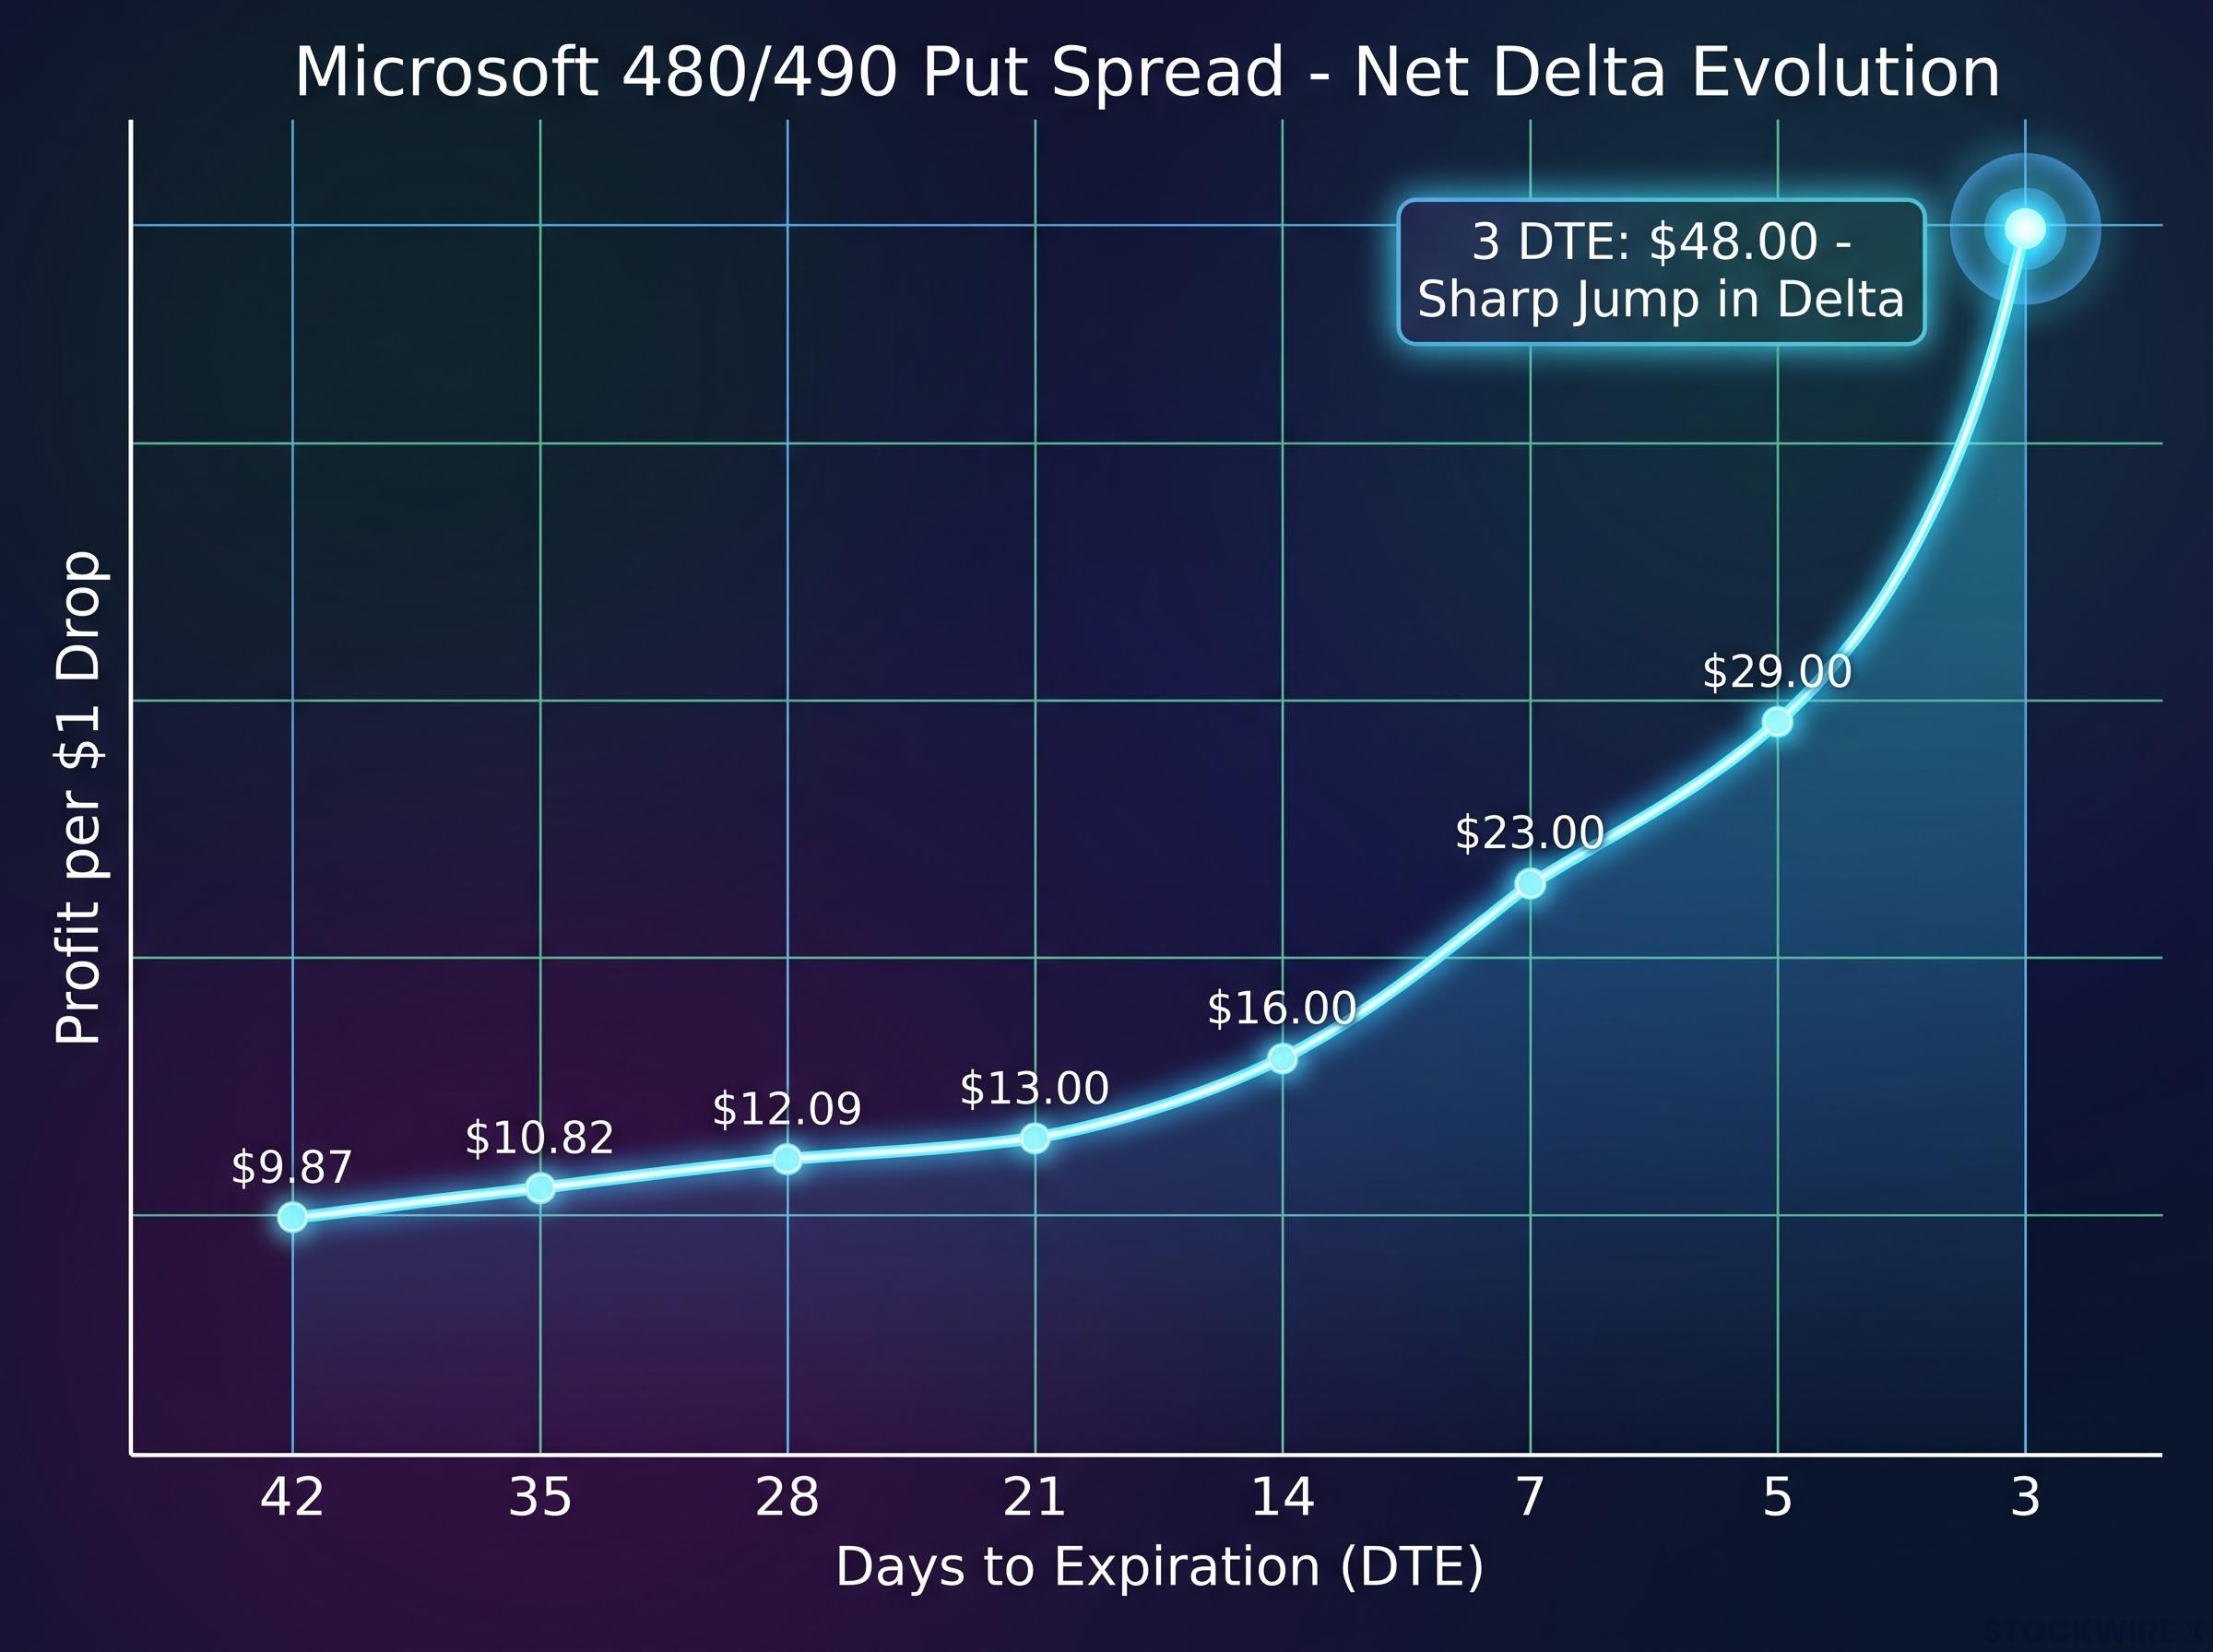
The underlying mechanics are driven by how each leg behaves near expiration. The 490 put (ITM) pushes its delta progressively toward -1.00 as the final days arrive, while the 480 put (OTM) sees its delta shrink toward 0. Net delta is simply the difference between the two legs, so as one approaches full delta and the other approaches zero, the gap between them widens sharply and the spread’s overall directional sensitivity expands with it.
Bear put spreads in practice look exactly like the 480/490 structure examined above: Barclays recommended precisely this structure in August 2026 to hedge a stretched Russell 2000 rally, choosing the spread over an outright long put to control net cost while preserving defined downside exposure.
The spread you entered at 42 days is not the same trade at 3 days. The identical position carries radically different risk and reward characteristics depending on when the underlying stock actually makes its move.
Short-dated versus long-dated spreads: what the delta difference means for your trade
This is not a question of which structure is better. Short-dated and long-dated spreads are genuinely different instruments built from the same components. Three dimensions help you place yourself.
Directional conviction
Strong conviction anchored to a near-term catalyst, such as an earnings release or an economic data print, tends to suit shorter-dated, higher-delta spreads. A spread with just a few days remaining and a delta near -48 will respond by roughly $48 to every $1 of favourable stock movement, and that degree of sensitivity is precisely what a well-timed, high-confidence trade is designed to capture.
A more measured view on a broader directional theme tends to suit longer-dated, lower-delta spreads. A spread placed with 42 DTE and a delta around -9.87 offers a more gradual response to stock movement, giving a thesis time to develop rather than demanding it materialise on a fixed schedule.
Timing expectations
If you expect the move within days, short-dated spreads capture maximum sensitivity. The delta table in the previous section shows why: the position becomes progressively more responsive as expiration nears.
If your thesis requires weeks to play out, long-dated spreads provide the window. The lower delta means smaller daily swings, giving the position durability through the noise that might otherwise shake you out.
Risk tolerance relative to premium
Short-dated spreads risk more of the premium for a larger payoff if correct. When the expected move does not arrive within the remaining window, or the stock moves in the wrong direction, the premium can be largely wiped out in a very short time. That same sensitivity which amplifies gains will accelerate losses just as readily.
Long-dated spreads suffer smaller swings in either direction. The position holds more of its value through periods when the stock moves against you, which creates a wider window for the trade to recover before expiration arrives.
Your choice between these two structures is effectively a statement about how certain you are that the move you expect will happen before a specific deadline. That is a harder question than whether you expect the move at all. Being honest about the distinction is what separates deliberate position sizing from guesswork.
Building on delta: where to go after you understand the basics
Delta is dynamic, not fixed. Its movement over time is what creates both the risk and the opportunity in vertical spreads. That is the core insight this guide delivers, and it shapes everything that comes next.
Three principles you now hold:
- Delta simultaneously measures price sensitivity and stock-equivalent exposure, and the stock-equivalent framing is the more practical tool for sizing your positions.
- Moneyness is the primary structural driver of delta: where the strike sits relative to the stock price determines the starting point.
- Time is the polarising force: it compresses delta toward the extremes as expiration approaches, making the final week of a spread’s life fundamentally different from the first.
The natural next concepts are gamma and theta. Gamma is the rate of change of delta: it tells you how fast delta itself is shifting. The sharp acceleration visible in the Microsoft put spread table above, where net delta roughly doubles between the final two weeks and triples again in the last few days, is gamma at work. Theta is the cost of time decay, which is the price you pay for holding the option while time is eroding its value.
Neither is harder than delta. Both are simply names for forces you have already seen in action through the examples above.
Your immediate next step: take the conviction, timing, and risk tolerance framework from the previous section and apply it to a paper trade or your next live options chain review. Pick two different expirations for the same spread structure and watch how the delta evolves. The numbers will confirm what this guide taught you, and that confirmation is where real understanding begins.
This article is for informational purposes only and should not be considered financial advice. Investors should conduct their own research and consult with financial professionals before making investment decisions. The examples throughout use illustrative figures consistent with standard options pricing theory and are not trade recommendations.