
Most options traders learn one lesson early: implied volatility usually runs higher than realised volatility, and the gap between them looks like free money waiting to be collected. That framing is not wrong. It is incomplete in a way that can cost you.
The gap is not a mispricing. It is a risk premium, and like every risk premium, it can compress, vanish, or flip into negative territory. When it does, the strategies built on top of it can come apart faster than most sellers expect.
Understanding the relationship between implied and realised volatility is the foundation of nearly every premium-selling strategy. Knowing that the gap exists is the easy part. Knowing why it exists, what holds it in place, and what conditions break it is what separates traders who survive a volatility spike from those who do not.
As of early September 2026, S&P 500 at-the-money implied volatility sat at 11.5% against a 20-day realised figure of 8.1%, a spread of 3.4 volatility points that looks orderly and comfortable. It will not always look that way.
What follows here is a practical orientation: what the implied versus realised volatility gap actually is, the specific conditions that break it, and what a break means for the exact type of position you are running.
The structural reason implied volatility almost always wins
You already know the signal. Implied volatility, the market’s forward-looking estimate of expected price movement baked into option prices, tends to sit above the volatility the underlying actually delivers. The temptation is to read that as an inefficiency you can harvest. It is not.
Index options, and out-of-the-money puts in particular, function as portfolio insurance for large institutions. Insurance is priced above its expected payout by design, because the seller has to be compensated for the possibility of a large claim.
That compensation has a name: the volatility risk premium (VRP), the difference between implied and realised volatility. It is what option sellers earn for taking on the risks that make selling volatility genuinely dangerous.
The volatility risk premium only makes sense once you have a firm grip on implied volatility basics: specifically, that IV is extracted from live market prices in real time and carries no directional signal, only a magnitude estimate about how much movement the market collectively expects.
Those risks come from three specific places:
- Jump risk: sudden price gaps where continuous hedging fails and losses land instantly
- Correlation spikes: the breakdown of diversification when everything sells off at once
- Vega convexity: losses that grow non-linearly as volatility itself rises
There is also a plumbing problem underneath all of this. The natural buyers of downside protection, pension funds, asset managers, and structured-product desks, vastly outnumber the natural sellers. To attract enough sellers to clear the market, implied volatility has to settle above the level of volatility that tends to follow. That structural imbalance is what keeps the premium alive.
A Pennsylvania State University honours thesis examining the period from 1990 to 2012 found that the VIX overestimated realised volatility over the subsequent 22 days on 85.6% of trading days, underestimating it on only 14.4%.
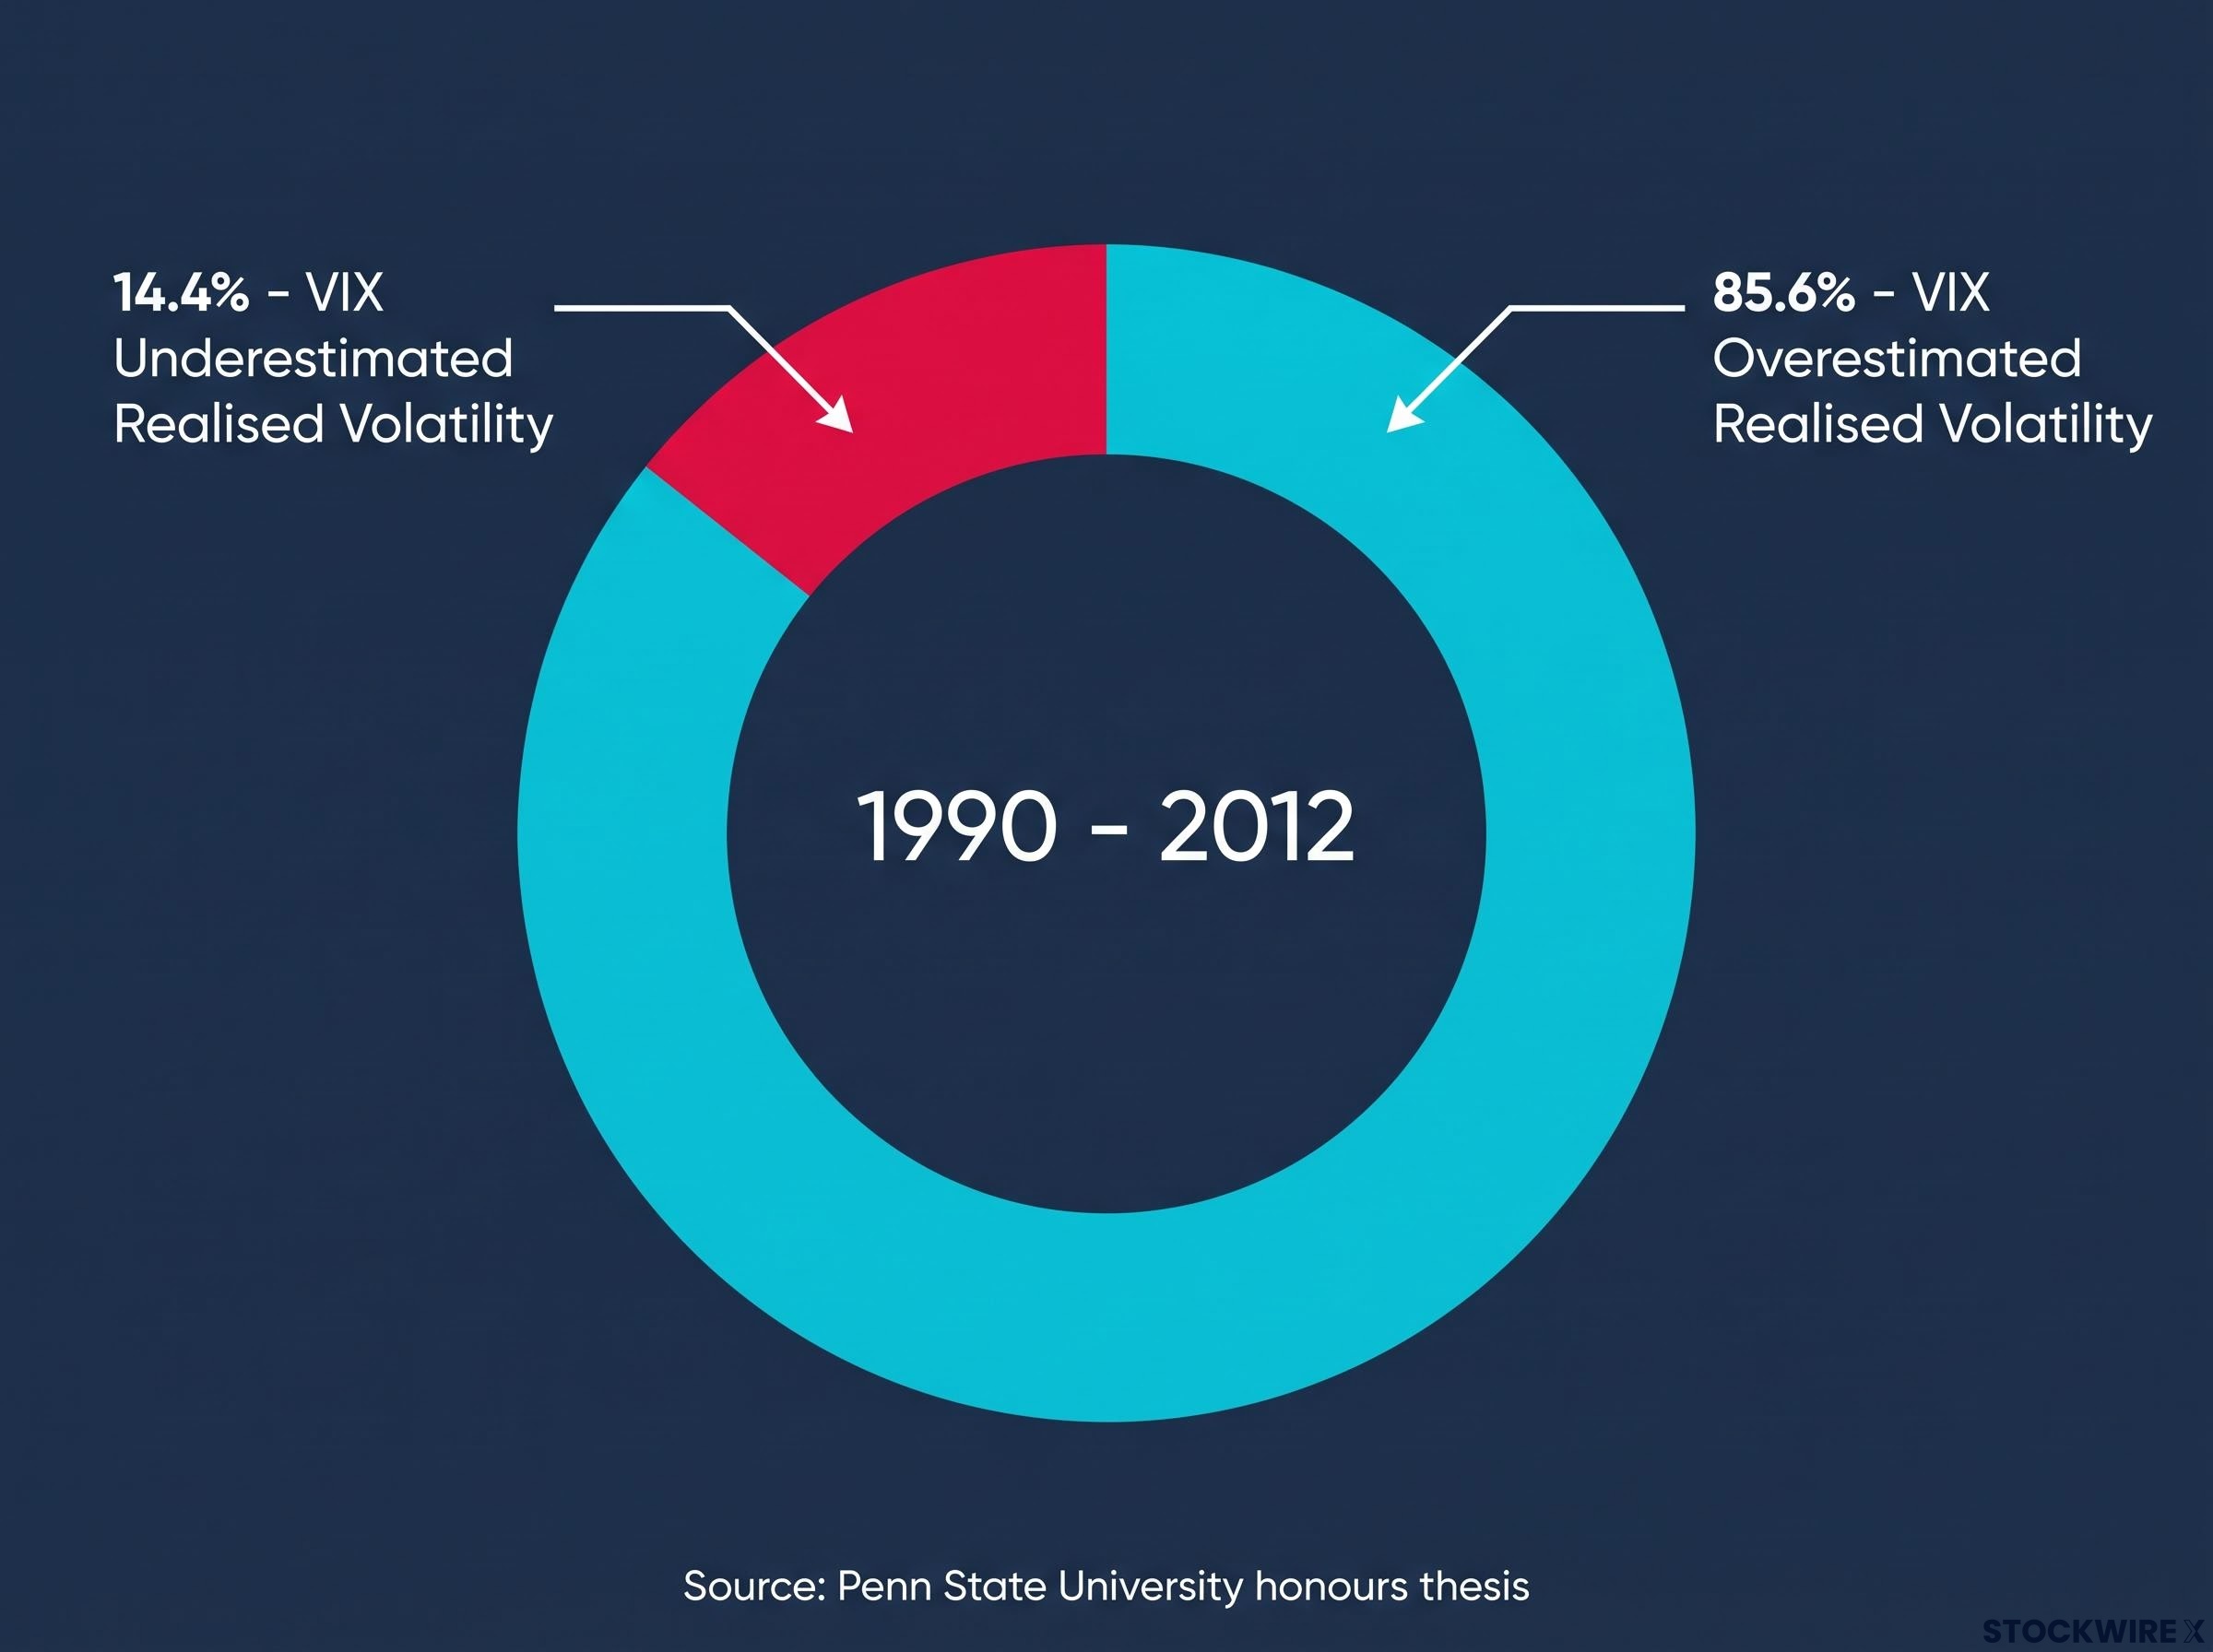
That last figure is the one to hold onto. Collecting the premium means accepting the losses that arrive on the roughly one day in seven when realised volatility breaks above implied.
What the numbers look like across time frames
The premium is not fixed. As of 10 September 2026, VIX spot was reported at 16.47, sitting against a 20-day annualised realised figure of 8.3% for the S&P 500. That is a comfortable, live spread.
Zoom out and the premium moves. Gateway Investment Advisers reported that in Q4 2025, the quarterly spread between S&P 500 implied and realised volatility ran to 5.14 percentage points, well above the since-1990 average of 3.57 percentage points. A short-strangle example from strategy research shows how large it can get: implied volatility of 27.4% against realised of 19.9%, a VRP of 7.5 vol points.
Your lookback period matters too. The 20-day realised reading of 8.3% and the 60-day figure of 12.3% in early September 2026 diverge meaningfully, which means the size of the gap you measure depends partly on which window you choose. The premium is compensation for a service rendered, not an opportunity sitting uncollected, and its size tells you how well you are being paid.
When big ASX news breaks, our subscribers know first
What does the IV-RV relationship actually look like when it breaks?
The reversals are not random. Walk through the documented episodes where realised volatility sustained above implied in a broad index, and a common thread appears every time: a slow-moving crisis that option markets were initially too calm to price.
Volatility compression at record highs represents one of the more reliable manifestations of the IV-RV gap: on S&P 500 all-time high close days, options have implied a 0.92% daily move while the market has delivered just 0.33%, a 2.8x implied-to-realised ratio that is double the long-run average.
Take March to October 2002. A European Central Bank review of implied stock-market volatility noted that implied volatility under-predicted realised volatility substantially over that stretch, as the lingering fallout from the dot-com collapse and a wave of accounting scandals produced more turbulence than the options market had priced in.
The pattern repeated in the early phase of the financial crisis. A study of call options found that after July 2008, realised volatility exceeded implied as rumours about the health of the US financial system intensified and markets were slow to price the escalating systemic risk.
Then came the most extreme inversion on record.
In early January 2009, Credit Suisse equity-derivatives analysis reported that the spread between 3-month implied and realised volatility on the S&P 500 reached roughly negative 33 volatility points, with implied sitting far below realised as markets bet the worst was over while actual volatility stayed elevated.
| Period | Approx. spread (IV minus RV) | Duration | Primary driver |
|---|---|---|---|
| March-October 2002 | Negative (IV under-predicted RV) | Several months | Dot-com fallout, accounting scandals |
| Post-July 2008 | Negative (RV exceeded IV) | Extended | Escalating financial-crisis risk |
| January 2009 | Approx. negative 33 vol points | Acute | Crisis repricing, elevated realised vol |
Reversals like these in a diversified index require extreme and chaotic conditions. That is why they are rare. In individual stocks the bar is far lower, because a single idiosyncratic event can push realised volatility above implied within a single session.
Meta offered a stark example. Research from the original source describes an intraday move of roughly 17 points to the upside in one session, against an implied session range of around 5 points, an implied end-of-week range of roughly 14 points, and an implied range over the following week of about 20 points. A full week of expected movement, realised in a single day.
The lesson is not that these events are unpredictable noise. It is that implied volatility lags escalating risk on a structural basis, and recognising that lag as a warning to step back, rather than an invitation to sell more volatility, is what keeps disciplined sellers out of the worst episodes.
Why the gap matters differently depending on what you are trading
Here is where the concept becomes personal. The same inversion event lands completely differently depending on the position you are holding, and the difference decides whether an RV-above-IV episode is an inconvenience or a portfolio event.
Start with the neutral premium seller running a short straddle, strangle, or iron condor. A delta-hedged short position profits when theta, the income you earn from time decay, exceeds the losses you take from gamma hedging as the underlying moves. When realised volatility breaks above implied, gamma losses outpace theta and the edge flips negative. You are now accepting less than fair value for the risk you have transferred.
The directional trader is a different story. Their profit and loss is driven by which way the underlying moves, not by whether the size of that move was priced correctly. An IV-RV inversion does not harm them in the same structural way, because they were never being paid to forecast the magnitude of movement in the first place.
For the neutral seller, three specific failure modes emerge when realised volatility surges:
- Gamma losses overwhelm theta: the underlying moves more than priced, and every day the trade stays open worsens the expected outcome
- The VRP goes negative: you are effectively selling insurance below cost, with no structural edge left
- A range breach turns the position directional: a large realised move pushes price through your short strikes, converting a neutral trade into a directional one you did not choose
The CBOE S&P 500 Iron Condor Index (CNDR) illustrates the point. Commentary on the index notes that its drawdowns are often driven not by implied volatility spikes alone but by realised volatility exceeding implied, causing sharp repricing of the short legs while the long-wing protection proves insufficient. Short-vol strategies also carry negative skew and excess kurtosis, meaning small frequent gains punctuated by occasional severe losses. That is not a malfunction. It is the shape of the return.
Short-volatility cascade risk adds a systemic dimension to the failure modes the article describes: with roughly $1.5 trillion in explicit and implicit short-volatility exposure outstanding, a forced simultaneous unwind can destroy the exit liquidity sellers need precisely at the moment margin calls are largest.
Monitoring signals that tell you the edge is thinning
If you run neutral short premium, the IV-RV spread is not a statistic to note and forget. It is an active risk-management trigger. Practitioners recommend watching three things together:
- Track the IV-RV spread continuously: a narrowing or negative spread tells you the structural edge is thinning or gone
- Compare your P&L to realised gamma measures: drawdowns alongside rising gamma indicate realised swings larger than implied
- Watch ATM IV, IV rank, and trailing realised volatility side by side: never in isolation
Analytics platforms already report these metrics together, which is why an example like the SPX reading of 11.5% implied against 8.1% realised is useful. It shows you what a healthy spread looks like in practice. When that spread narrows toward zero or inverts, the message is direct: reduce size or widen strikes rather than chase premium into a shrinking edge.
Why zero DTE options turn the IV-RV question into an intraday problem
Everything above assumes days or weeks. Zero-days-to-expiry (0DTE) options compress the entire question into a single session, and the mechanics that do the compressing change the nature of the risk completely.
The core distinction is structural. A 0DTE option carries near-zero vega, its sensitivity to changes in implied volatility, and extreme gamma, the rate at which its delta shifts as the underlying moves. That combination means an implied volatility spike barely touches its price, while actual intraday movement is everything. The multi-day IV-RV forecast that mattered in earlier sections is almost irrelevant here.
Then there is the feedback loop. One-sided demand for same-day puts can push dealers into a short-gamma position, forcing them into pro-cyclical hedging that amplifies the very intraday moves it is reacting to. This is a distinct risk channel from the slow IV-RV dynamic, and it is now a structural feature rather than an occasional quirk.
0DTE contracts represented 66.2% of total S&P 500 options volume in July 2026, a record at the time of reporting, up from roughly 22% when Tuesday and Thursday expiries were introduced in 2022.
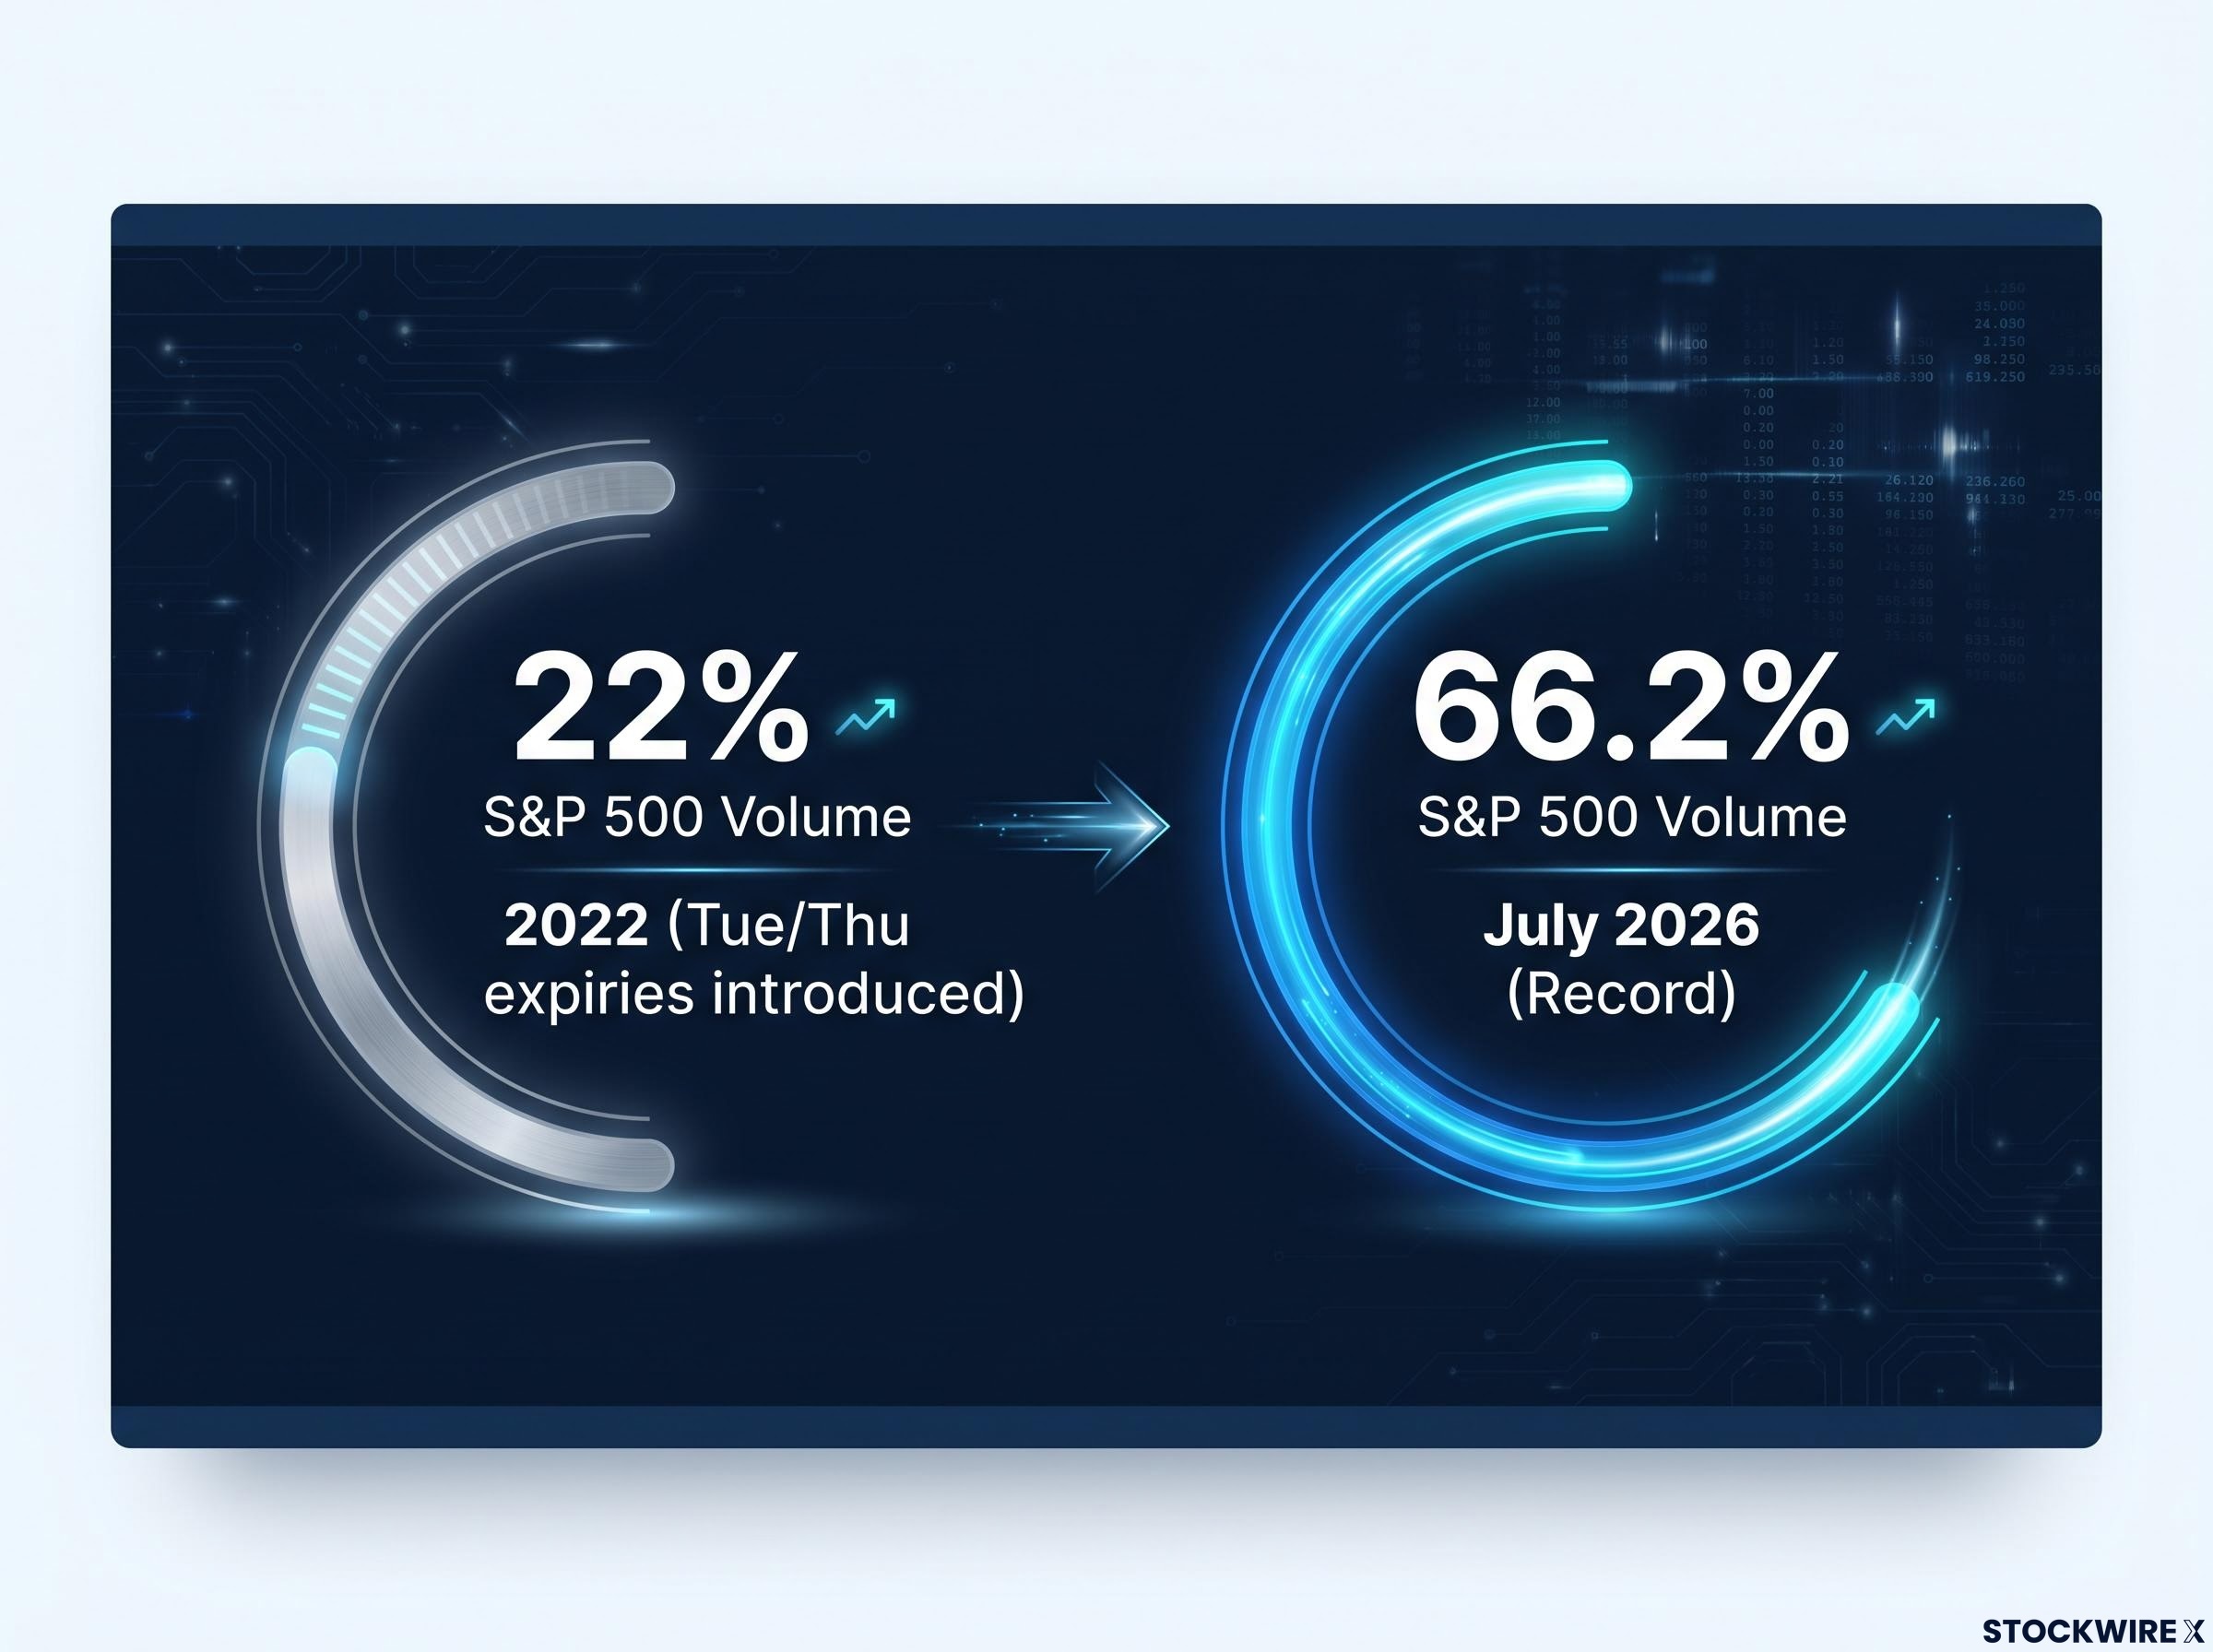
That growth means dealer hedging is now baked into the intraday behaviour of the market itself. Cboe research on 0DTE index options found that typical dealer gamma positioning slightly reduces daily realised volatility, but its maximum impact can increase annualised realised daily volatility by approximately 3.3 percentage points, so positioning can either dampen or amplify movement depending on which side of gamma dealers sit.
For readers wanting to understand the structural plumbing in more depth, our full explainer on zero DTE gamma dynamics examines how dealer hedging converts same-day positioning into real index flows, including a documented pinning episode where the S&P 500 closed one point above the session’s heaviest strike concentration.
The intraday pinning and breakout dynamic tends to unfold in a sequence:
- High open interest concentrates around same-day strikes
- Dealer hedging stabilises price within a tight range
- A catalyst breaks through a key strike
- Dealer hedging flips and accelerates the move into a sharp volatility spike
The jump-risk component is dominant. An SSRN study using high-frequency data on SPXW 0DTE options found that the implied premium for jump risk in same-day options is nearly twice as large as the combined premiums for diffusion and volatility risk. Day-of jump risk is the main thing you are pricing.
Sizing for a risk that cannot be hedged, only contained
Gamma explosion events around catalysts, Fed announcements, major data releases, geopolitical shocks, cannot be predicted or hedged out of a 0DTE book. They can only be sized for. A modest intraday move of roughly 20 points in 15 minutes can turn a comfortable same-day iron condor into a max-loss outcome before you have time to react.
That is the practical takeaway. With 0DTE, the relevant unit of risk is the intraday price path, not the daily implied range, and your window to respond to an adverse move is measured in minutes. Short-premium 0DTE positions therefore demand smaller sizing than equivalent multi-day positions, because containment is the only defence available.
When to act on the IV-RV gap and when to step back
Pull the threads together and a strategy-specific rule emerges. For neutral short-premium positions, the IV-RV spread is a primary risk input that belongs in your daily workflow. For directional positions, it is context rather than a variable you need to monitor every session.
The most useful way to treat the spread is as a position-sizing filter, not a trade-entry signal in isolation:
- Wide positive VRP: full allocation to a short-premium neutral strategy is supportable
- Narrow or thinning VRP: reduce size or widen strikes rather than chase premium
- Negative VRP: step back and reassess, because the structural edge has gone
Keep the reference points in view. The long-run VRP average sits at 3.57 percentage points, the Q4 2025 reading of 5.14 points shows what an elevated premium looks like, and the January 2009 inversion of roughly negative 33 points marks the extreme on the other side. The Penn State data is the reminder that realised volatility exceeded implied on 14.4% of days, frequent enough that you cannot dismiss it.
The premium delivers a positive expected return over time, but short-vol strategies carry negative skew and fat tails. The occasional severe loss is not a failure of the approach. It is a predictable feature that your sizing and monitoring have to account for from the start.
This article is for informational purposes only and should not be considered financial advice. Investors should conduct their own research and consult with financial professionals before making investment decisions.
Past performance does not guarantee future results, and any figures discussed here are subject to market conditions and various risk factors.