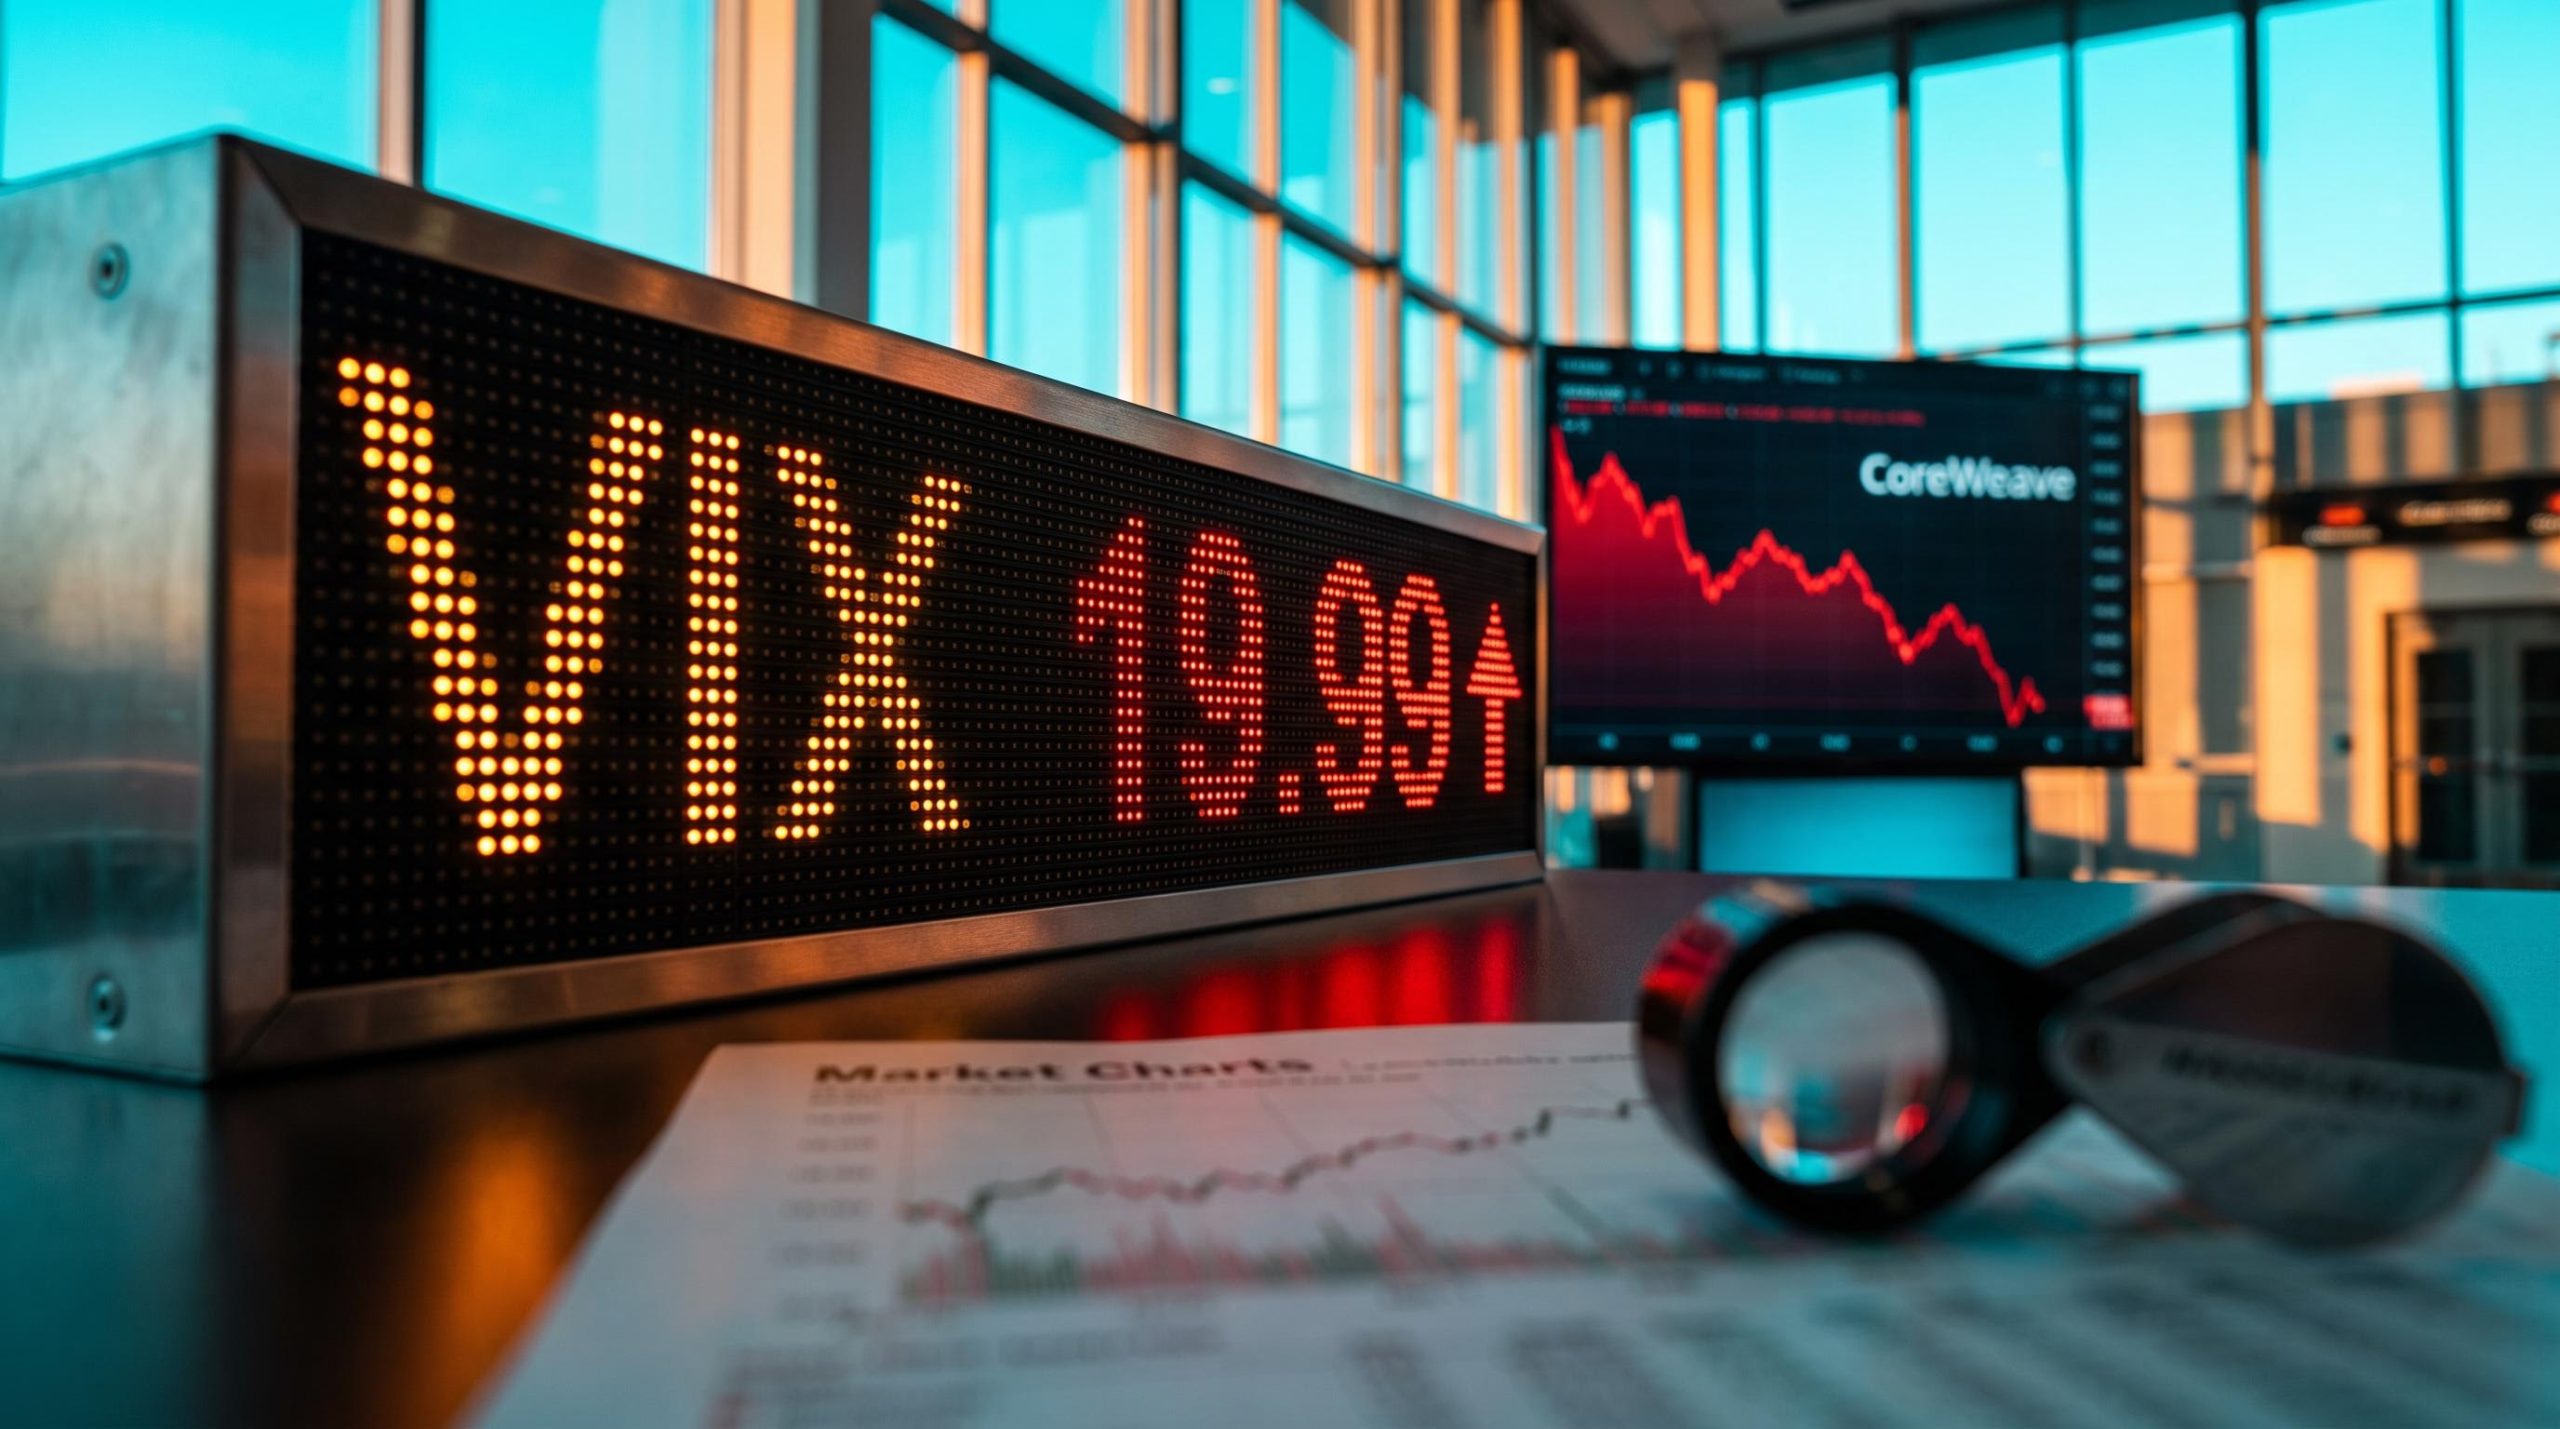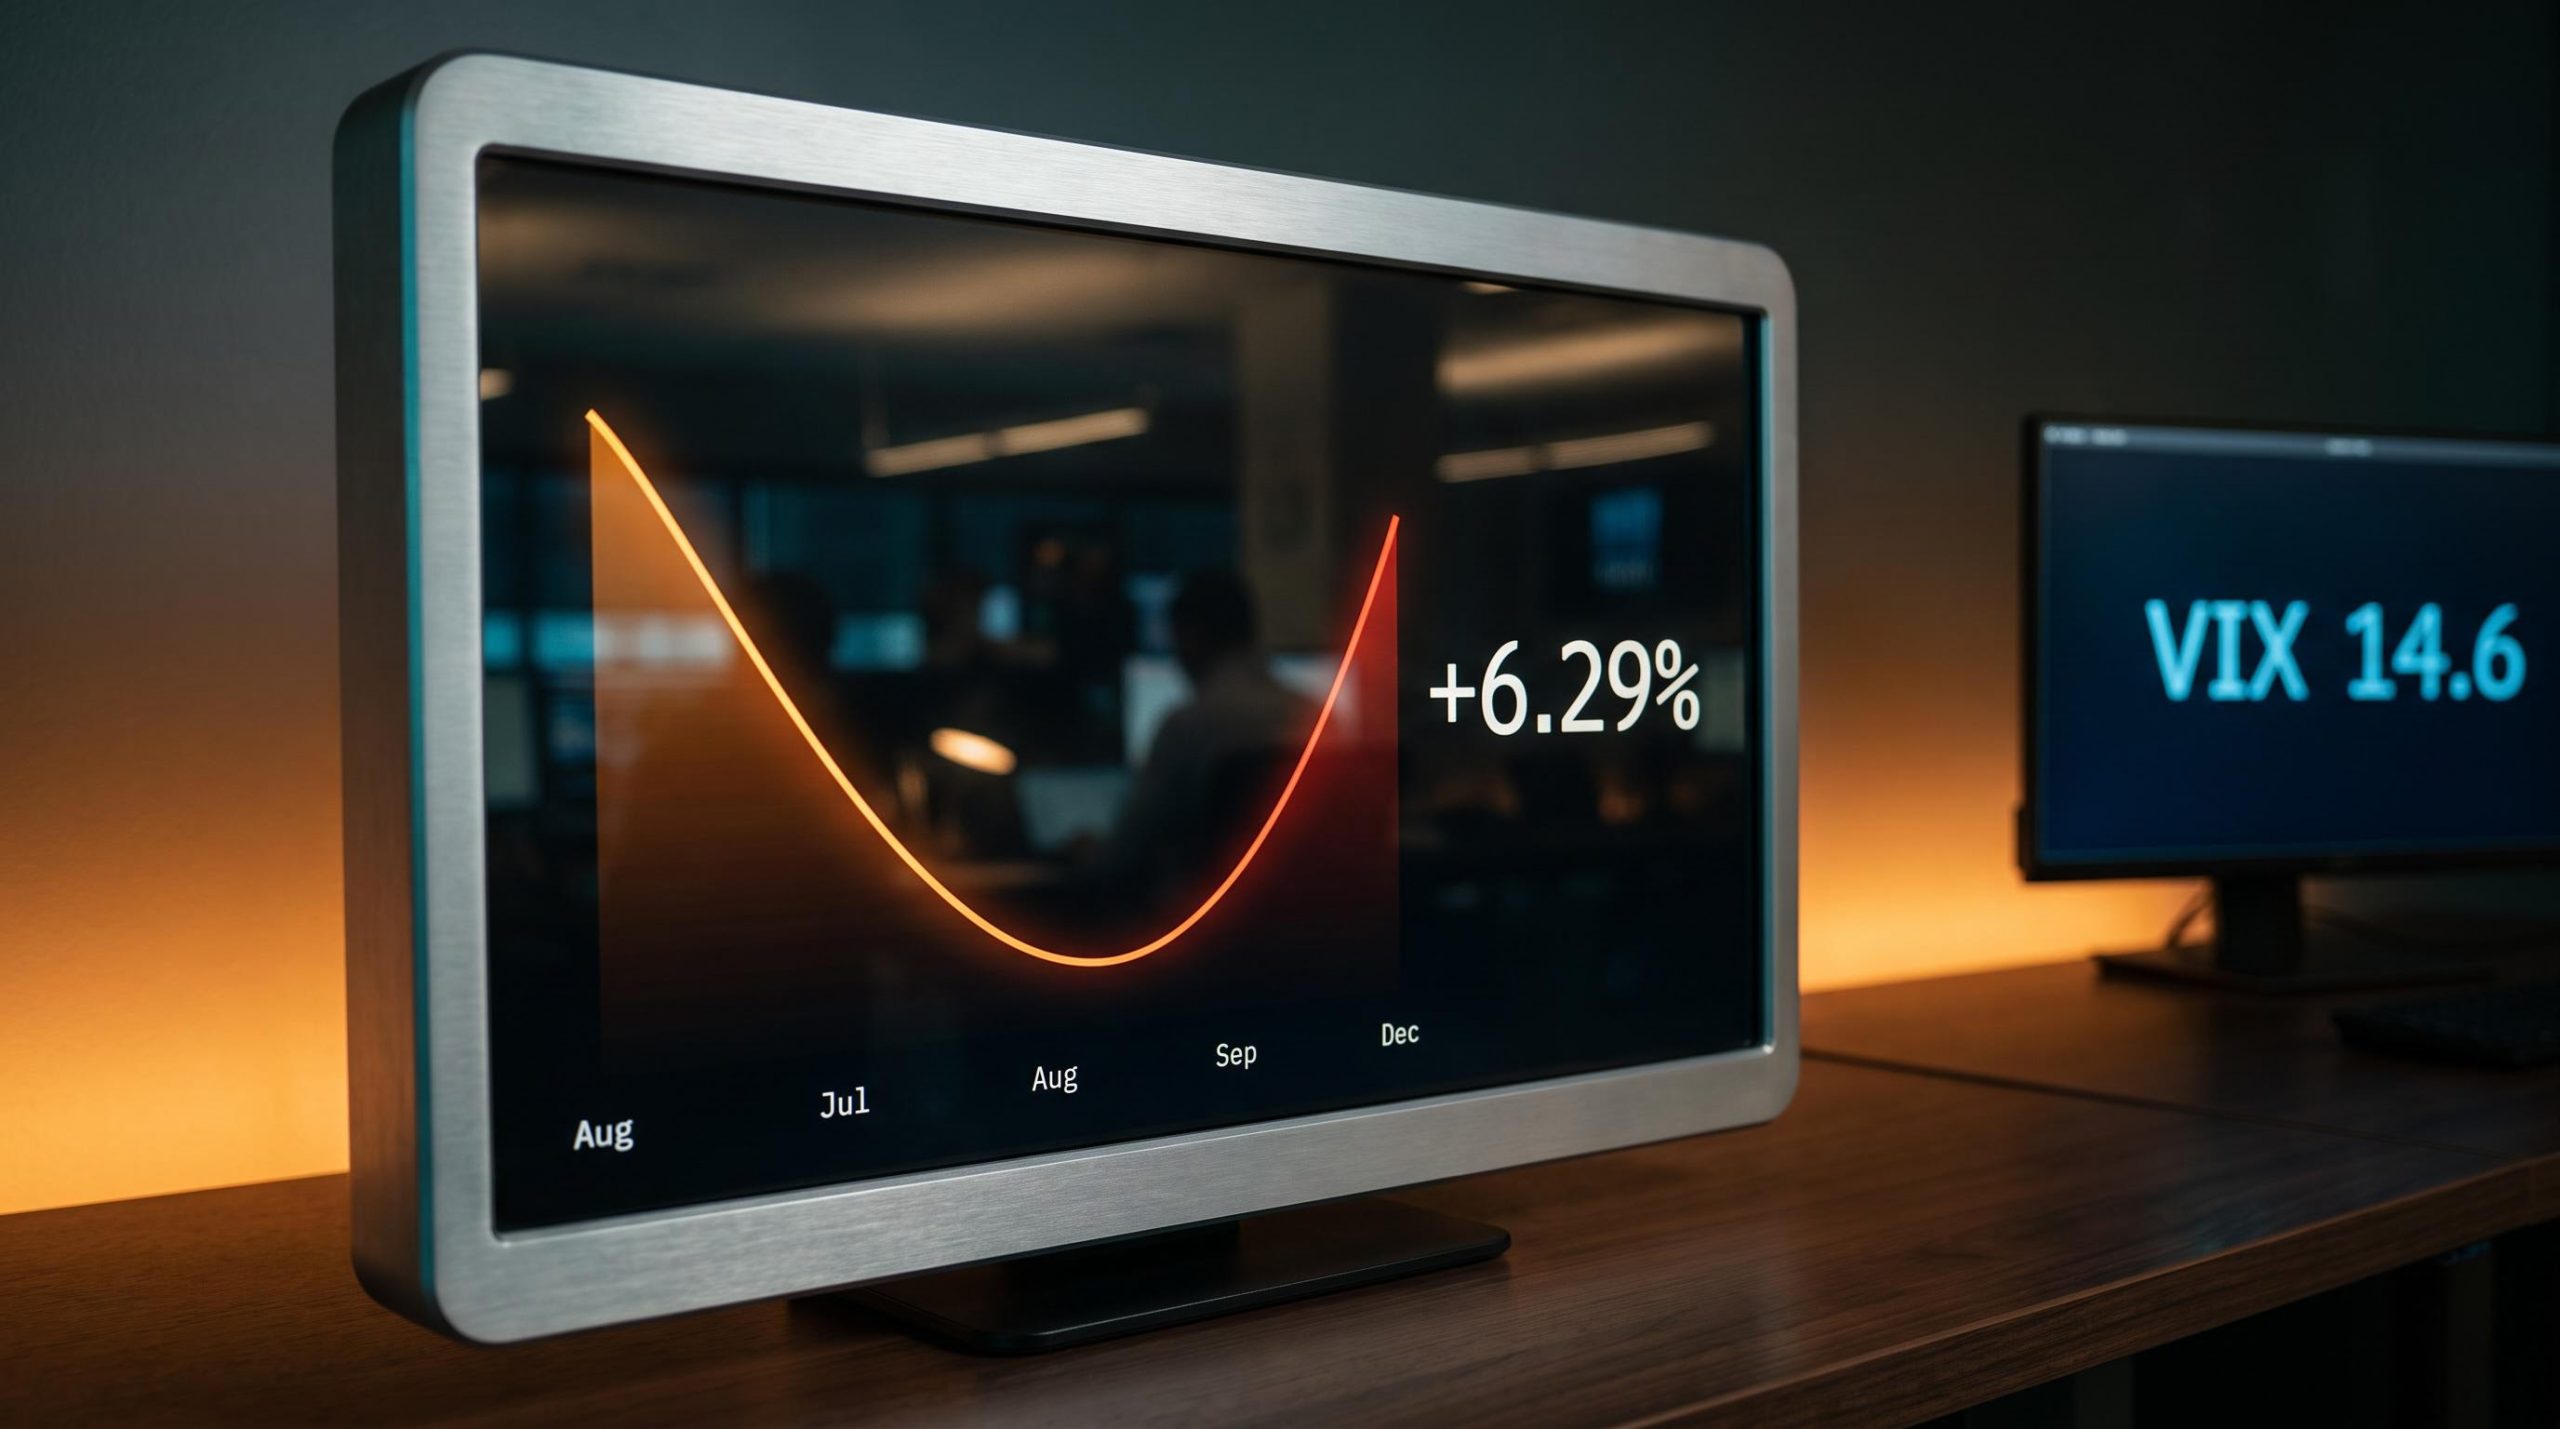
The VIX is sitting in the mid-teens, equity indices are hovering within a couple of percentage points of all-time highs, and options premiums are about as cheap as they get. It is the kind of calm that makes portfolios feel safe. It is also, according to more than three decades of data, precisely the moment in the calendar when the historical average begins its most sustained climb of the year.
As of 28 August 2026, the S&P 500 trades near 7,700-7,725, roughly 1-2% below mid-August records. The VIX has drifted down to approximately 14.4-14.8 from levels near 18-19 in late July. That decline places implied volatility at the lower end of its historical range, right at the inflection point where multiple independent seasonal composites, spanning 27 to 34 years of data, show the average beginning to slope upward through early October.
Here is what those composites actually show, where the quantitative evidence is strong and where it is honestly contested, and how traders with different risk tolerances have historically positioned around this window. The distinction between a statistical tendency and a forecast matters; the data respects it, and this analysis will too.
What three decades of VIX data reveal about the late-summer inflection
The VIX seasonal composite, built from daily closing data going back to 1992, traces a recurring annual shape that has held across multiple market regimes. The pattern is not about any single month. It is about the full-year arc, and understanding that arc is what makes the current moment legible.
The broad roadmap breaks into four phases:
- Early-year drift lower: After opening in January, the VIX typically edges downward through the opening weeks of the new year.
- Spring uptick: Between roughly mid-January and mid-March, the average works its way higher, a period associated with early-year positioning shifts and broader macro uncertainty.
- Mid-summer trough: The VIX drifts back down through late spring and into summer, bottoming around mid-July. This is the calendar’s quietest stretch.
- Late-summer rise: Beginning in late August, the historical average climbs steadily, peaking near early October before declining into year-end.
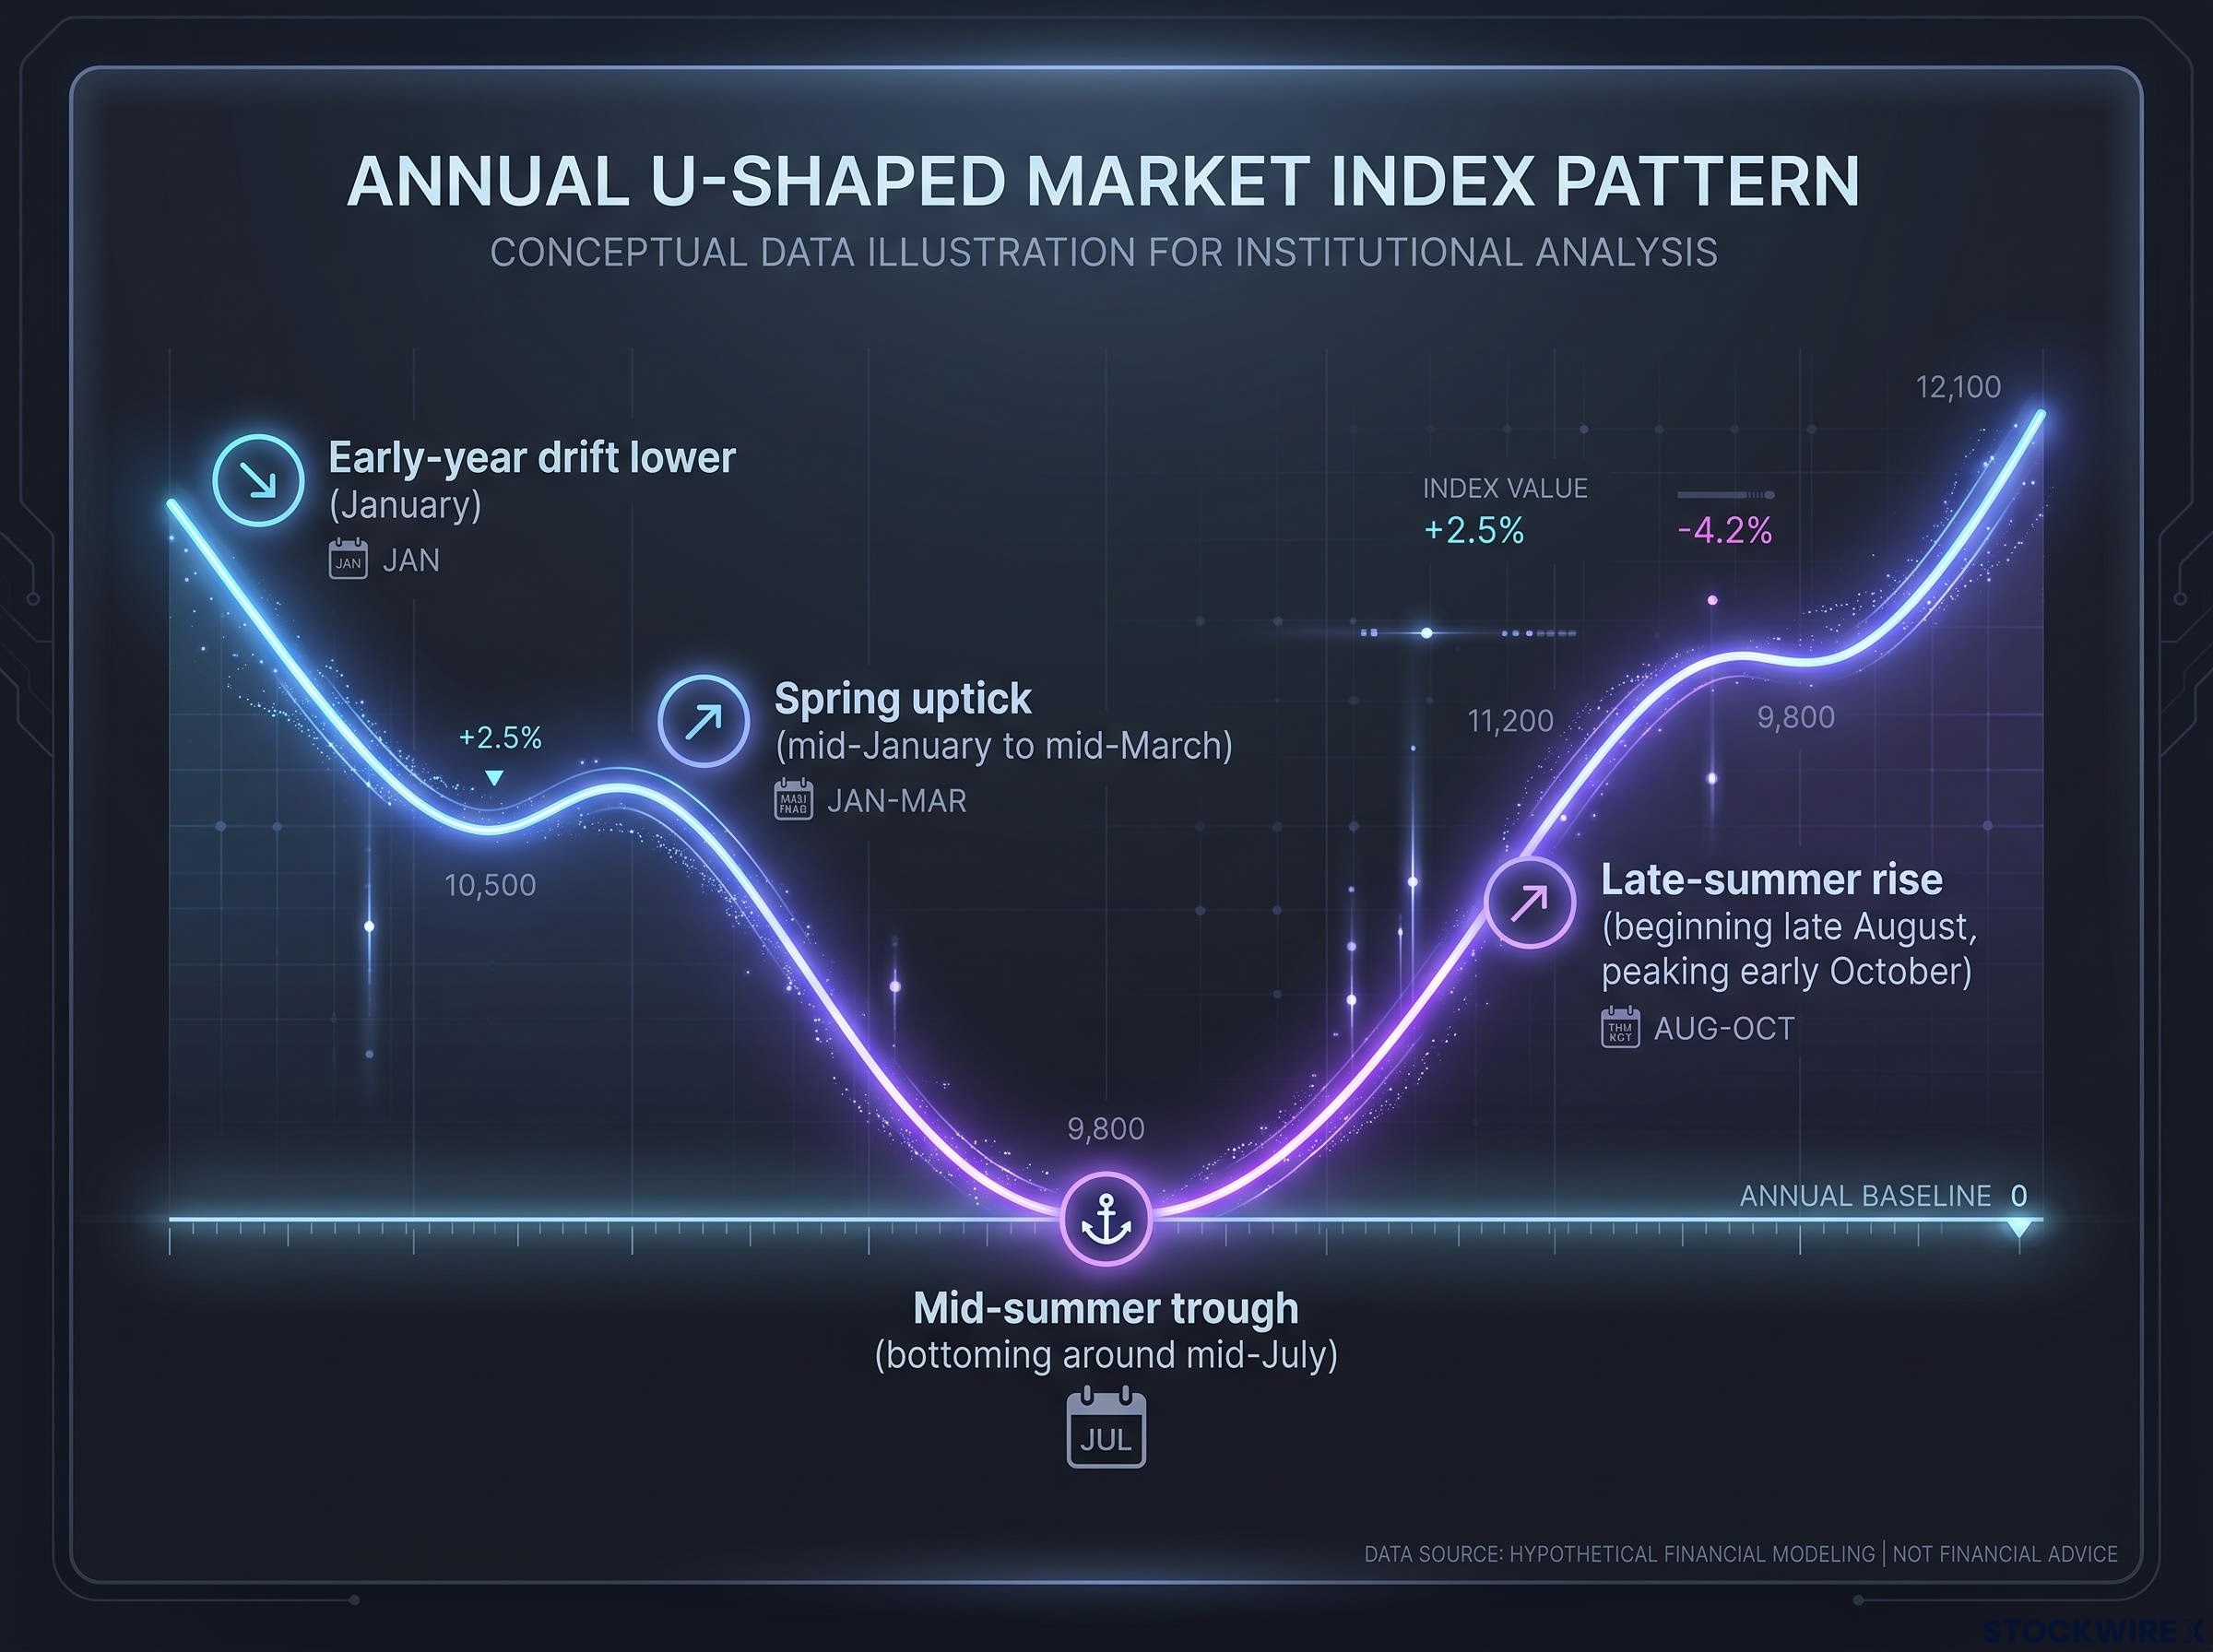
That mid-July trough is the structural anchor. It is the point from which the seasonal rise originates, and it reframes the current mid-teens VIX reading not as evidence of a stable market regime but as the expected departure point for the historically choppier stretch ahead. What feels like safety is, in the seasonal composite, the exhale before the inhale.
The VIX reading of 14.4-14.8 is most usefully interpreted in context: implied volatility measures the market’s collective expectation of future price movement magnitude, not its direction, and its value relative to an asset’s own historical range is the first filter any practitioner applies when selecting between premium-buying and premium-selling strategies.
How independent analyses corroborate the composite
The full-year shape described above is not the product of a single analyst’s methodology. Multiple independent studies, using different sample lengths, arrive at the same broad arc.
A DailyTickers analysis describes a U-shaped annual pattern: subdued levels early in the year and during summer, with peaks concentrated in September and October and a decline into year-end. A Medium study using 34 years of data finds the VIX “usually rises in March and April, dips in early summer around June and July, then climbs sharply into September and October.” An Investing.com Canada study highlights that the VIX “tends to bottom around the middle of July before breaking higher throughout August,” with seasonal peaks in October on both 10-year and 28-year composites.
Three different sample periods. Three different methodologies. The same broadly recurring shape. That convergence strengthens the statistical credibility of the pattern considerably.
When big ASX news breaks, our subscribers know first
The numbers behind August, September, and October
The full-year arc gives you the shape. The monthly return figures give you the magnitude, and the magnitude is where honest calibration matters.
A 27-year seasonality dataset from SeasOptima provides the most granular monthly breakdown available:
| Month | Average VIX return | Seasonal direction |
|---|---|---|
| August | +4.19% | Rising |
| September | +6.29% | Rising |
| October | +4.43% | Rising |
| November | -6.43% | Declining |
September’s +6.29% average stands out as the single highest monthly VIX increase in the dataset. But context matters: 9 of 12 months show positive average VIX returns overall. August through October are elevated in cluster, not exceptional in direction. The seasonal pattern has a clearly defined beginning and a clearly defined endpoint, with November’s sharp average decline marking the historical resolution.
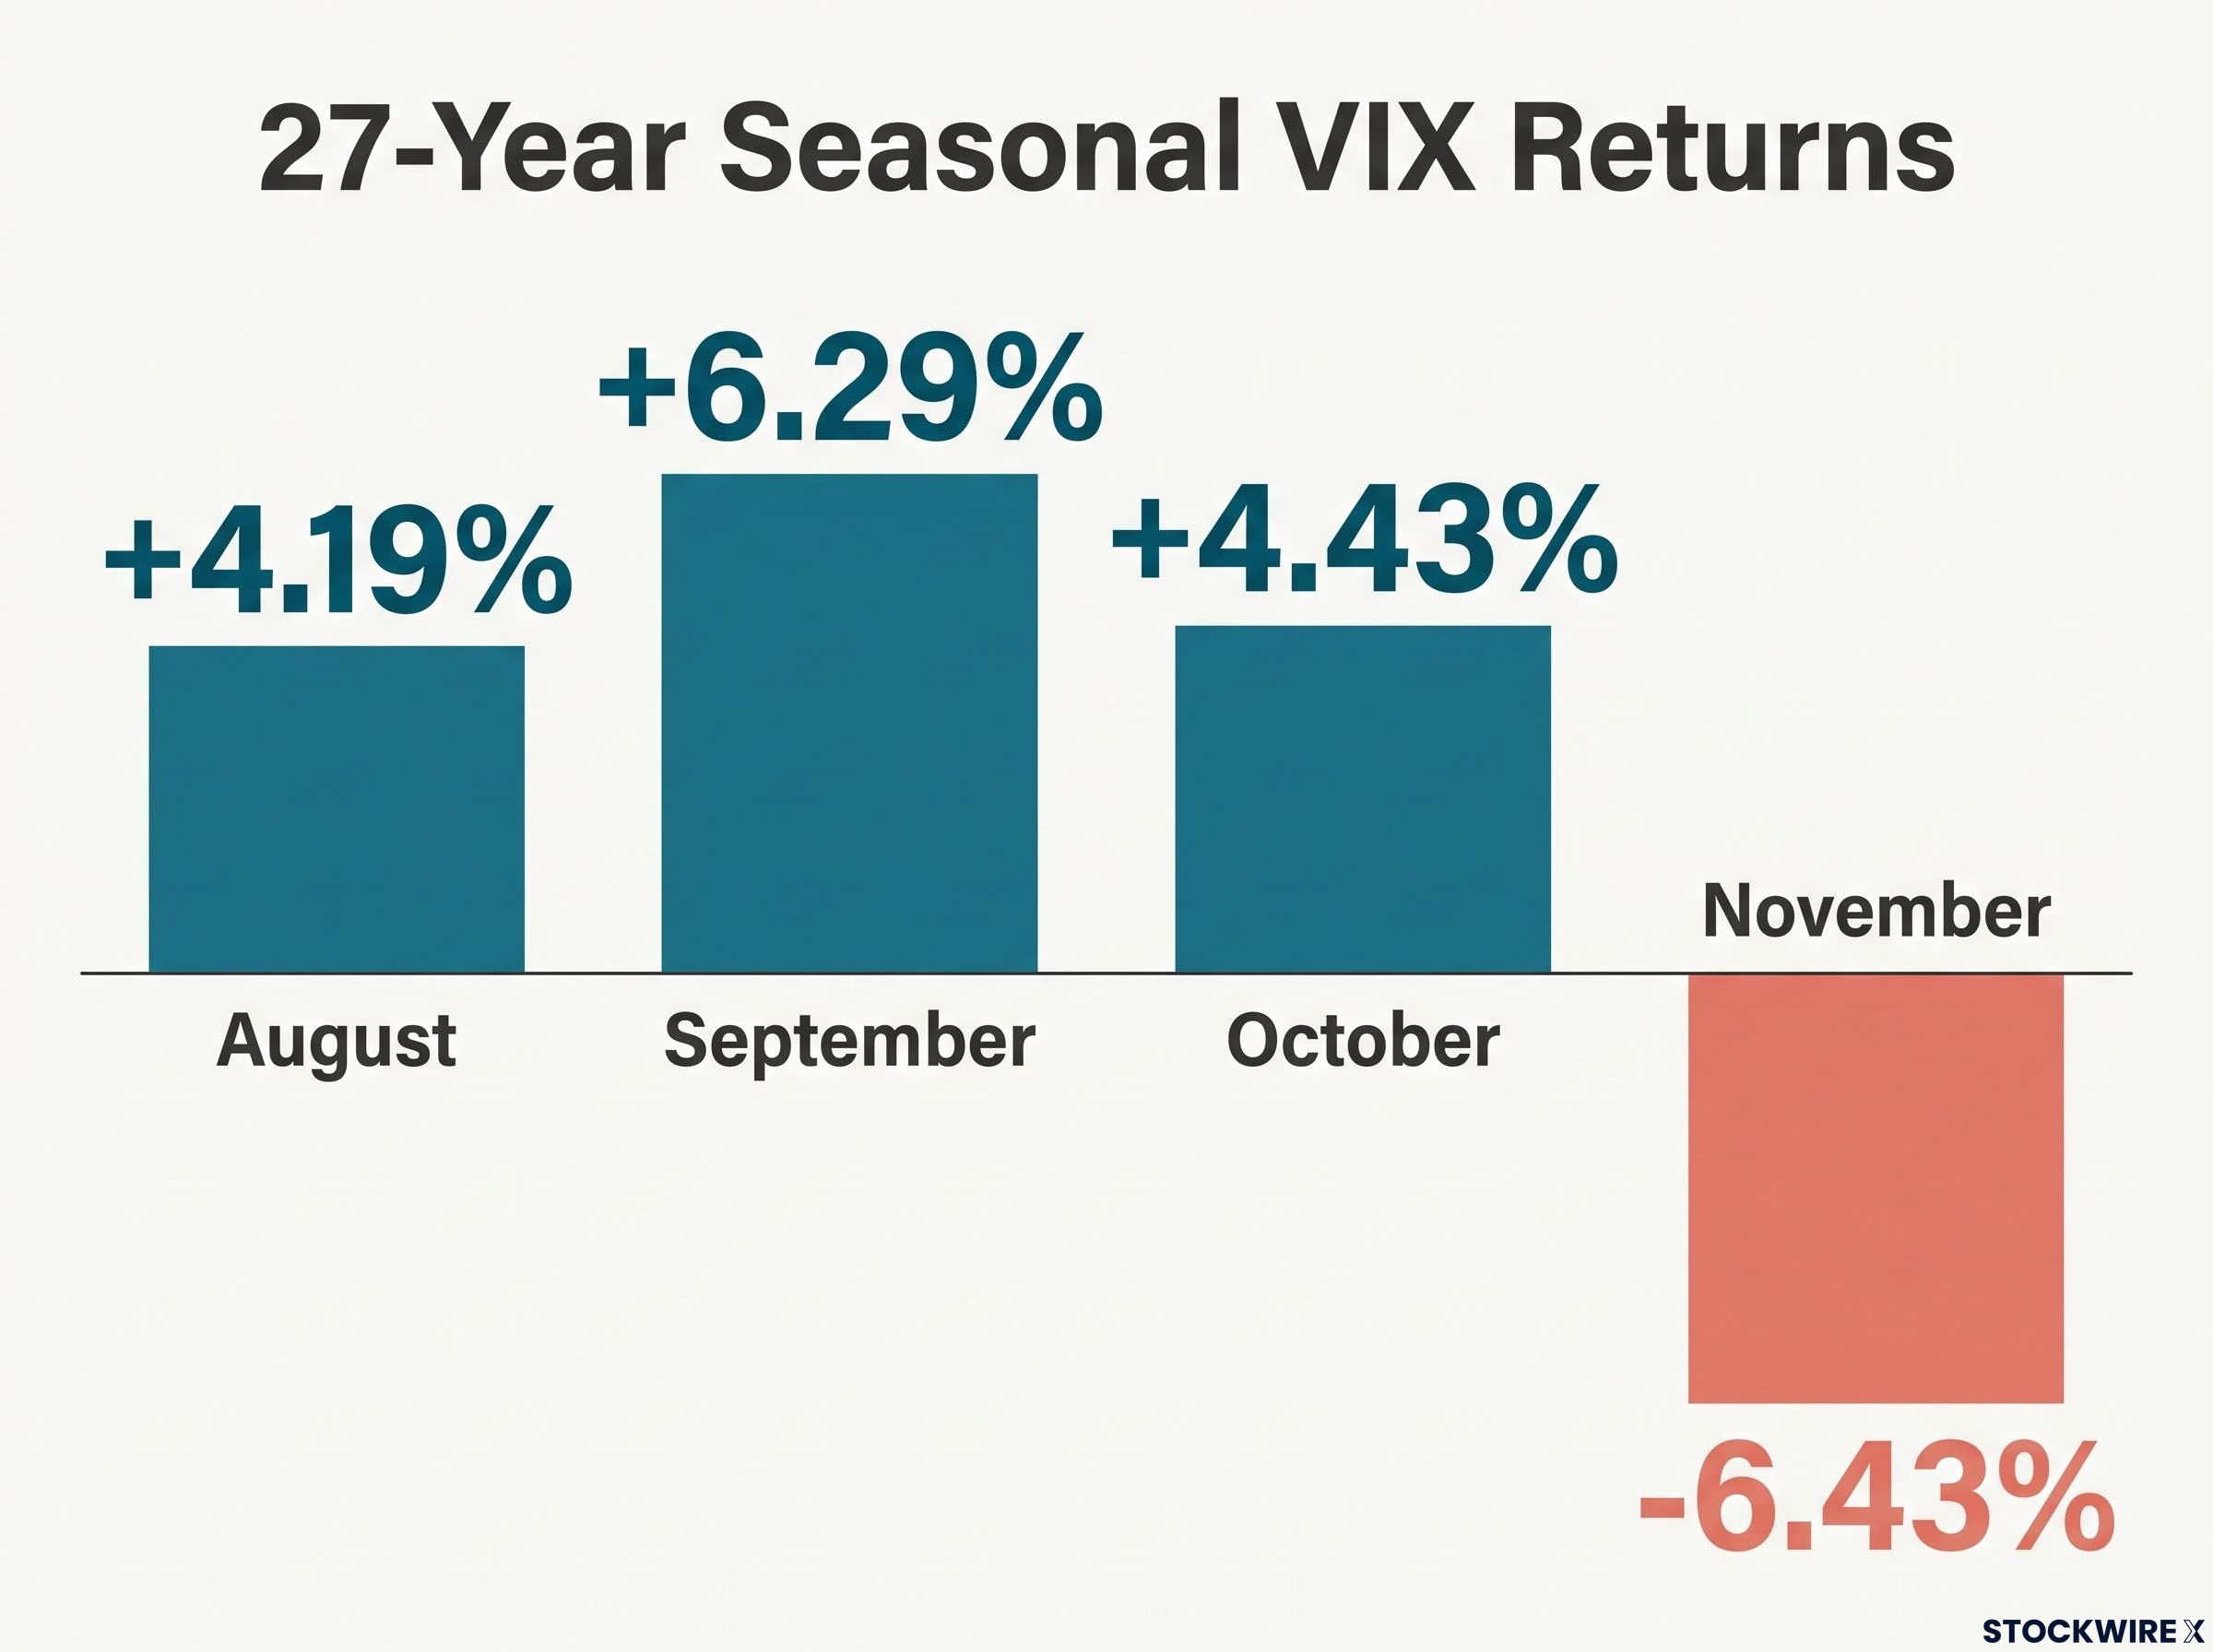
These are useful base rates for planning. They are not large numbers. A +6.29% move on a VIX starting at 14.5 translates to roughly one point of implied volatility. In any individual year, a single Federal Reserve statement or geopolitical shock can dwarf the entire seasonal effect in a single session.
A quantitative review at CXO Advisory finds limited evidence that the VIX is subject to a strong seasonal effect, concluding that the VIX “appears to defy consistent seasonality trends” compared with commodities that have obvious calendar-based drivers.
That finding does not erase the pattern visible in practitioner composites, but it does reinforce what the monthly averages already suggest: the signal-to-noise ratio is low. Seasonality is a probabilistic base rate, not a trading signal.
Beyond the seasonal composite, live derivatives markets are providing a parallel set of fall volatility signals: December SPX puts approximately 460-470 points out of the money are priced at roughly $12,000 versus $9,400 for equivalent calls, and VIX futures through year-end are clustered in the mid-20s despite a calm spot VIX, suggesting professional volatility markets have already begun pricing an elevated regime for the September-November window.
Why low VIX near all-time highs is the setup the seasonal pattern describes
There is a tension at the centre of the current market that the seasonal data helps clarify. Markets are calm. Indices are near records. And the historical composite says this is exactly where the average starts climbing.
The live market snapshot as of late August 2026:
- VIX: Mid-teens, approximately 14.4-14.8, following a decline from approximately 18-19 in late July.
- S&P 500: Around 7,700-7,725, roughly 1-2% below mid-August record highs near 7,800-7,816.
- QQQ: Approximately 4.5% below its early-June peak, showing mild relative weakness compared to SPY and DIA drawdowns of approximately 1.6-1.7%.
- Market character: Sideways range for approximately one month, a brief test near all-time highs followed by a pullback, no decisive breakout in either direction.
That combination, low implied volatility, indices near records, mild tech underperformance, and rangebound action, is precisely the pre-move environment observed in many historical years that preceded late-summer volatility increases. The original seasonal composite identifies this as the window where the average begins its sustained rise through approximately 7 October.
Inflection point versus trigger: an important distinction
The distinction matters. The historical composite shows where the average begins to slope upward. It does not describe a mechanical cause-and-effect relationship.
In some years, equities grind higher through volatile conditions. In others, the VIX rises without producing a decisive directional equity move. Rising VIX frequently accompanies equity drawdowns, but this is not a guaranteed linkage.
What the current setup tells you is narrower but more useful: if historical seasonal patterns play out, volatility protection is currently available at a price that may look inexpensive in retrospect. Options premiums near mid-summer VIX troughs have historically offered a cost-effective entry for defined-risk structures. Whether you act on that depends on your risk tolerance and time horizon, not on whether the seasonal pattern will repeat with precision this year.
How traders and portfolio managers navigate the seasonal volatility window
Knowing the seasonal tendency exists is one thing. Matching the right instrument to your actual situation is where the practical edge lives, and each available tool carries structural costs that matter as much as the directional thesis.
Four approaches, ordered from most tactically focused to most broadly defensive:
- Inverse ETFs: These products deliver the inverse of an index’s daily return and are widely available across major indices. The structural risk is path dependency: daily reset mechanics cause returns to diverge from the inverse of the underlying index’s cumulative return over longer holding periods. They are appropriate only for short-term tactical use, typically days rather than weeks.
- Options structures: Puts, put spreads, and volatility-based options trades are the standard professional tool for expressing a view on rising volatility. Low implied volatility at entry, the condition that currently prevails, makes defined-risk structures more cost-effective to initiate. This is where the seasonal timing thesis intersects most directly with instrument pricing.
Credit spreads represent one of the most structurally appropriate options tools for the current low-IV environment: because they are net premium buyers of volatility through the long put leg, entering at historically depressed implied volatility levels reduces the cost of the hedge while the defined-risk structure limits the exposure to premium decay if the seasonal rise fails to materialise.
- VIX futures and exchange-traded products (ETPs): VIX ETPs, including exchange-traded funds (ETFs) and exchange-traded notes (ETNs) linked to VIX futures indices, are structurally complex. In low-volatility environments, these products are typically subject to contango drag: the VIX futures curve is usually upward-sloping in calm conditions, meaning long VIX exposure loses value as near-term contracts roll into more expensive deferred contracts. Suitable only for experienced traders with a clear understanding of roll costs and term structure dynamics.
- Portfolio-level risk reduction: For longer-term investors, reducing overall equity exposure, increasing cash or defensive allocations, and ensuring adequate diversification are consistent with mainstream risk management during historically choppier windows. This approach acknowledges that seasonal windows are highly path-dependent and frequently driven by exogenous macro or geopolitical events rather than calendar mechanics alone.
| Instrument or approach | Key structural risk | Best-fit time horizon |
|---|---|---|
| Inverse ETFs | Path dependency and daily reset compounding | Days (short-term tactical only) |
| Options structures | Premium decay if volatility does not materialise | Weeks to months (defined-risk) |
| VIX futures and ETPs | Contango drag erodes long positions in calm markets | Days to weeks (experienced traders only) |
| Portfolio-level risk reduction | Opportunity cost if equities continue higher | Weeks to months (longer-term investors) |
Each instrument carries a different structural cost. Understanding that cost before entering a position is what separates a hedging strategy that works as intended from one that erodes capital even when the seasonal thesis plays out correctly.
What the data warrants, and what it does not
Three honest conclusions emerge from the evidence:
- The seasonal tendency is real and multi-decade corroborated. Independent analyses spanning 27 to 34 years of data converge on the same broadly U-shaped annual VIX arc, with the late-August-to-early-October window consistently elevated.
- The effect size is modest relative to macro events. Average monthly VIX increases of +4% to +6% are statistically meaningful but small in absolute terms. A single data release or geopolitical event can overwhelm the seasonal tendency in any given year.
- The current market setup matches the historical pre-move environment. Low VIX, indices near records, rangebound action, and mild tech underperformance are the observable conditions that have preceded the seasonal rise in many prior years.
What the data does not provide is a forecast of the direction or magnitude of this year’s outcome. The window running through approximately 7 October is a historically elevated period, and the November average of -6.43% suggests a defined endpoint. But two variables will actually determine whether the tendency plays out in 2026: exogenous macro or geopolitical developments, and whether the current rangebound equity action resolves with a breakout or breakdown.
The appropriate posture is planning around a base rate, not positioning on a forecast. The original seasonal composite was framed as probabilistic and data-driven rather than a directional call, and that is the framing the evidence supports.
A clear-eyed understanding of what seasonal data can and cannot tell you is itself an investment edge. It prevents both the overconfidence of treating a statistical tendency as certainty and the dismissiveness of ignoring a well-corroborated pattern entirely. The data gives you a planning framework for the next six weeks. What you do with it depends on your risk tolerance, your instruments, and your honesty about what any single year can deliver.
For readers wanting to frame the seasonal volatility window within a longer-term planning horizon, our full explainer on bear market recovery timelines documents how recovery duration from trough to prior all-time high has varied from under six months to 25 years across U.S. history, showing why the cause of a decline matters more than any single average when setting portfolio expectations.
This article is for informational purposes only and should not be considered financial advice. Investors should conduct their own research and consult with financial professionals before making investment decisions. Past performance does not guarantee future results. Financial projections and seasonal patterns are subject to market conditions and various risk factors.