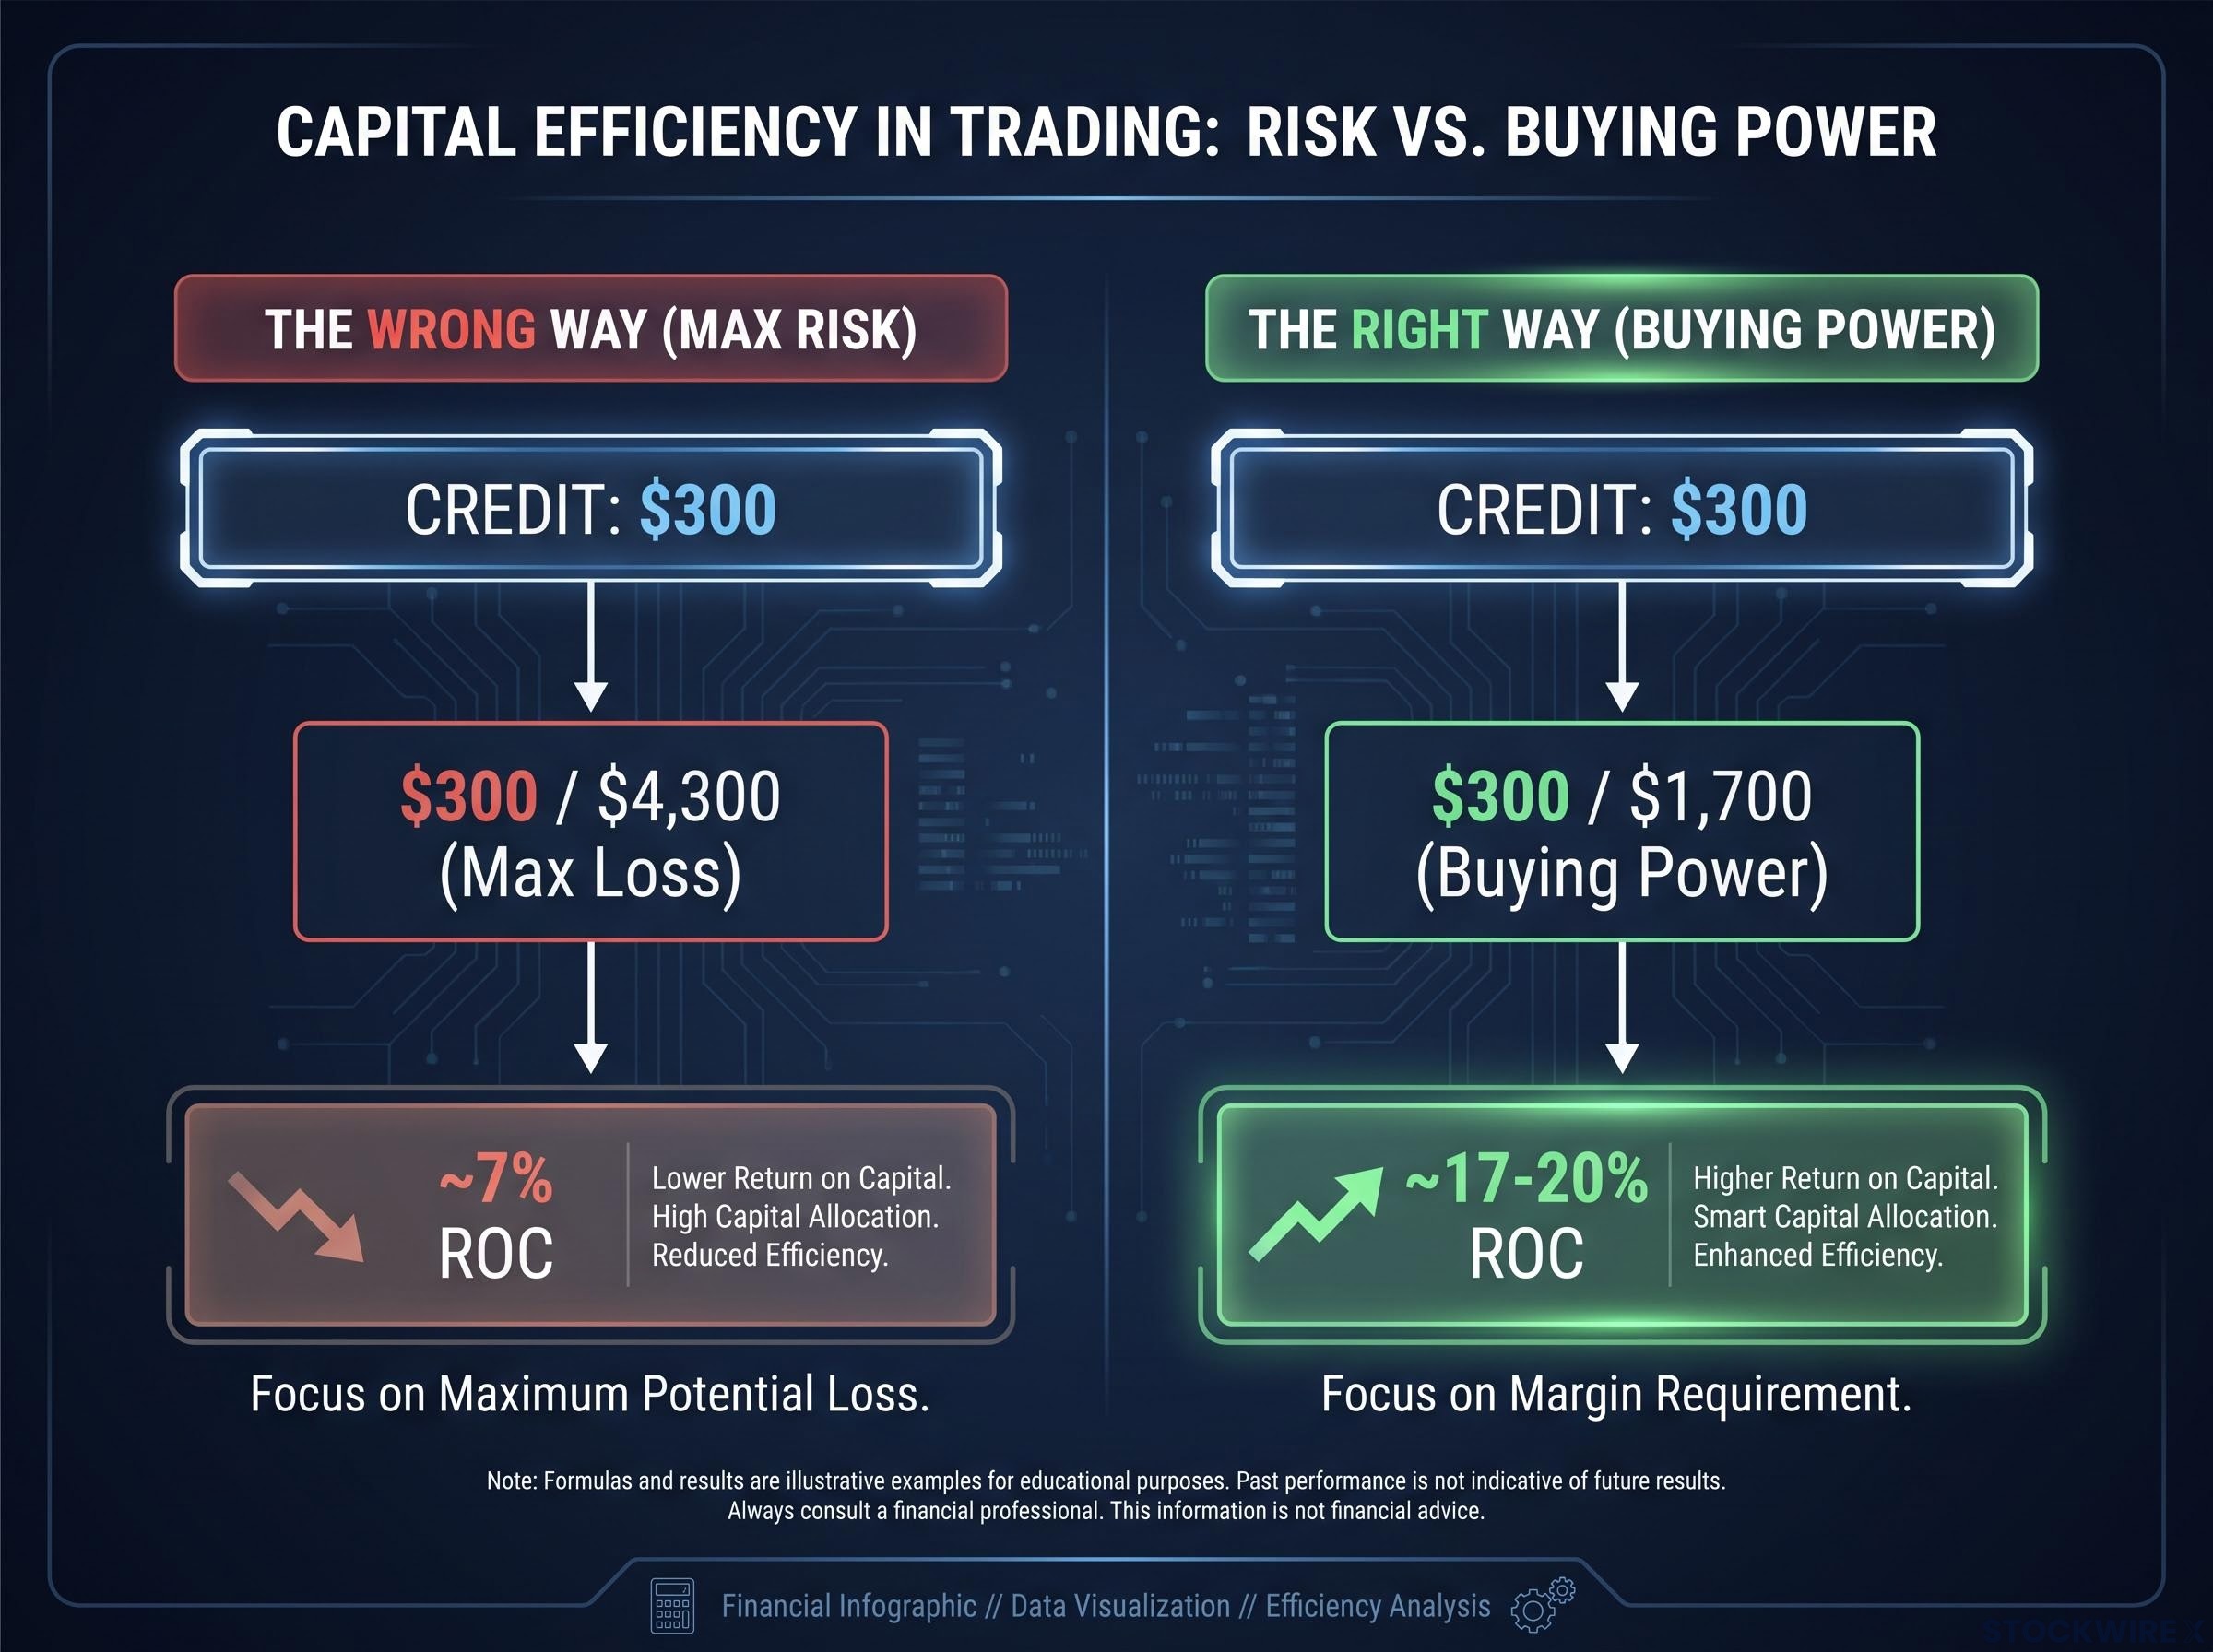
Here is the mistake almost every new options seller makes: they take the premium they collect, divide it by the maximum possible loss on the trade, and call that their return on capital. It feels rigorous. It is wrong.
Premium-selling strategies have exploded in popularity among self-directed traders, and for good reason. Selling puts, calls, and strangles can generate steady income when the setup is right. But the step that separates disciplined sellers from the rest is the quality filter, and that filter lives or dies on which number you put in the denominator.
Get the denominator wrong and you will pass on genuinely good trades while waving through marginal ones. That is not a rounding error. That is a broken screening process.
Here is the framework for evaluating whether a premium-selling trade clears the quality bar before you commit a single dollar of capital, built around the one metric that actually reflects what you give up to hold the position.
Why maximum risk is the wrong denominator for options sellers
Start with a naked put. Sell one on a stock, and your theoretical maximum loss is the stock falling all the way to zero. That is a real scenario. It is also an extreme one, and using it as your denominator distorts every comparison you try to make.
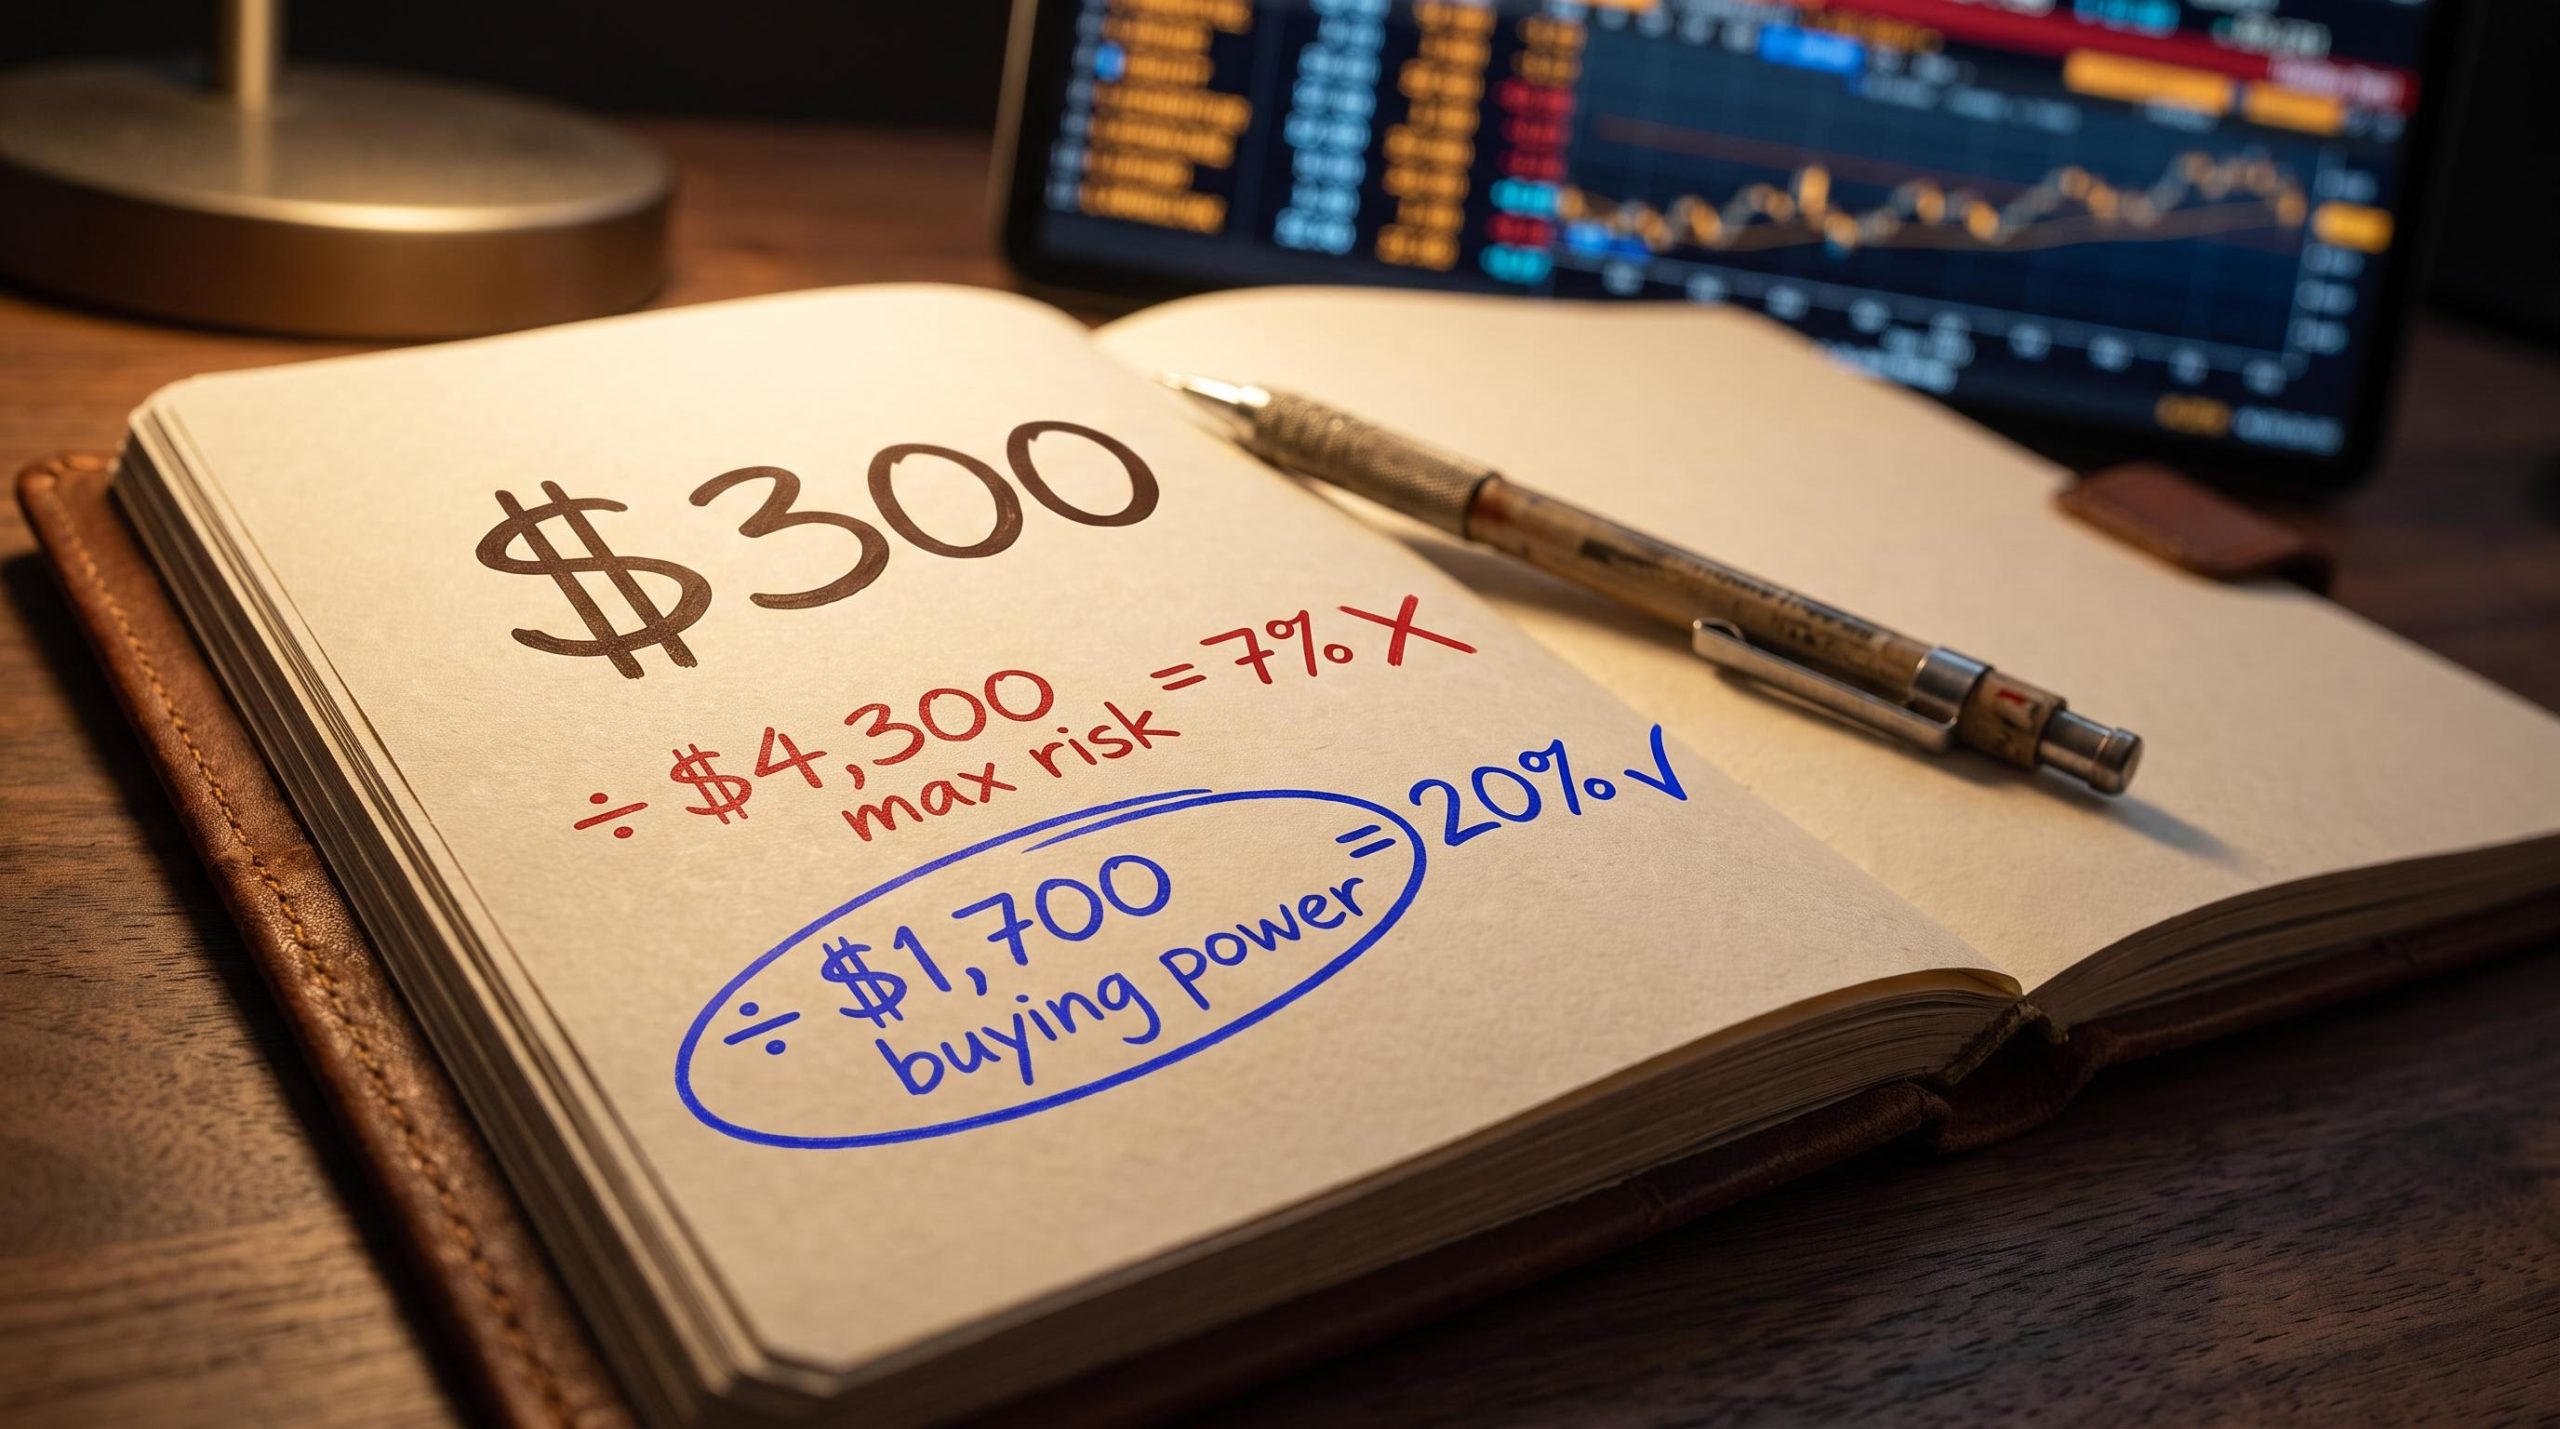
Say you collect $300 in premium on a trade with a theoretical max loss of $4,300. Divide the two and you get a return on capital of roughly 7%. That number looks weak. But it is measuring your credit against a doomsday event that your broker does not actually require you to fund up front.
What your broker does require is the buying power requirement: the collateral you must lock up to hold the position. That is the capital that leaves your account and cannot be used for anything else while the trade is open. It is the real, felt cost of the trade, and it is the only number that reflects what you are actually giving up.
The formula that matters
Return on capital for a short options trade is simple: the credit you collect divided by the buying power (margin) requirement to hold the position. That is the industry-standard framing across broker education, from Robinhood defining it as premium collected over collateral required, to the options guides that describe margin as the “real cost” of the trade.
| Denominator choice | Definition | What it reflects | Why it is used or not |
|---|---|---|---|
| Maximum risk | Theoretical worst case (stock to zero on a naked put) | An extreme scenario that rarely occurs | Not used: distorts quality comparisons between trades |
| Buying power requirement | Collateral the broker locks up to hold the position | The actual capital you commit and cannot use elsewhere | Used: it is the true liquidity cost of the trade |
This is not a technicality you can safely skip. Getting the denominator right is the prerequisite for every screening decision that follows, because the benchmark you are about to meet depends entirely on measuring your return against the capital you genuinely tie up.
When big ASX news breaks, our subscribers know first
What the 20% ROC threshold actually means and where it comes from
Once you are measuring credit against buying power, you need a bar to clear. A widely cited one is 20%: a trade that generates at least 20% of its buying power requirement in credit is considered acceptable for premium sellers using this framework. The same threshold applies whether you are selling puts, calls, or strangles.
That number is not arbitrary. It is tied directly to implied volatility, the market’s expectation of how much a stock will move. Products with implied volatility at or above 40-50% are generally where the math produces ROC at or above 20%. Higher volatility means richer premium, and richer premium is what lets a trade clear the bar. This makes IV level a prerequisite screen: check it before you even bother calculating ROC.
The entire ROC framework rests on one precondition: you need elevated premium to clear the 20% bar, and elevated premium comes only from elevated implied volatility basics, specifically how IV is extracted from live market prices and what a given reading actually means for the size of the credit you can collect.
Here is where you should be honest with yourself about what this benchmark is. Some educators apply it as a hard filter, no trade below 20%, full stop. Others push back. tastytrade founder Tom Sosnoff has cautioned that trades should not be managed on ROC alone.
Sosnoff has described ROC as “really misleading” when used in isolation, noting it can be “cherry-picked” to make a trade look better than it is.
That disagreement is not a flaw in the framework. It is the most useful thing in this section. It tells you ROC is a quality filter, not a guarantee, and it belongs alongside other screens rather than replacing them.
The complementary metrics you want running alongside the 20% check:
- IV Rank: tastytrade positions an IV Rank at or above 50 as the ideal entry point for short premium strategies. This is your primary screen, ahead of ROC.
- Probability of profit: the structural likelihood the trade finishes a winner, which trades off directly against ROC.
- An absolute ROC floor: for example, greater than 1.5% per trade, to stop short-dated options from producing inflated annualised figures that flatter the real risk.
That last point deserves attention. A short-dated trade can show a spectacular annualised ROC that has nothing to do with its actual risk profile. Annualising a nine-day trade into a headline percentage tells you almost nothing about what you are exposed to, which is exactly why some frameworks bolt on the absolute floor.
Understanding the calibration logic means you can adapt the threshold to your situation rather than following it blindly. The 20% figure stops being jargon and becomes something you can actually interrogate on every trade.
How to calculate ROC on a real trade and apply the 20% filter
Now run it the way you would in front of your screen. You are looking at a high-IV product, the order preview is open, and two numbers matter: the credit and the buying power requirement.
The sequence is short:
- Identify the credit collected from the option you are selling.
- Identify the buying power requirement from your broker’s order preview.
- Divide the credit by the buying power requirement.
- Compare the result to the 20% threshold.
Take an illustrative case on a high-IV Bitcoin ETF such as IBIT (treat these as representative figures for a high-volatility environment, not live quotes). Sell an at-the-money put and you might collect roughly $300 in credit against a buying power requirement of about $1,700. Divide the two and you land around 17-20% ROC, right at the edge of the bar.
Switch strategies on the same underlying and the picture changes. A strangle might bring in around $2.60 in credit against roughly $1,200 in buying power, pushing the ROC just above the 20% threshold. Same ticker, different capital structure, different result.
| Strategy | Credit collected | Buying power required | ROC result | Meets 20% threshold |
|---|---|---|---|---|
| Short put | ~$300 | ~$1,700 | ~17-20% | Borderline |
| Strangle | ~$260 | ~$1,200 | Just above 20% | Yes |
| Defined-risk debit spread | Pays a debit | Debit paid = max loss | Structurally different | Different calculation |
The defined-risk case works differently. On a 44/46 call debit spread with a maximum loss of $83 (the debit you pay) and a maximum profit of $120, your buying power reduction equals the debit itself. Here, max loss and capital at risk are the same number, so the ROC calculation is structured around that debit rather than a margin formula.
Credit spread construction changes the ROC calculation fundamentally because max loss and buying power become the same number, collapsing the denominator ambiguity that complicates naked put and strangle analysis and making the capital efficiency comparison between strategies more direct.
How the broker’s margin formula sets your denominator
The buying power figure is not a black box. For an uncovered short call or put, tastytrade calculates the requirement as the greatest of three figures, then multiplies by the 100-share contract multiplier:
- 20% of the underlying price, minus the out-of-the-money amount, plus the premium.
- 10% of the underlying price, plus the premium.
- $2.50 per share as a floor.
Your broker takes whichever of those three is largest and shows it as the buying power reduction in your order preview before you place the trade. Interactive Brokers applies a similar Reg T end-of-day approach.
FINRA Rule 4210 establishes the official margin requirements that U.S. brokers must apply to uncovered options positions, including the minimum equity thresholds and the percentage-of-underlying calculations that feed directly into the buying power figure your broker displays in the order preview.
Strangles are not simply additive. The margin is the greater of the two legs’ requirements, plus the premium of the other leg. That is why a strangle can be more capital-efficient than you would expect.
The point is this: because the formula is knowable, ROC is calculable in advance. You can estimate your denominator before you commit, which means quality screening happens at entry, not in hindsight.
When the 20% rule breaks down and what to do instead
A filter is only as good as your awareness of where it fails. The 20% rule has three structural failure modes, and knowing them makes you a sharper user of the framework, not a reason to abandon it.
- Low-IV environments: when volatility is depressed, no quality product may clear 20%. Insisting on it forces you into inactivity or, worse, into marginal high-risk underlyings to chase yield.
- High-IV leveraged products: heavily leveraged tickers can show a huge ROC because premium is enormous, but the extreme volatility carries tail risk the ROC number never captures.
- Margin expansion: broker requirements move with price and volatility. The buying power that justified your trade on entry can balloon mid-trade, changing the capital picture entirely.
Take the low-IV problem first. With an IV Rank below 20, meeting a 20% ROC minimum usually means taking on disproportionate risk. That is the opposite of what the framework is for.
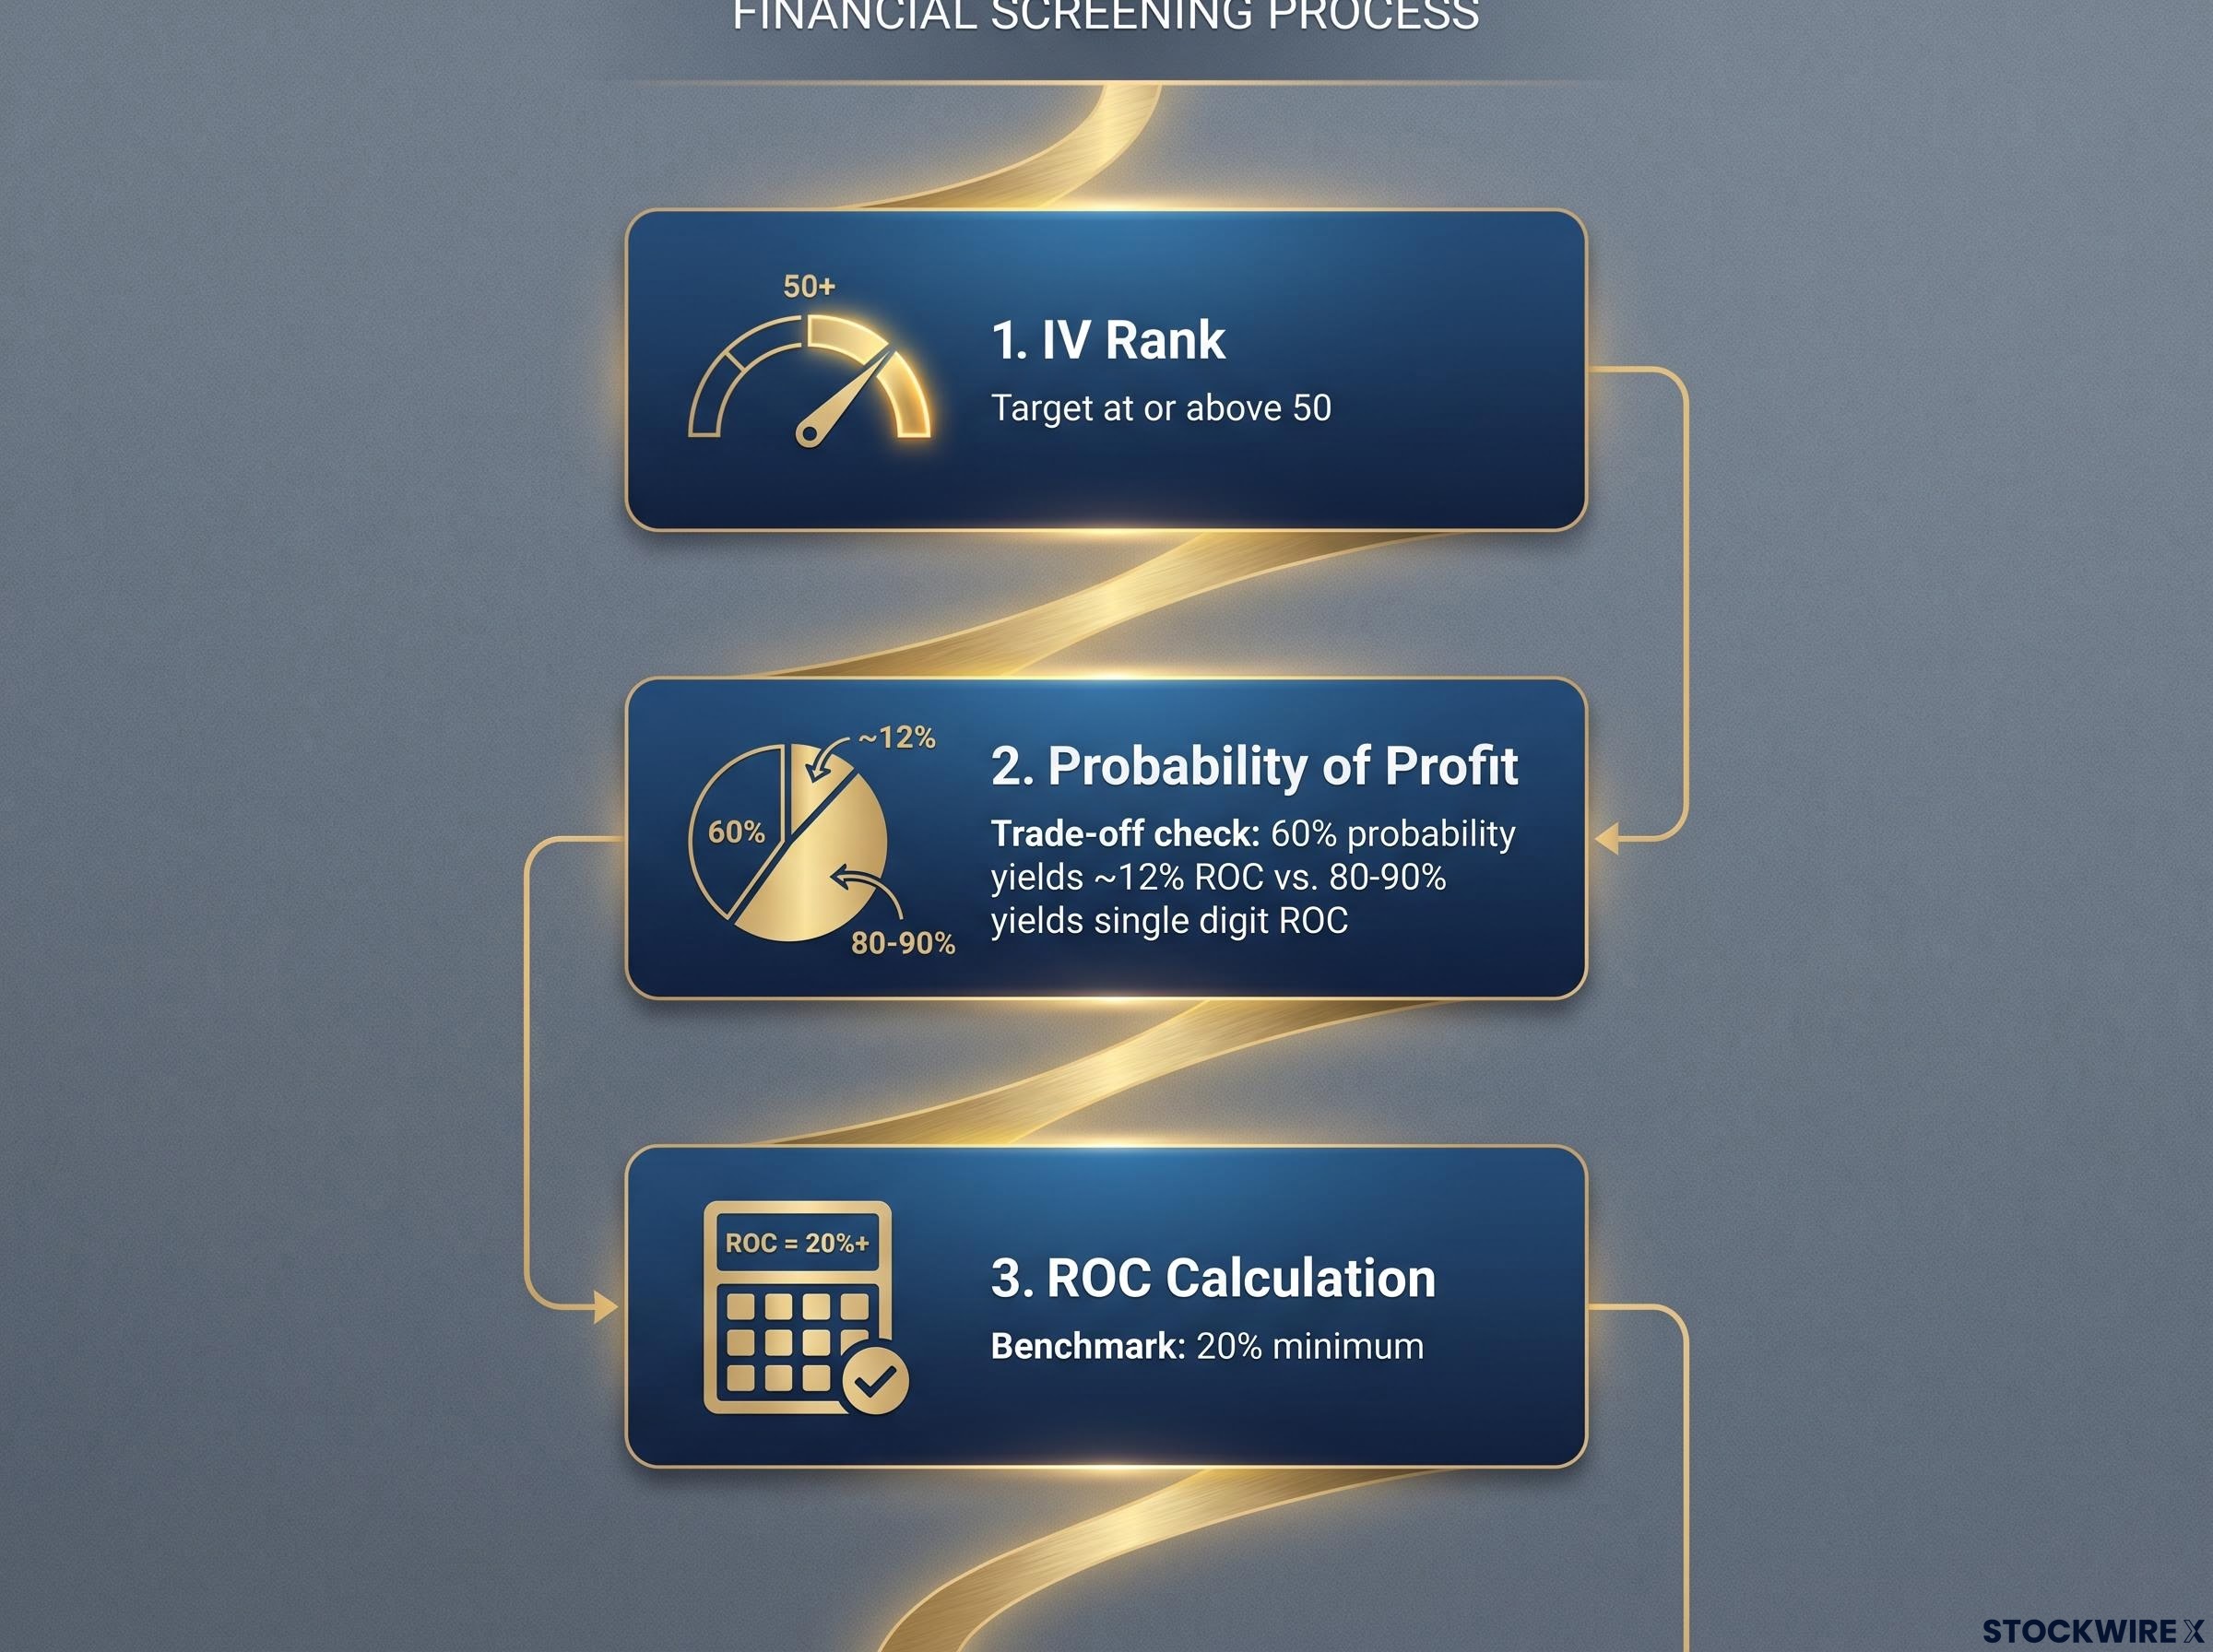
The probability trade-off matters just as much. At roughly 60% probability of profit, ROC tends to sit around 12%. Push probability of profit up to 80-90% and ROC drops into single digits. Higher safety and higher ROC pull against each other, so you cannot maximise both.
An 11-year backtest of mechanical credit spreads allocating 25% of capital produced negative total returns, with drawdowns ranging from 56% to 93%. Trades optimised purely for ROC metrics failed severely when they ran into unfavourable volatility regimes.
That figure is the strongest argument against treating ROC as a standalone signal. The lesson is not that ROC is useless. It is that ROC without volatility-regime awareness can destroy an account over a long horizon.
Tail risk in calm markets is precisely where the 20% ROC filter offers false comfort: with roughly $1.5 trillion in short-volatility exposure outstanding, the forced simultaneous unwind that dealers trigger during a sharp gap move can render any pre-trade margin estimate obsolete within hours.
Building a screening sequence that uses ROC responsibly
The mature version of the framework treats ROC as one input in an ordered checklist:
- IV Rank first. Only run the ROC calculation after IV Rank clears a minimum, with tastytrade’s guidance pointing to IV Rank at or above 50 as the ideal zone.
- Probability of profit second. Cross-check the trade’s likelihood of success, remembering that higher ROC generally means lower probability.
- ROC third. Once volatility and probability are acceptable, ROC confirms whether the credit is worth the capital committed.
Knowing when the conditions that make ROC reliable are present, versus absent, is what separates a systematic trader from someone chasing numbers.
What this framework gives you before you place the trade
You now have a portable pre-trade checklist rather than a scattering of separate rules. The value is in the sequence and the discipline, not in any single figure.
Run it in order every time. Check IV Rank first to confirm the volatility environment supports the strategy. Confirm probability of profit second, accepting the trade-off between safety and return. Then calculate ROC last: credit collected divided by buying power requirement, with 20% as your benchmark for acceptability.
Keep the annualisation caveat in mind. If you annualise ROC to compare trades of different durations, pair it with an absolute per-trade floor so short-dated options do not flatter their own numbers.
Remember what this framework is built for. It works best in elevated volatility environments. When IV is low, the right response is to reduce position size or wait, not to quietly lower the bar to force a trade.
Your practical next step is simple: pull two or three high-IV names from your watchlist, open a near-term expiration, and run the ROC calculation to see whether the threshold is met. Applied consistently, this sequence does not try to predict winners. It filters for trades where the odds, the volatility environment, and the capital efficiency all line up before you commit.
For investors wanting to stress-test the ROC framework against a multi-decade dataset, our deep-dive into long-run premium selling returns examines 19 years of Cboe put-write index data and quantifies exactly how much the smoother ride costs in compounded terminal wealth.
This article is for informational purposes only and should not be considered financial advice. Investors should conduct their own research and consult with financial professionals before making investment decisions. Past performance does not guarantee future results, and options trading carries substantial risk.