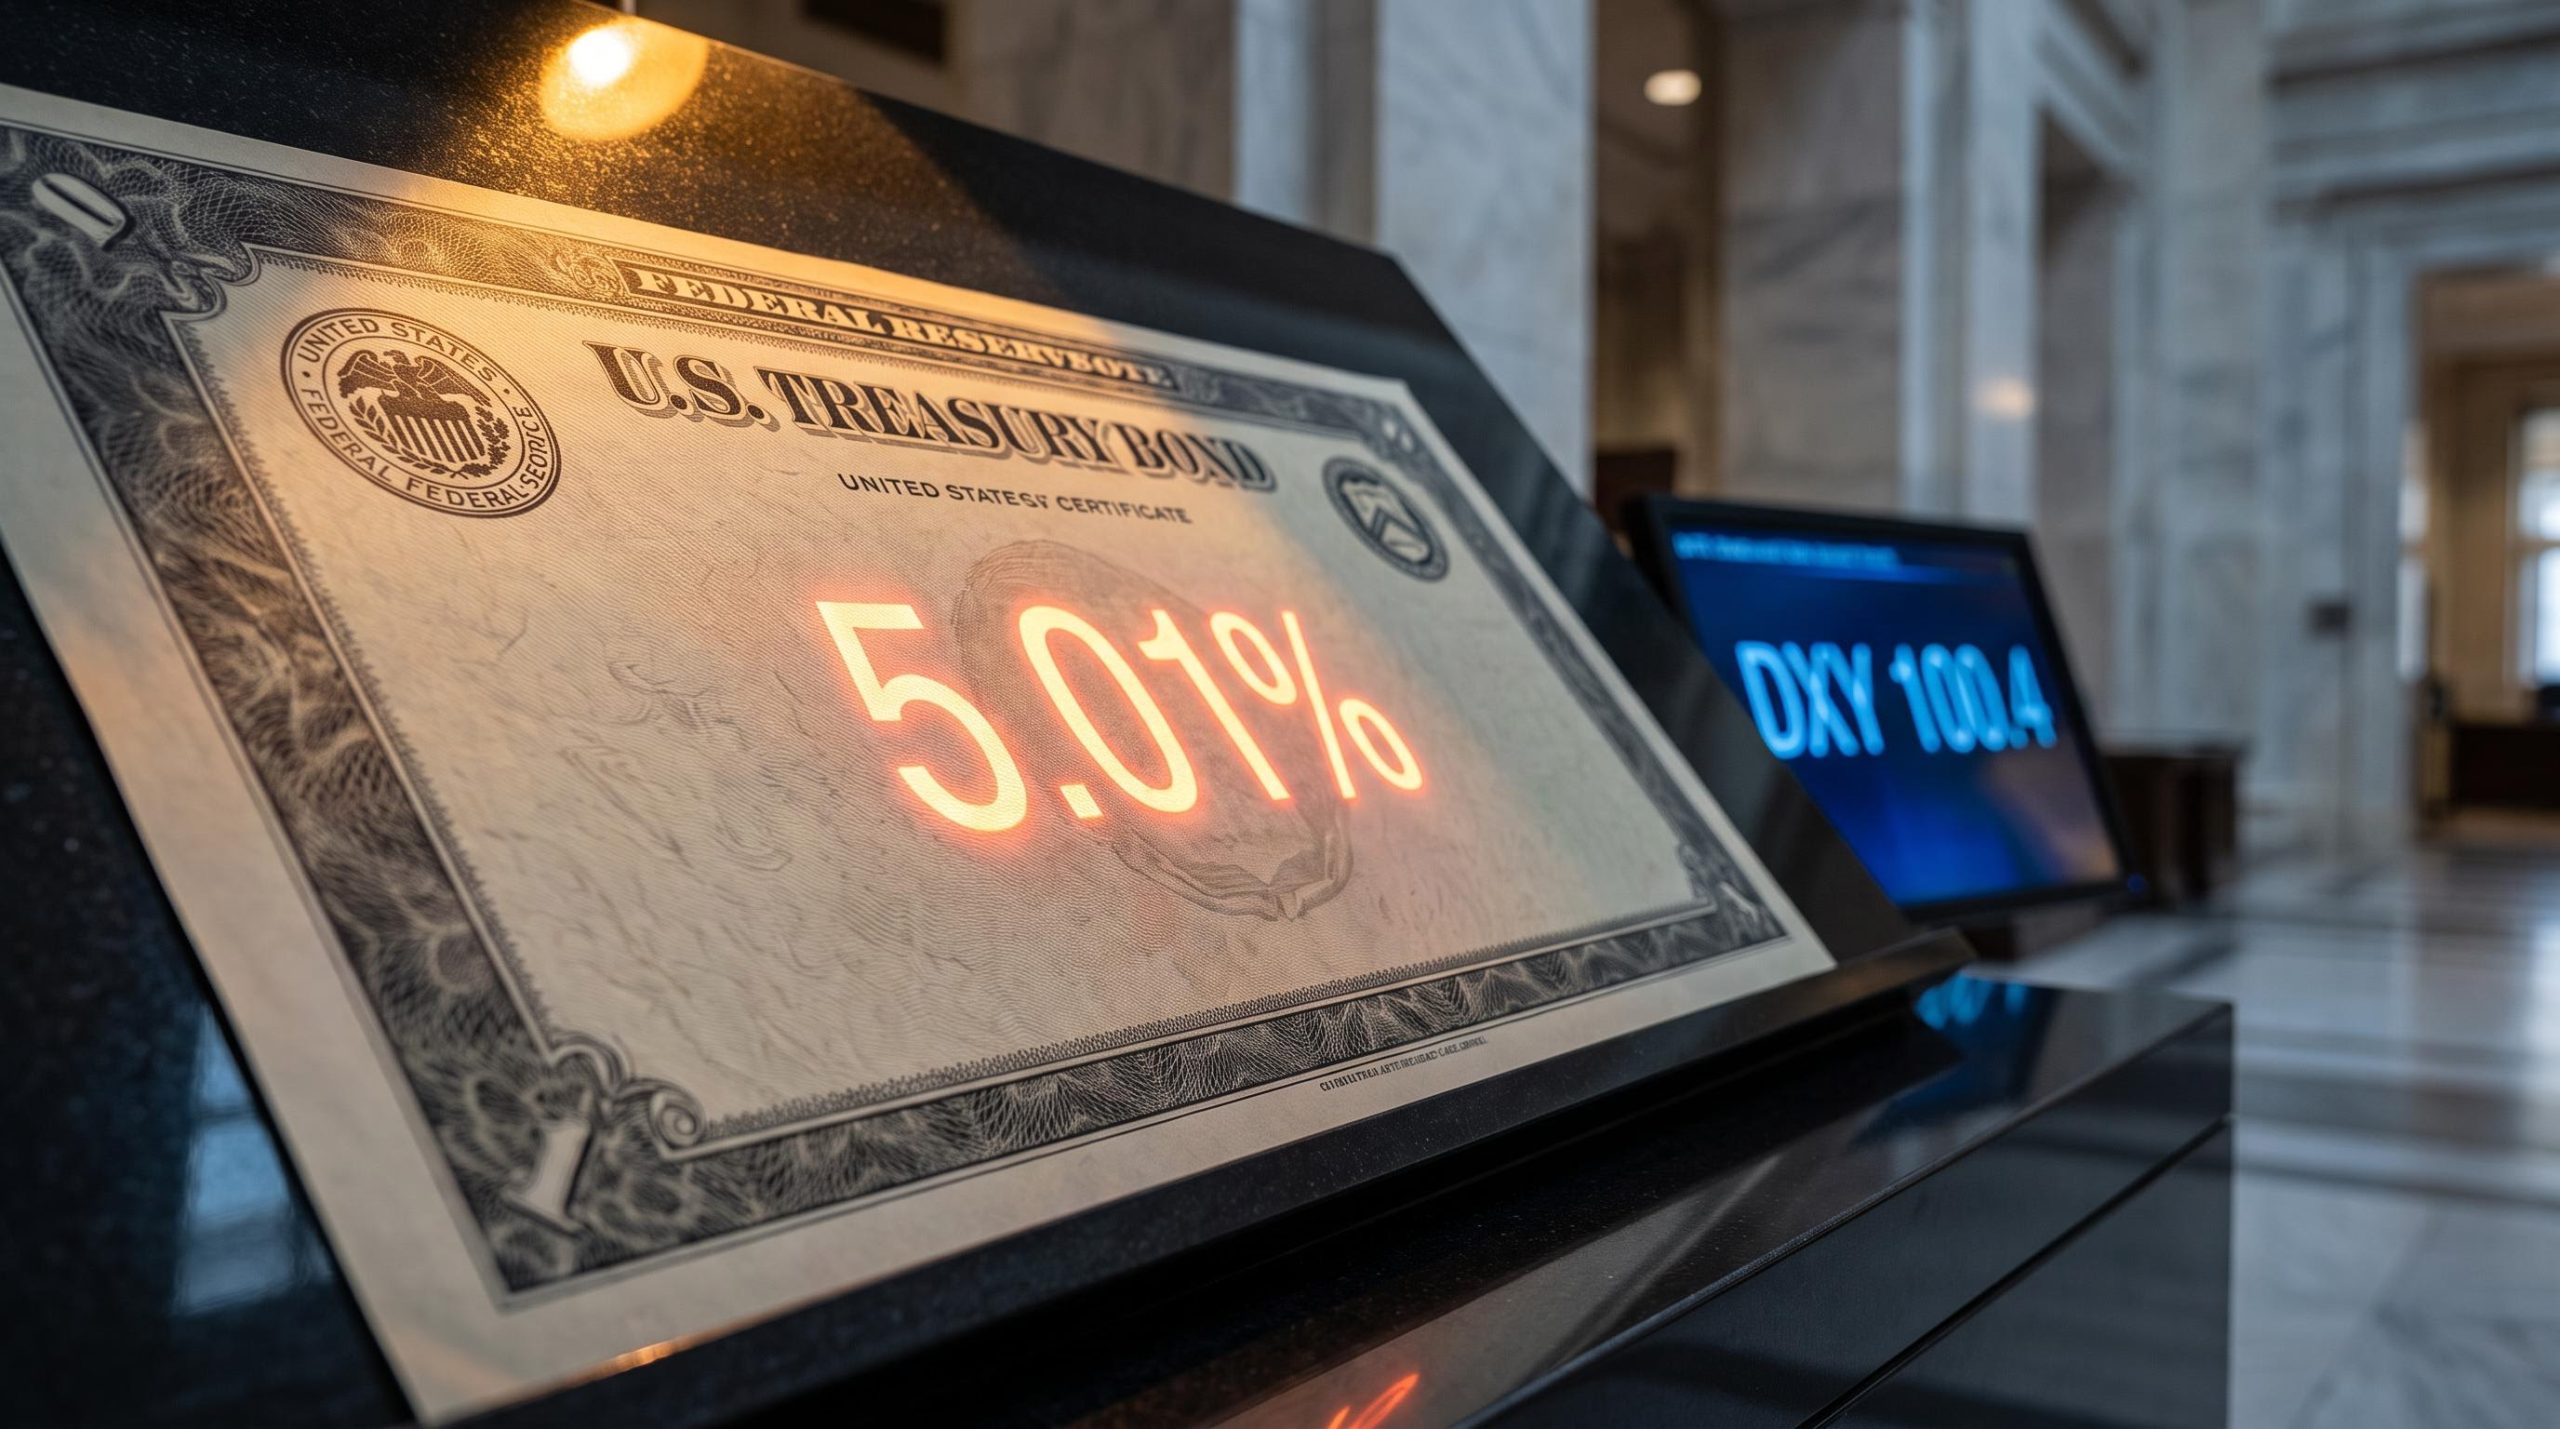
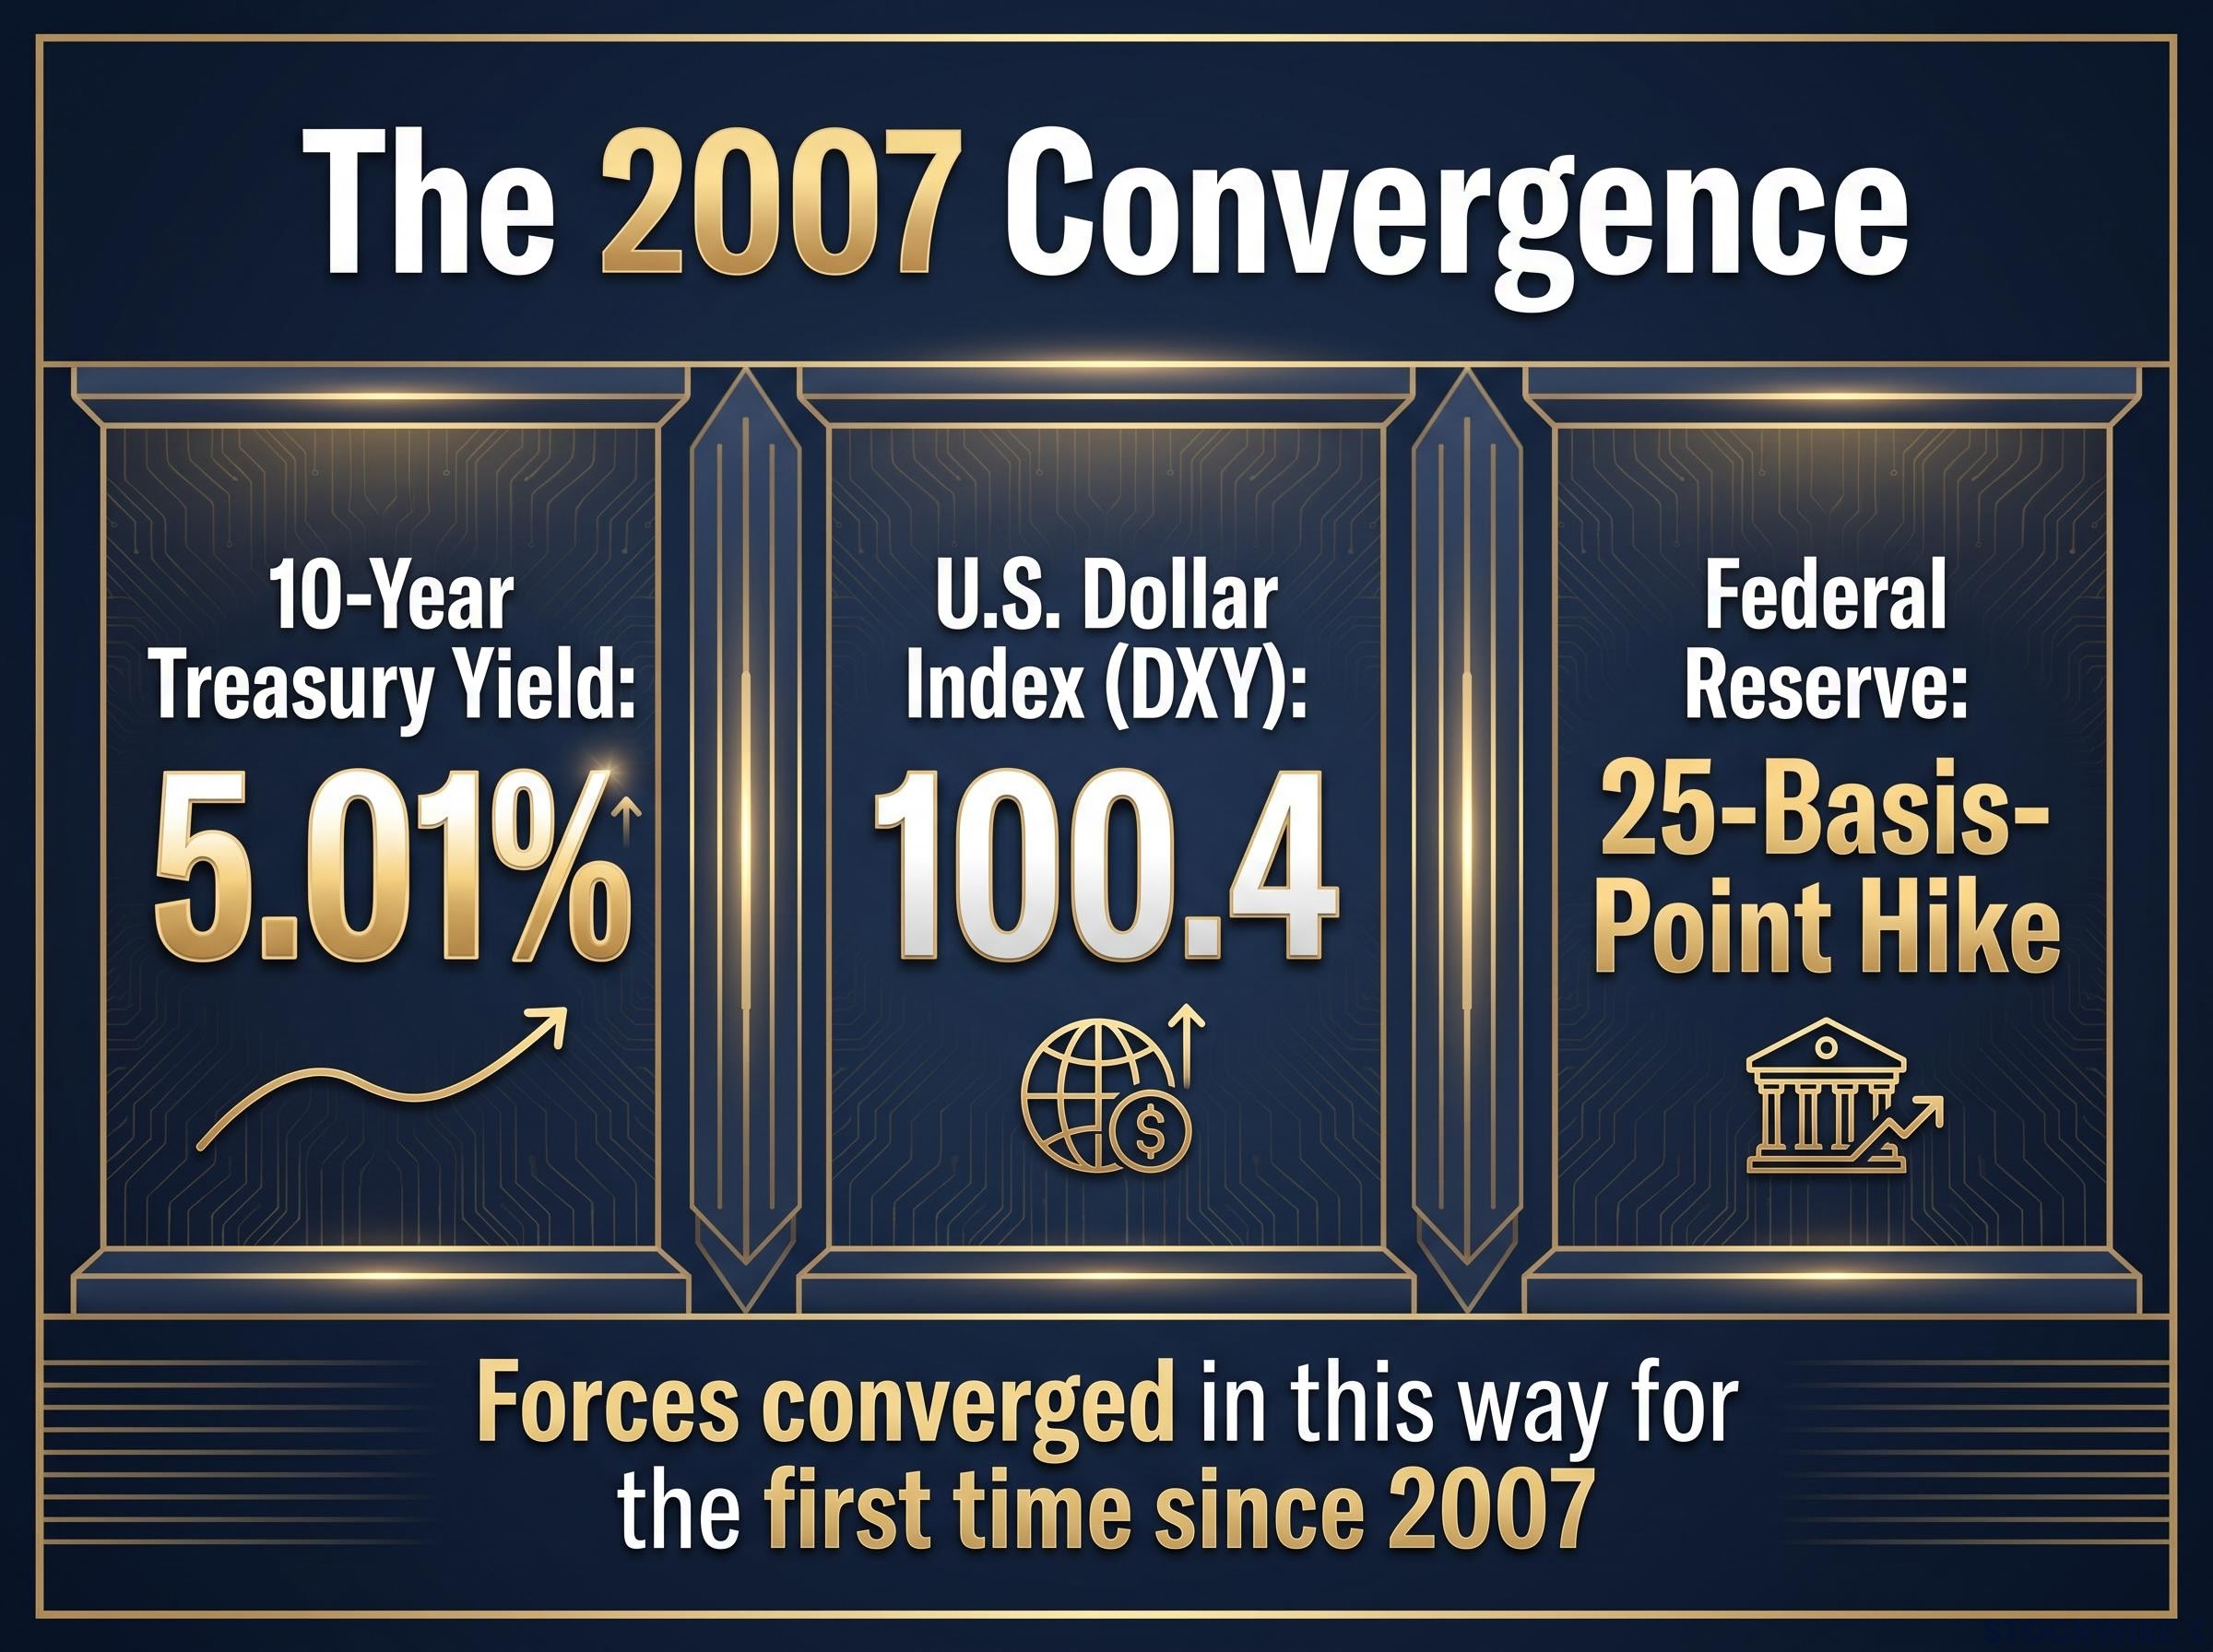
Three of the most consequential numbers in American finance landed inside the same five-day window. The 10-year Treasury yield touched 5.01%, the U.S. Dollar Index (DXY) climbed to roughly 100.4 and up 1.3% on the week, and the Federal Reserve delivered a fresh 25-basis-point hike. The last time yields, a rising dollar, and a Fed raising rates converged this way was 2007.
For investors who entered 2026 expecting rate cuts, the picture has inverted. The Fed is tightening, the dollar sits at multi-week highs, and the benchmark 10-year yield has crossed a threshold last seen in the pre-financial-crisis era. An energy shock out of the Middle East is making the Fed’s next move harder to read, not clearer.
Here is what each of these three forces does to your portfolio, and which analyst interpretations deserve the most weight heading into the week of 22 September 2026, when eight scheduled Fed appearances begin. Read separately, each number is a headline. Read together, they describe a tightening regime that changes the math on nearly everything you hold.
Why breaching 5% on the 10-year is not just a round-number story
The 5% level on the 10-year Treasury gets treated as a psychological marker. The more useful way to see it is as a valuation input that quietly rewrites the price a rational buyer should pay for equities.
Here is the mechanism. Stock prices reflect the present value of future corporate earnings, and that value is calculated by discounting those earnings back to today using a rate anchored to the risk-free Treasury yield. When the yield rises, the discount rate rises, and the present value of those future profits falls. Long-duration growth and technology stocks, whose value sits mostly in earnings years away, take the sharpest hit.
The discount-rate channel works mechanically: the IMF estimated that a 100 basis point increase in global long-term real rates lowers the equilibrium price-to-earnings ratio of advanced-economy indices by 10-15%, holding earnings constant, which means the repricing at 5% yields is already mathematically in motion regardless of whether corporate profits disappoint.
Then there is the competition problem. When a risk-free government bond pays 5%, the extra return investors demand for holding riskier equities, the equity risk premium, compresses. Capital that once had no alternative to stocks now has one that pays 5% for taking almost no risk.
The current readings confirm the threshold has been crossed rather than merely tested. TradingEconomics and YCharts placed the 10-year at 5.00%-5.01% on 18 September 2026, Bloomberg recorded an intraday high of 5.04% on 15 September, the highest since 2007. FRED’s official constant-maturity series read 4.94% on 17 September, a gap that reflects publication lag rather than a contradictory signal.
The FRED 10-year Treasury constant maturity series provides the government-backed benchmark against which all other yield readings are calibrated, and its official publication lag explains why the 4.94% figure on 17 September sits below the intraday Bloomberg high without contradicting it.
The threshold to watch Ruchir Sharma of Breakout Capital points to historical data showing that yields above roughly 5.25% correspond with falling equity prices, as the correlation between bonds and stocks turns positive and diversification stops working. At 5.01%, that trigger is within striking distance.
John Higgins of Capital Economics argues that while 5% is not a magic number, yields at this level pose real risks to both equity valuations and the sustainability of U.S. public finances. Billy Leung of Global X ETFs adds a credit angle: a sustained 10-year above 5% exposes heavily indebted companies rolling over debt raised at 2-3% into refinancing rates of 6-8%.
Three asset categories feel this most directly:
- Growth equities, through the discount-rate channel that punishes long-dated earnings hardest
- Commercial real estate, through the refinancing channel as cheap debt matures into expensive debt
- Housing, through the mortgage benchmark channel, since the 10-year sets the base for mortgage pricing
If you hold growth stocks or carry variable-rate debt, you are already feeling the downstream effect whether or not you have watched the yield tick higher.
The fiscal dimension: what 5% yields mean for government borrowing
The 10-year is also the benchmark against which the U.S. government refinances its debt stock, which turns elevated yields into a fiscal concern rather than just a market one. Both the Washington Post and CNN have flagged renewed worries about U.S. debt sustainability at this level, precisely because the yield sets borrowing costs across the entire economy. Higher for longer at the Treasury level means a heavier interest burden feeding through to everything downstream.
When big ASX news breaks, our subscribers know first
How the dollar’s four-month-best week transmits into corporate earnings and global credit
The dollar’s rally is easy to file as a currency headline. It is more accurately a transmission mechanism, a single force that moves from the foreign exchange market into S&P 500 earnings and out into emerging market credit conditions.
TradingEconomics put DXY at approximately 100.4 on 18 September 2026, its highest in roughly six weeks, with the index up nearly 1.3% on the week. CNBC recorded it around 100.23 on 17 September, up about 1.4% over seven days. Either way, this ranks as the dollar’s strongest five-day performance in four months, and it is policy-driven, tied directly to expectations of further Fed tightening rather than a random currency swing.
The first link in the chain runs into corporate earnings. Morgan Stanley’s Mike Wilson estimates that every 1% move in DXY translates into roughly a negative 0.5% impact on S&P 500 earnings, as a stronger dollar shrinks the dollar value of overseas sales for U.S. multinationals.
The earnings sensitivity to track Morgan Stanley’s Mike Wilson: every 1% change in the dollar index equals approximately a negative 0.5% hit to S&P 500 earnings per share.
Apply that to the current 1.3% weekly gain, and the drag on S&P 500 earnings compounds the headwind from the higher discount rate covered in the previous section. If you hold multinational or international equities, you face both effects at once: the same Fed-driven rate expectations pushing the 10-year to 5% are simultaneously feeding the dollar rally that Wilson’s model turns into negative earnings revisions.
S&P 500 earnings revisions heading into the back half of 2026 carry a complication the headline growth rate obscures: approximately 20 percentage points of Q2’s reported 50.6% expansion traced to non-recurring mark-to-market gains at just two companies, meaning the operationally relevant growth baseline sits closer to 30-32% and will decelerate visibly in Q3 and Q4 as those one-time items roll off.
The chain extends further, into global credit. Cambridge Associates warns that a stronger dollar makes dollar-denominated emerging market debt harder to service, historically triggering capital outflows and wider credit spreads. S&P Global Ratings notes that dollar strength has historically compounded rises in Asian dollar bond yields, and RBC Wealth Management observes that strong-dollar cycles typically coincide with underperformance of non-U.S. equities and EM assets.
| Transmission channel | Mechanism | Data point or estimate |
|---|---|---|
| Equity earnings | Stronger dollar shrinks the dollar value of overseas sales, cutting EPS | Approximately -0.5% S&P 500 EPS per 1% DXY move (Morgan Stanley / Mike Wilson) |
| Domestic credit | Dollar appreciation reduces U.S. bank lending capacity | Associated with a reduction in commercial and industrial loan supply (Federal Reserve Bank of San Francisco) |
| EM credit | Dollar strength raises dollar-denominated debt servicing costs | Historically triggers capital outflows and wider credit spreads (Cambridge Associates) |
The read for you is that the dollar is not an isolated event to note and move past. It is the second arm of the same tightening squeeze, and it argues for reviewing currency hedging or international sector exposure before eight Fed speakers add fresh volatility.
Inside the Fed’s divisions: what 16 of 18 policymakers agreeing on a hike actually means
A dot plot showing 16 of 18 policymakers expecting more tightening looks like settled consensus. Look closer, and it is a live analytical contest, which is exactly why eight speaker appearances next week carry genuine information value.
The anchor is the 16 September 2026 FOMC decision. The Fed raised the funds target range by 25 basis points to 3.75%-4.00%, its first hike since 2023. The median participant now projects a year-end rate of 4.1%, implying at least one more increase, and 16 of 18 participants see at least one further hike, with four projecting two more and only two expecting no further moves.
Chair Kevin Warsh went further than the projections in his press conference.
The most market-consequential language in play Chair Kevin Warsh characterised current financial conditions as “not particularly restrictive” at the 16 September press conference, adding there “could be more tightening ahead.”
That framing is the pivot point. Whether regional Fed voices reinforce or walk back “not particularly restrictive” over the next week is what determines whether a December hike is live or merely theoretical.
Hawkish camp: why more hikes are analytically justified
The case for further tightening is coherent, not fringe dissent:
- KPMG’s “Inflation Forces the Fed’s Hand” report projects three hikes in total this cycle, citing sticky inflation and energy-driven price pressure
- UBS’s Chief Investment Office forecasts two hikes in 2026, September and December, taking the range to 4.00%-4.25%
- Chair Warsh’s “not particularly restrictive” language signals appetite for more, reinforced at Jackson Hole on 28 August 2026, where he called progress on inflation “insufficient”
The 16 of 18 alignment in the dot plot represents an unusually strong internal consensus for further action, not a close call.
The Fed’s September dot plot projections show that the 16-of-18 alignment is not a marginal result but an unusually strong internal consensus, with the median year-end rate path implying continued willingness to act if energy-driven inflation persists beyond the next two meetings.
Cautionary camp: the supply-shock overtightening argument
The counterweight carries equal analytical weight:
- J.P. Morgan Private Bank, in a 18 May 2026 note, argues current inflation is supply-driven, expectations are well anchored, and there is no evidence of a wage-price spiral, so hiking risks overreacting to transitory pressure
- A Reuters poll conducted 4-9 September found a majority of economists expected no further hikes in 2026, before the September decision reset the landscape
- Investing.com contends the September decision was not more hawkish than expected, and that markets may be overinterpreting the dot plot
For positioning ahead of next week, the question is not whether another hike is coming but whether Warsh’s characterisation holds. Each of the eight appearances carries the potential to shift the market’s December hike probability, and with it, bond and equity positioning.
For investors trying to rebuild their rate-expectations toolkit ahead of eight scheduled Fed appearances, our dedicated guide to the end of Fed forward guidance explains how Warsh’s rejection of the prior communication regime changes the weight each data release and speaker appearance now carries in pricing December hike probability.
The oil variable: why Middle East energy prices make every Fed forecast contingent
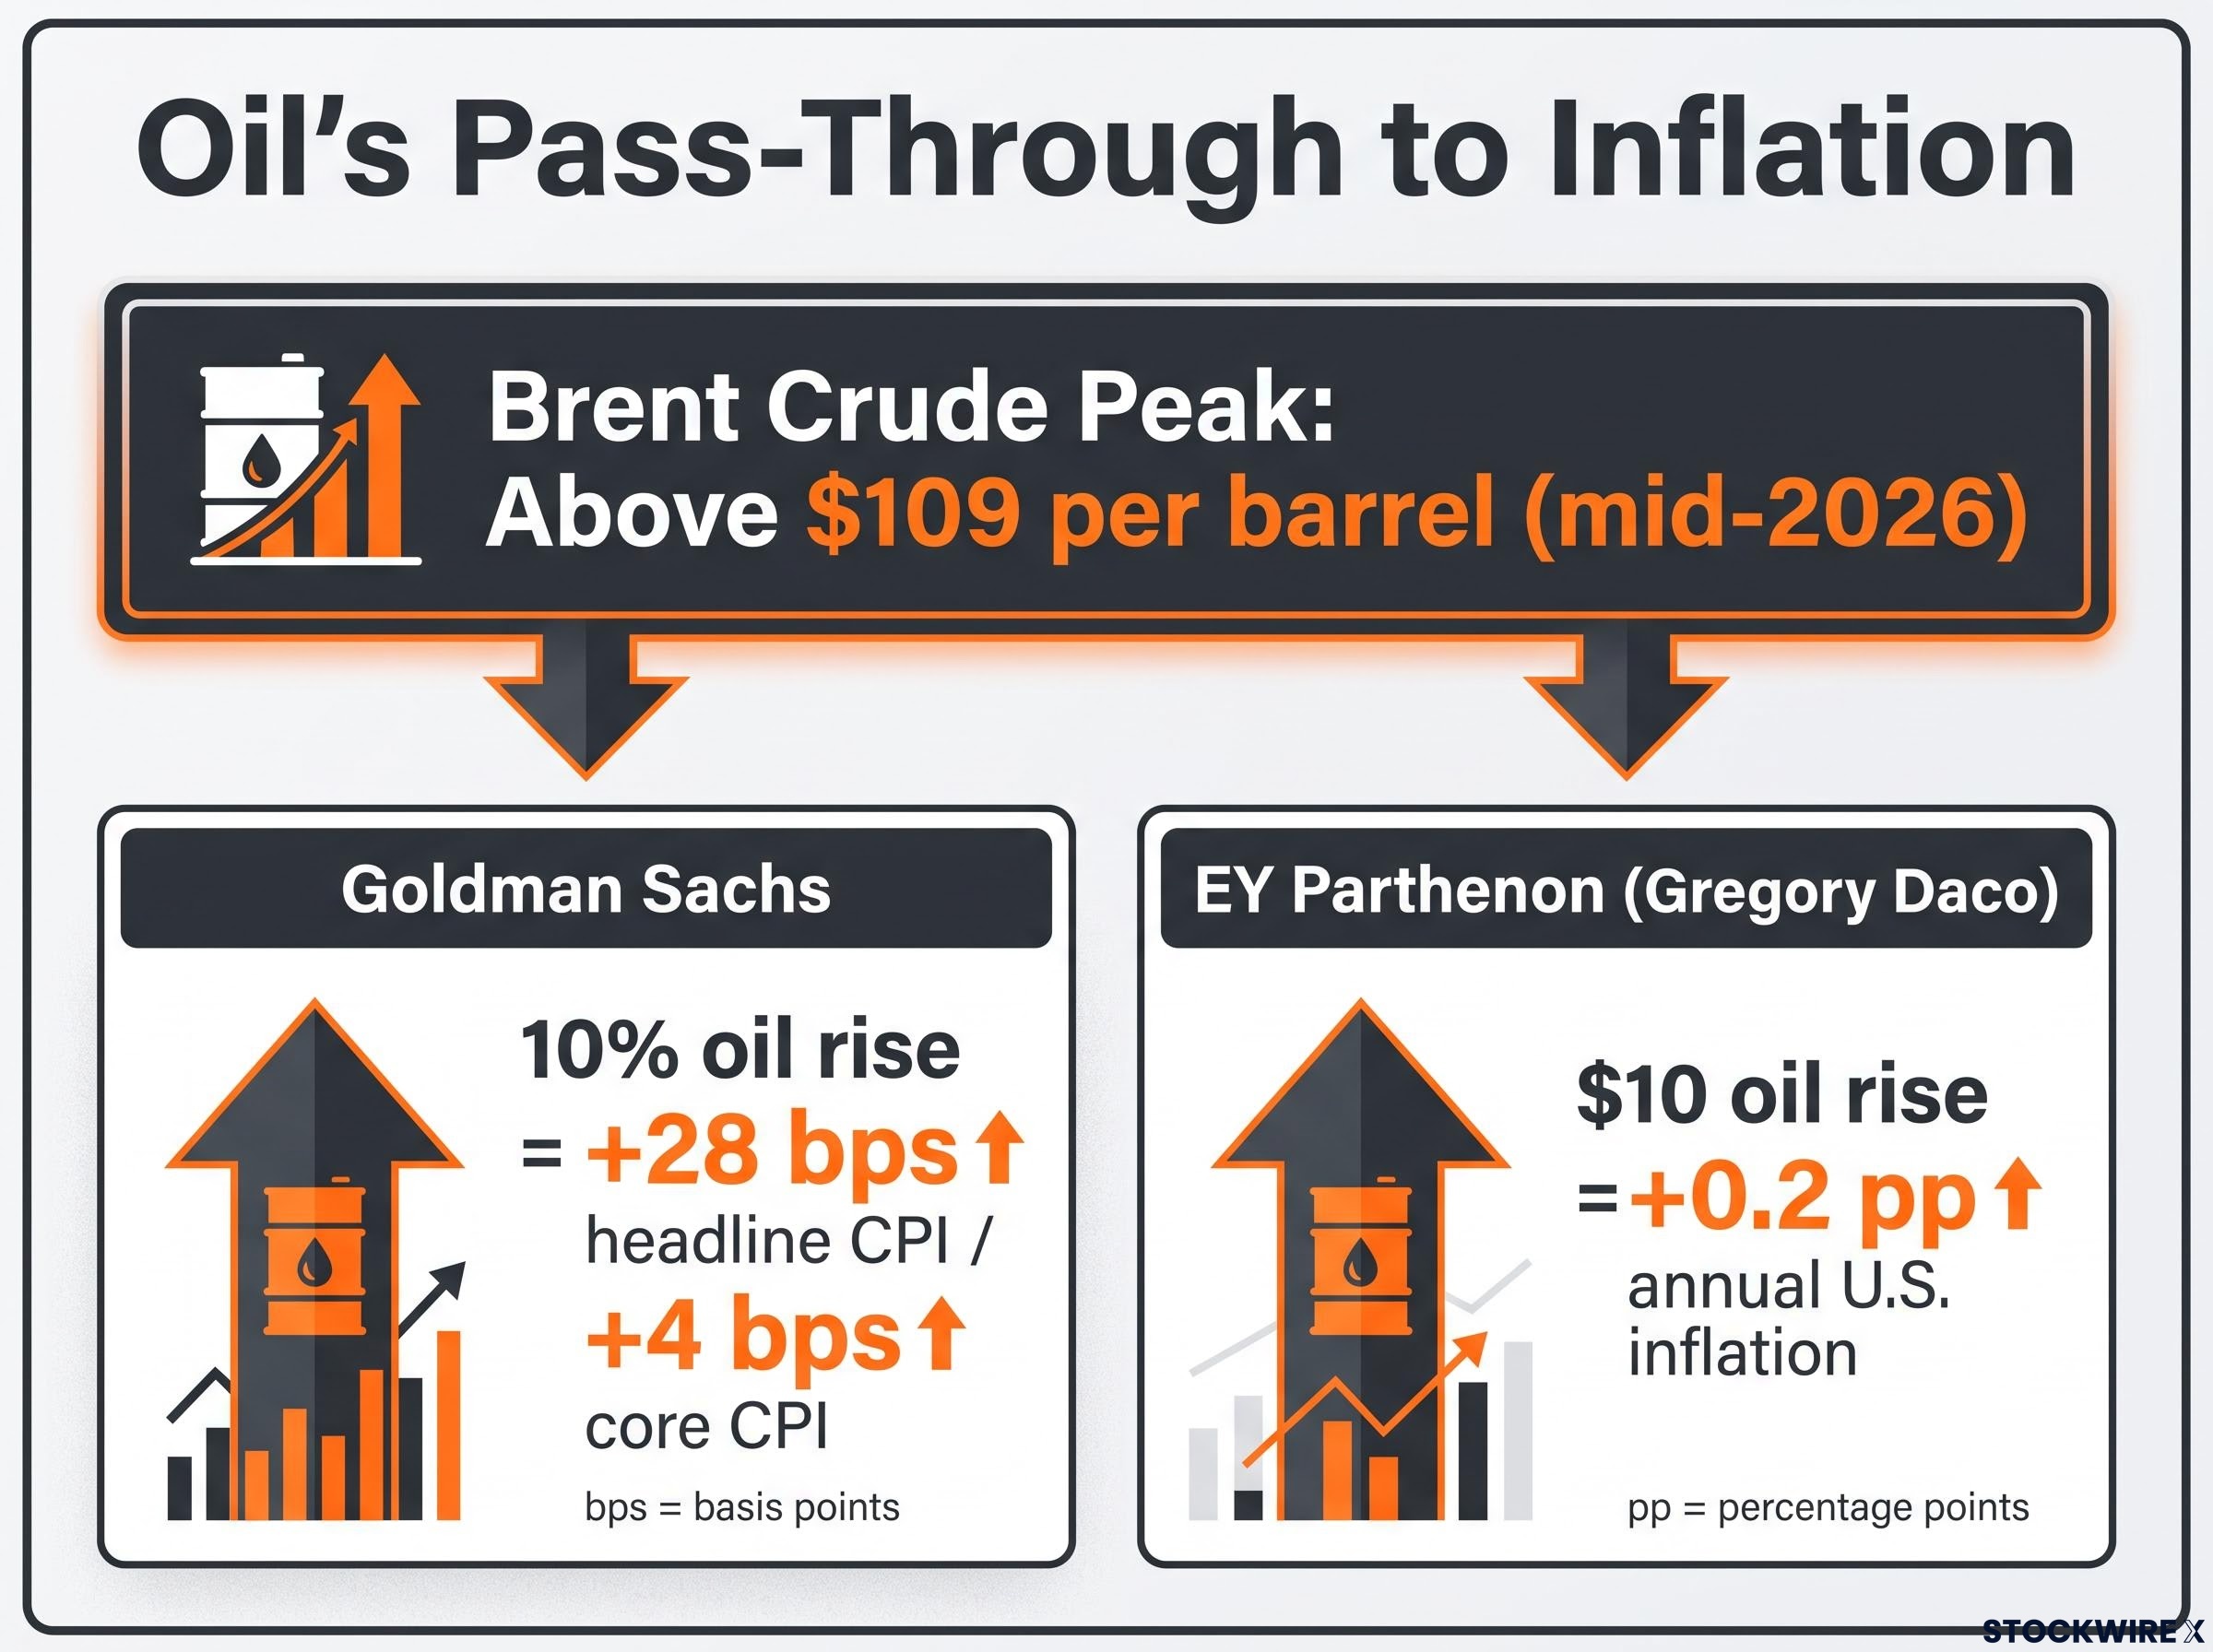
Every projection above rests on an assumption the Fed does not control: the price of oil. Middle East conflict pushed Brent crude above $109 per barrel during its mid-2026 peak, and that price sits entirely outside the reach of monetary policy.
The transmission into inflation is quantifiable. Goldman Sachs estimates that a sustained 10% rise in oil prices lifts core CPI by roughly 4 basis points and headline CPI by approximately 28 basis points. Gregory Daco of EY Parthenon estimates a sustained $10 rise in oil can add up to 0.2 percentage point to annual U.S. inflation. A CNBC Fed survey found most respondents expect elevated oil to shave about 0.3 percentage points off GDP growth, and more than 80% believe higher oil will eventually feed into core inflation, the measure the Fed watches most closely.
Oil pass-through into core inflation is systematically underestimated by headline CPI: US diesel prices surged approximately 50% since February 2026 against only a 26% rise in crude futures, because damaged Gulf refining infrastructure generated a separate scarcity premium in refined products that crude benchmarks never captured, meaning second-round effects on core are still building.
This creates the Fed’s central dilemma. Hiking into a supply-side energy shock risks damaging growth without durably lowering inflation, because the price pressure originates outside monetary policy. Raising rates does not put more oil on the market.
The transmission runs in three steps:
- Middle East supply disruption pushes Brent crude higher, toward the $109 peak seen in mid-2026
- Headline CPI rises via the pass-through quantified by Goldman Sachs and Daco
- Core CPI absorbs second-round effects over the following six to twelve weeks, sustaining Fed hawkishness
The clearest analytical middle ground The Kiel Institute recommends the Fed “raise once, then wait and see,” arguing the central bank should not chase the oil price with repeated hikes and should instead assess whether the shock produces persistent second-round inflation before acting again.
That framework contrasts with St. Louis Fed President Alberto Musalem’s higher-for-longer posture and Morgan Stanley’s economics team, which expects the Fed on hold through all of 2026 with cuts delayed to 2027. Yung-Yu Ma of PNC Asset Management puts it plainly: “hawkishness is here to stay” until energy markets ease.
| Institution / analyst | Oil-inflation or oil-Fed forecast | Policy implication |
|---|---|---|
| Goldman Sachs | 10% oil rise adds ~28 bps to headline CPI, ~4 bps to core | Validates the hike concern |
| Gregory Daco (EY Parthenon) | Sustained $10 oil rise adds up to 0.2pp to annual inflation | Moderate justification for tightening |
| Kiel Institute | Supply-side shock, avoid chasing the oil price | Raise once, then hold and assess |
| Alberto Musalem (St. Louis Fed) | Oil likely keeps core CPI near 3%, above the 2% target | Higher for longer |
If you are watching only the dot plot, you are watching the wrong variable. Crude prices and their pass-through into core CPI over the next six weeks will likely decide whether Warsh’s “more tightening ahead” becomes a December hike or stays a contingent warning. Should Brent hold above $109, the Kiel Institute’s measured framework loses ground to KPMG’s three-hike scenario. Should oil retreat, J.P. Morgan Private Bank’s overtightening argument gains traction.
What changes next week, and what the data still cannot tell you
Three forces have converged into a single tightening signal: the 10-year at 5.01%, DXY near 100.4, and a Fed with a median year-end projection of 4.1% that implies at least one more hike. Read as one regime, they point the same direction. The honest caveat is that the oil wildcard keeps any directional view conditional.
This is why the eight scheduled Fed appearances during the week of 22-26 September 2026 are not calendar filler. They follow a rate hike delivered into an environment where three major variables sit simultaneously at historically significant levels, which means a single speaker’s tone can reset December hike pricing across all three at once. Watch especially for any regional president who reinforces or softens Warsh’s “not particularly restrictive” framing.
Three specific variables deserve your attention as the week unfolds:
- The 10-year yield. Whether it sustains above 5% or retreats toward the 4.94% FRED reading as Fed speakers’ tone resolves. Holding above 5% keeps discount-rate pressure on growth equities; a retreat eases it.
- The dollar index. Whether DXY holds above 100 or fades. Morgan Stanley’s model translates the direction directly into S&P earnings revisions, at roughly negative 0.5% EPS per 1% move.
- Brent crude. Whether it holds above $109. That level determines whether KPMG’s three-hike scenario or J.P. Morgan Private Bank’s overtightening argument commands more analytical weight.
Track only one of these in isolation and you risk misreading the signal. Track all three together and you have a structured way to judge whether conditions are tightening further or plateauing, which is the decision-relevant question for positioning across equities, bonds, and currency-exposed holdings.
This article is for informational purposes only and should not be considered financial advice. Investors should conduct their own research and consult with financial professionals before making investment decisions. Past performance does not guarantee future results. Financial projections are subject to market conditions and various risk factors, and these statements are speculative and subject to change based on market developments.