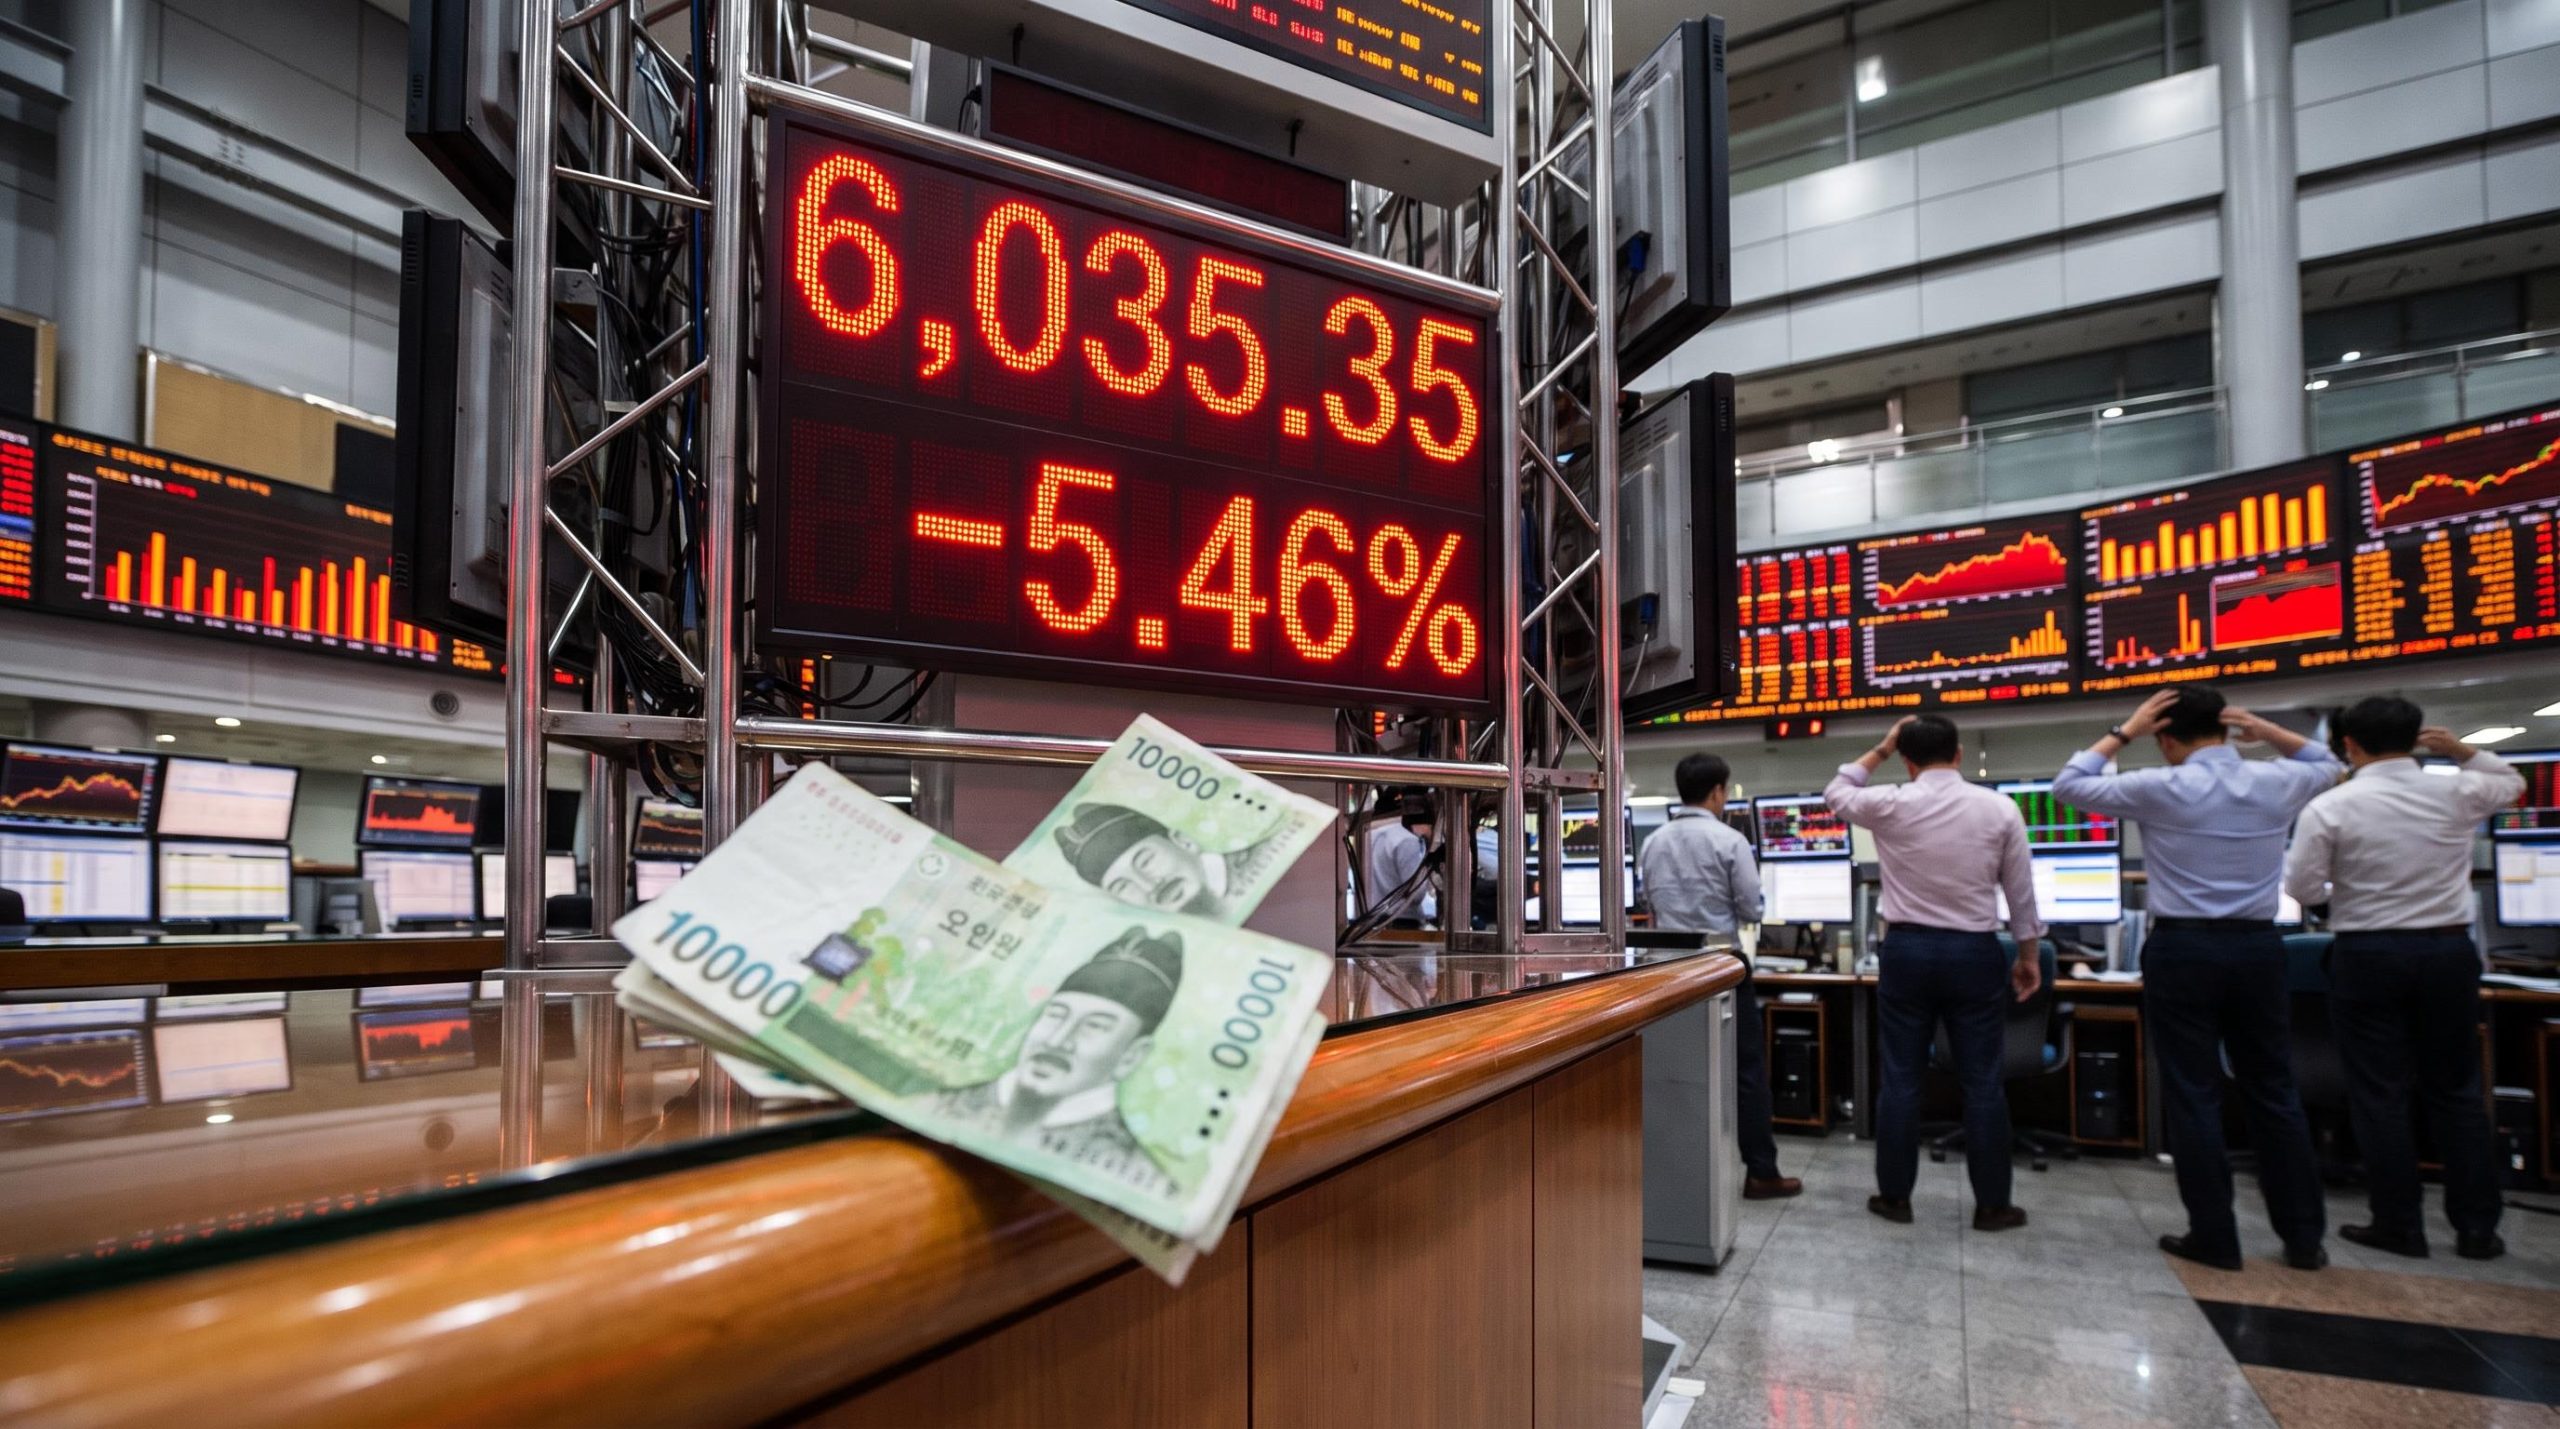
When the QQQ gained roughly 54% in 2023, investors holding TQQQ, the 3x leveraged version, might have expected something close to 162%. What they received was extraordinary in a different way. The gap between that naive expectation and the realised return is not a fluke of one particular year. It is baked into the structure of every leveraged ETF ever created, a consequence of daily resetting, compounding asymmetry, and a phenomenon known as volatility drag.
Leveraged ETFs have surpassed $100 billion in global assets, according to ETFGI data from 2024, and they attract enormous retail participation around macro events and momentum trades. Yet the single most consequential feature of these products, the daily reset mechanism that produces volatility drag, remains poorly understood even among active investors. Regulatory bodies including FINRA and the CFA Institute have documented this educational gap repeatedly.
What follows unpacks the exact mechanics of volatility drag and daily resetting, walks through concrete numerical examples, and explains why the compounding penalty grows nonlinearly with both leverage and holding period. Readers will finish with a clear, intuitive model of path dependence, one that applies when evaluating any leveraged or inverse ETF.
The daily reset is the root of everything
A leveraged ETF is contractually designed to deliver its stated multiple of an index’s single-day return. Not a week’s return. Not a quarter’s. A single day’s.
At each market close the fund resets its exposure, starting the next trading session from a fresh baseline rather than carrying forward a compounded position. This is not a minor administrative detail. It is the structural feature that determines all downstream behaviour.
The daily reset follows a repeating three-step cycle:
- The fund calculates the underlying index’s return for that trading day.
- It delivers the stated multiple (2x or 3x) of that return to shareholders.
- It resets its derivative exposure to a new baseline at the close, so the next day’s leverage starts from scratch.
“Leveraged and inverse ETFs are typically designed to achieve their stated objectives on a daily basis.” — FINRA Investor Insights
FINRA Regulatory Notice 09-31, issued in 2009 and still operative, framed this daily reset as the core suitability concern for these products. SEC Rule 18f-4, adopted in 2020, now governs the derivatives-risk management framework under which these funds operate. Neither rule has been updated since, meaning investors navigate leveraged ETFs within a guidance structure anchored to documents written before many of today’s popular tickers existed.
The reset period difference between daily-reset 3x products and modestly leveraged embedded-exposure funds is more consequential than the leverage multiple itself; a fund with 1.25x permanent exposure carries no daily compounding clock, while a 3x daily-reset product restarts that clock every 24 hours regardless of market conditions.
FINRA Notice 09-31 framed the daily reset as the central suitability concern for leveraged and inverse ETFs, explicitly stating that these products are typically unsuitable for retail investors who intend to hold them beyond a single trading session, a position that remains the operative regulatory standard today.
The daily reset seems harmless in isolation. Its consequences emerge on day two.
When big ASX news breaks, our subscribers know first
What volatility drag actually is, and why flat markets are lethal for leveraged ETFs
Here is the signal a holder would observe: an index ends a two-day stretch exactly where it started, yet the leveraged ETF tracking it is down. Not slightly down. Meaningfully down.
Volatility drag is the gap between the stated leverage multiple of a cumulative index return and the ETF’s actual realised return. It is generated by the asymmetry of percentage gains and losses applied to a changing capital base. The arithmetic makes the problem visible.
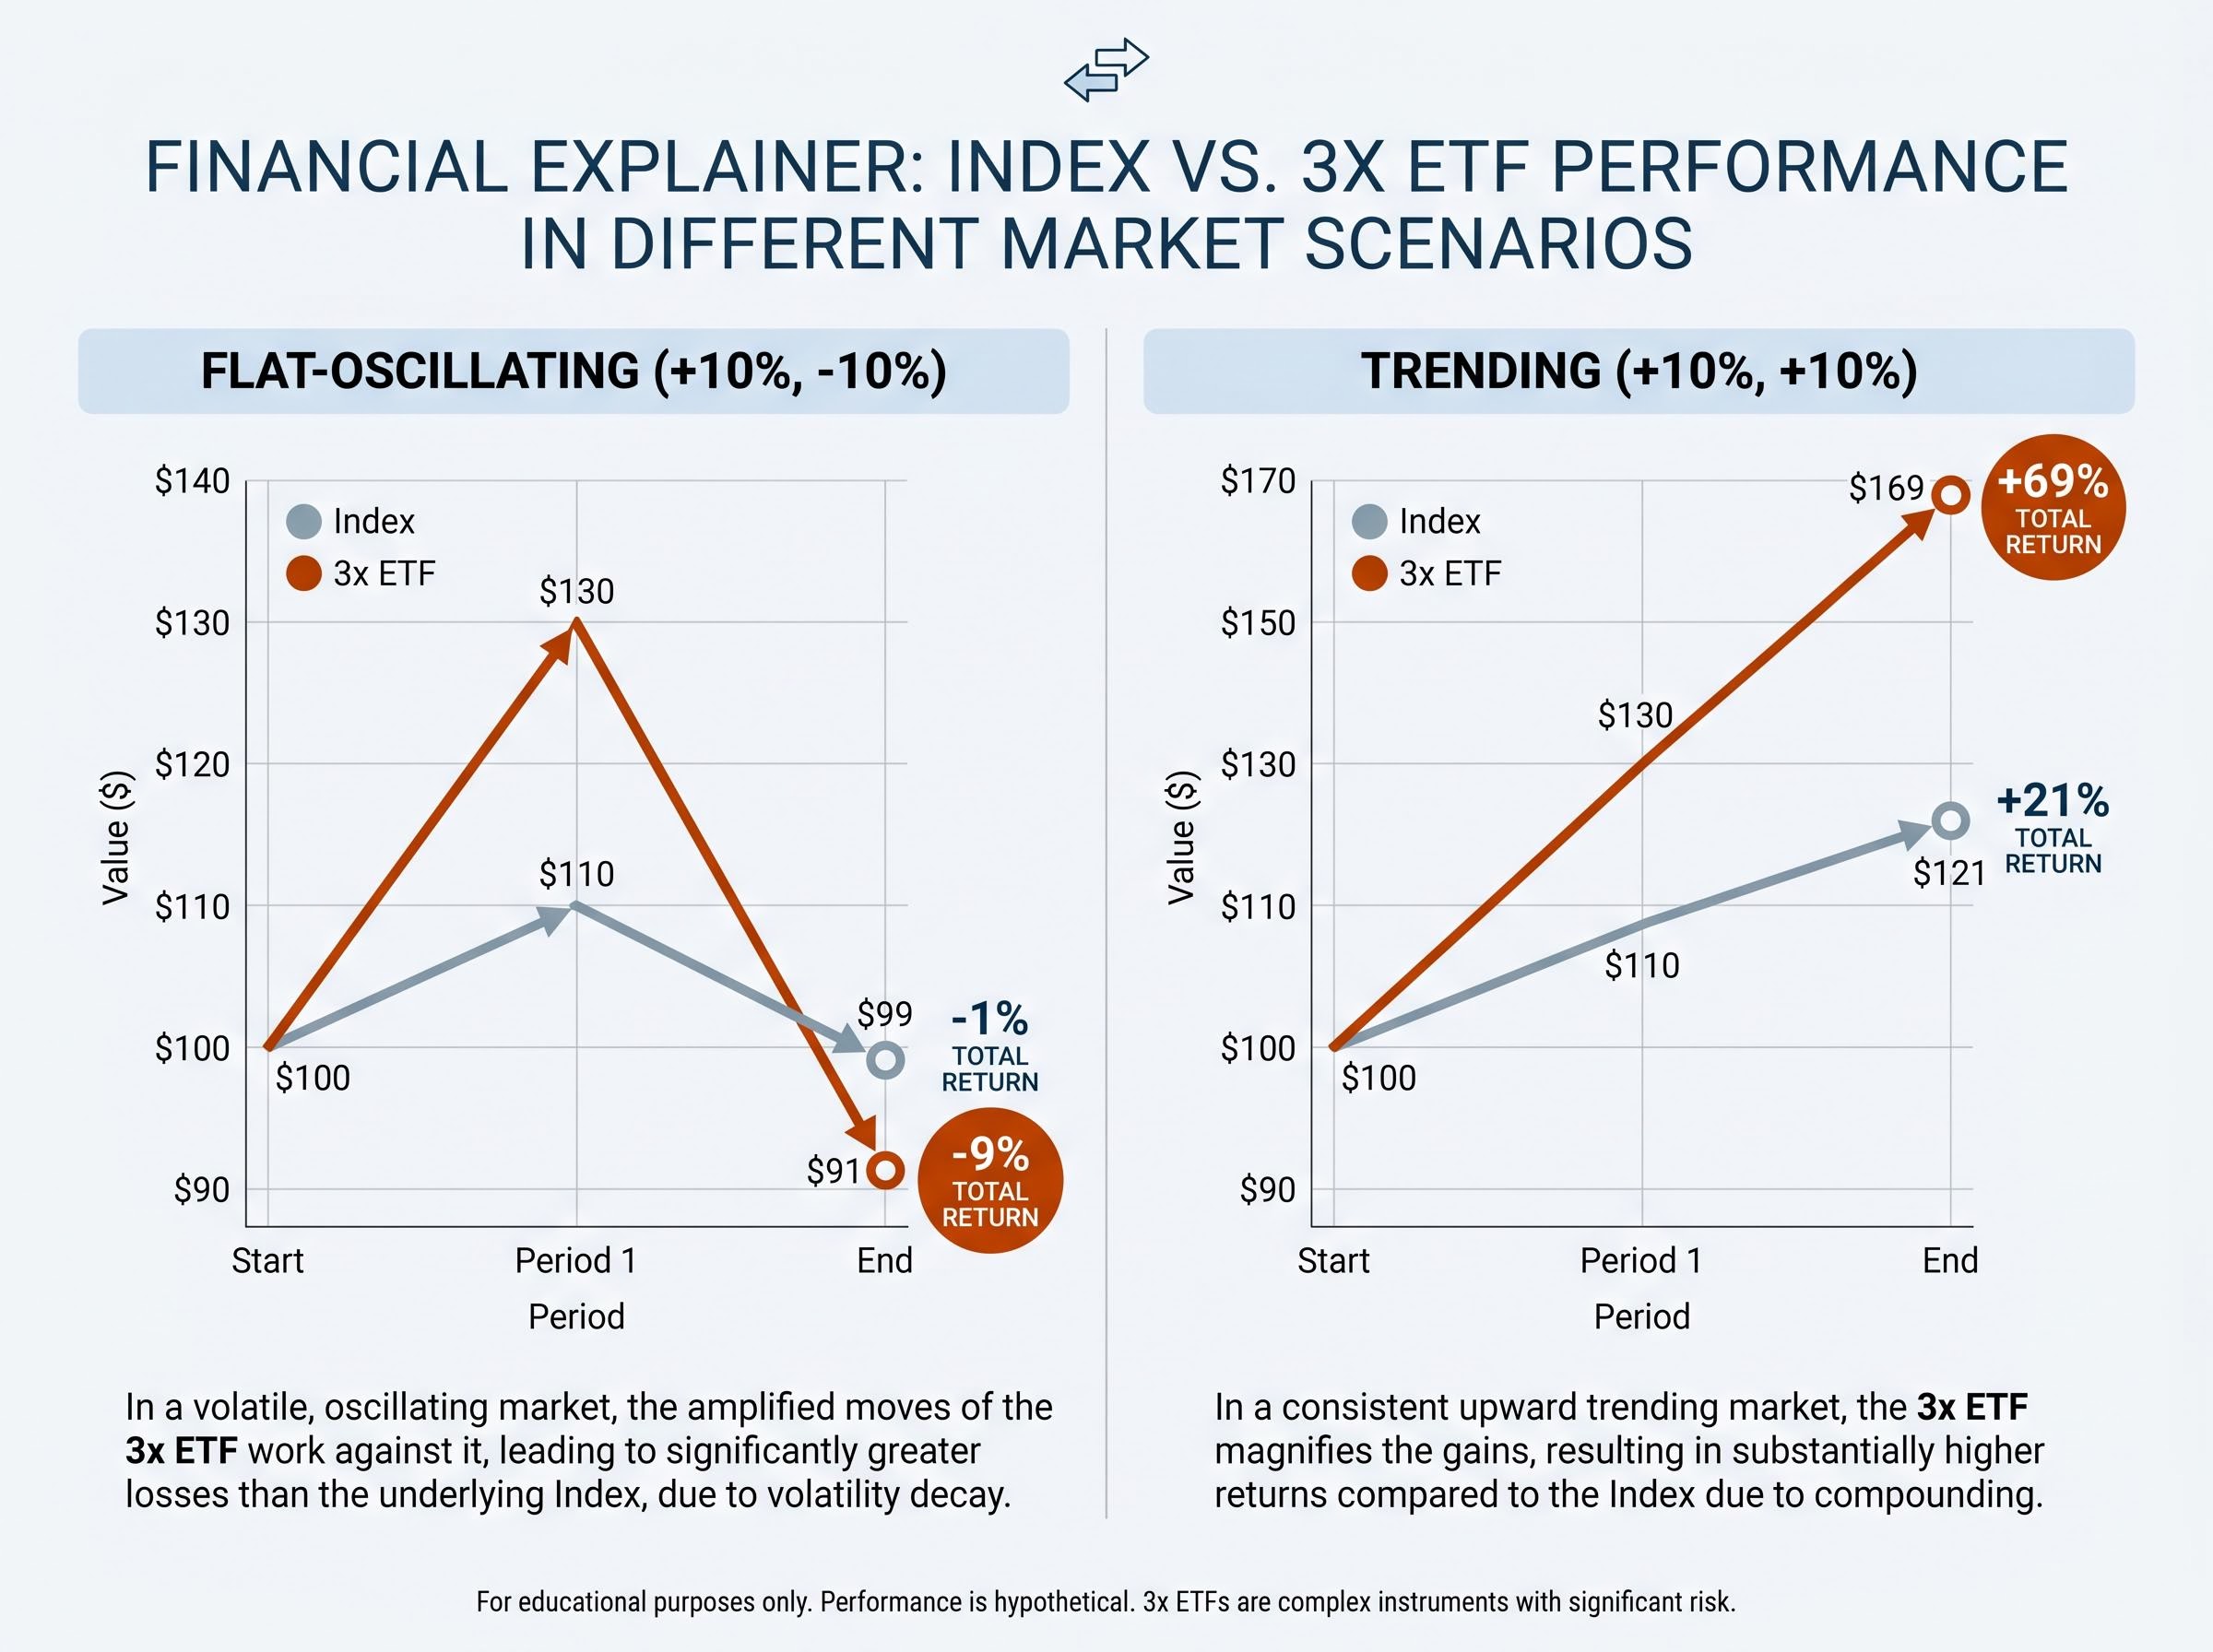
Consider an index that rises 10% on day one and falls 10% on day two. The index moves from $100 to $110, then back to $99, a net loss of 1%. A 3x leveraged fund on the same path moves from $100 to $130 (up 30%), then falls 30% the next day to $91. That is a 9% loss, not the 3% that three times the index’s 1% decline would suggest.
Now change the path. If the same index rises 10% on two consecutive days, it finishes at $121, a 21% gain. The 3x fund moves from $100 to $130 to $169, a 69% gain, which exceeds three times the index’s 21% return. Research from Guedj, Li, and McCann (2010) formalised this holding-period shortfall framework, showing that the daily reset is not uniformly harmful; it rewards trending markets and punishes oscillating ones.
| Scenario | Index path | Index total return | 3x ETF total return |
|---|---|---|---|
| Flat-oscillating (+10%, -10%) | $100 → $110 → $99 | -1% | -9% |
| Trending (+10%, +10%) | $100 → $110 → $121 | +21% | +69% |
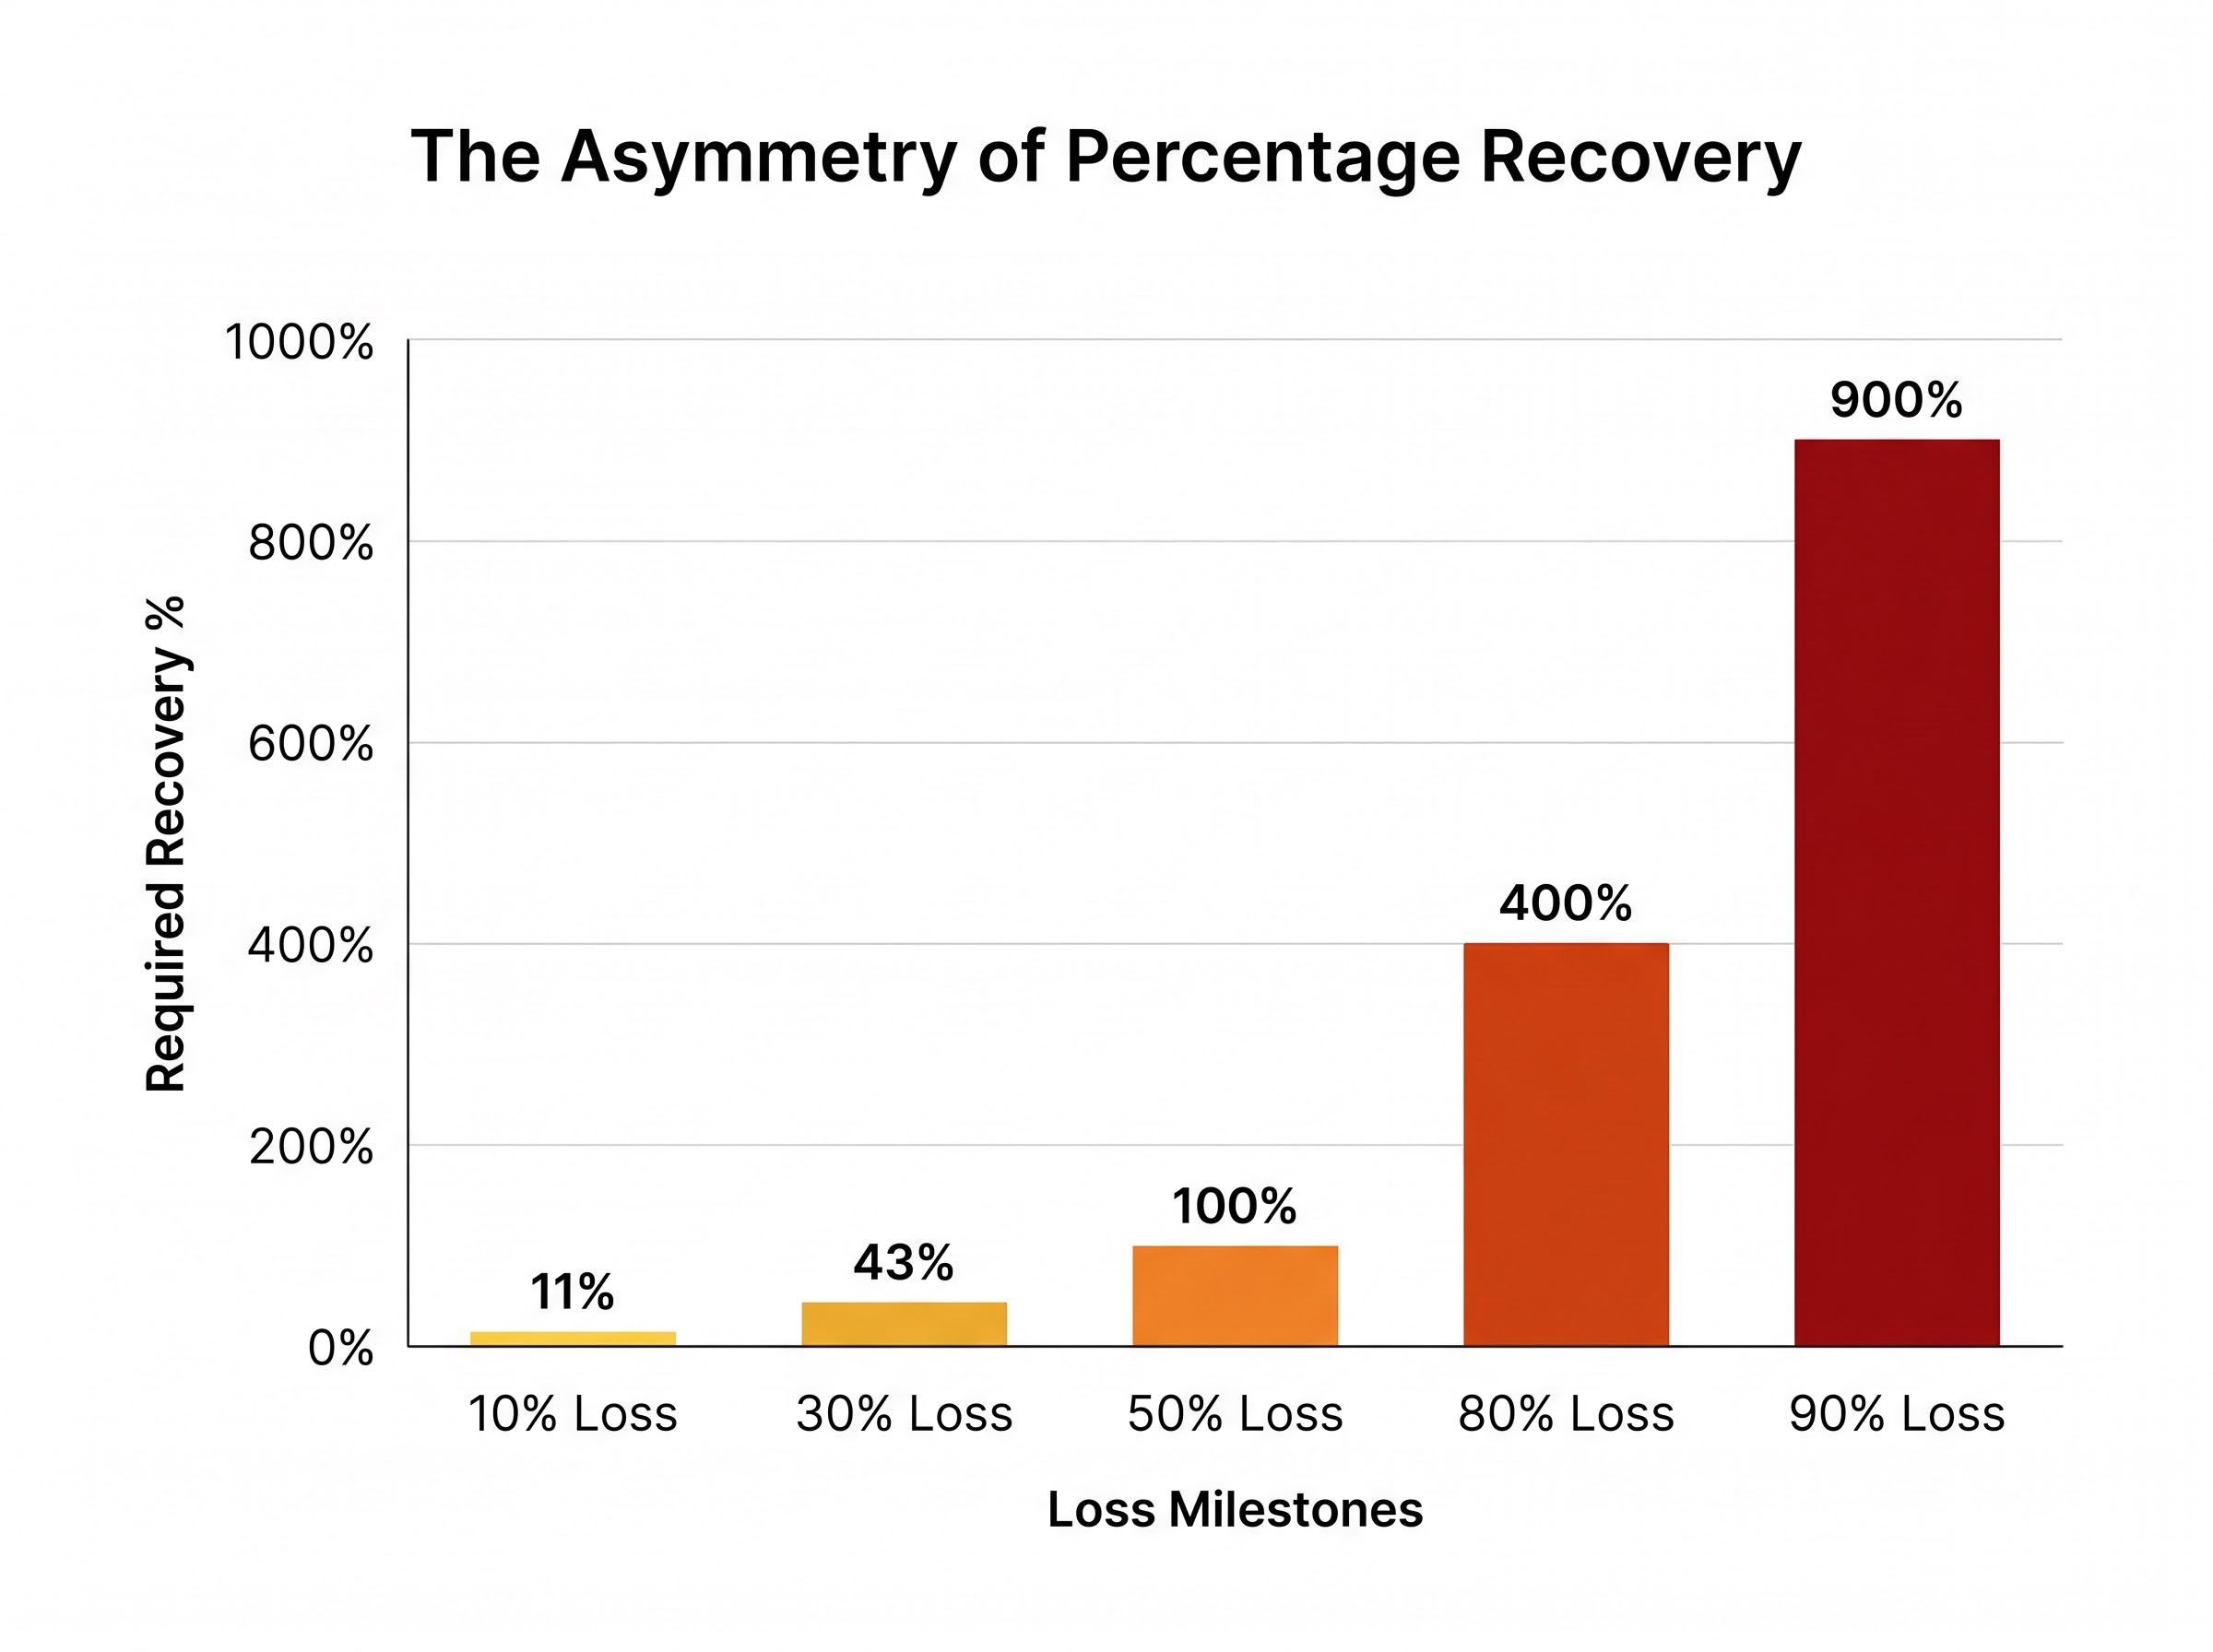
The disparity comes down to a single mathematical fact: losses and gains are not symmetrical on a percentage basis.
A 30% gain requires a 43% recovery to break even. A 50% loss requires 100%. An 80% loss requires 400%. A 90% loss requires 900%.
That asymmetry, amplified by leverage and applied daily, is volatility drag.
Path dependence, the concept that makes volatility drag more than a math curiosity
Two identical start and end points on an index chart can produce dramatically different leveraged ETF outcomes depending on what happened between them. This property, path dependence, is what separates leveraged ETFs from any other amplified-exposure instrument.
The leveraged ETF’s cumulative return is determined not just by where the index starts and finishes but by the specific sequence of daily moves along the way. Each day’s gain or loss compounds on whatever capital base remains after the previous day’s result. When a severe drawdown devastates that base, no subsequent rally, however strong, can recreate a proportional leveraged return over the full cycle.
Three conditions maximise volatility drag:
- High realised volatility in the underlying index
- Mean-reverting, choppy price action rather than sustained directional movement
- Long holding periods without a strong, persistent trend
Research from Guedj, Li, and McCann (2010) demonstrated this directly: portfolios with no rebalancing across the period from December 2008 through December 2009 finished highest, while those with daily rebalancing (the cadence leveraged ETFs are locked into) finished lowest. The daily reset was the worst-performing rebalancing frequency over that volatile stretch.
Direxion data from the same period show that TECL (3x technology bull) and TECS (3x technology bear) both lost money during certain windows when the underlying sector oscillated violently without a clear direction. A fund and its exact inverse, both losing simultaneously, is path dependence made visible.
The 2022 TQQQ case study
The 2022 bear market provided the most recent large-scale demonstration. QQQ fell sharply from its peak, and TQQQ amplified that decline to approximately 80% peak-to-trough, according to ETF.com documentation.
An 80% drawdown requires a 400% gain just to return to the prior peak. Even as QQQ staged a substantial recovery through 2023 and into 2024, TQQQ could not deliver three times the index’s full-cycle return from trough to recovery peak. The capital base had been reduced so severely that the mathematics of compounding on a daily-reset structure made proportional recovery impossible.
This is not a flaw. It is the product working exactly as designed, one day at a time.
Why the leverage multiple is a daily promise, not a long-term contract
Three misconceptions, documented by both FINRA and the CFA Institute, account for most of the losses retail investors suffer in these products. Each sounds reasonable until the arithmetic intervenes.
- The leverage multiple applies over any holding period. It does not. The target multiple is explicitly daily. Over longer horizons, the CFA Institute notes, returns can diverge substantially from the stated multiple, and in some cases move in the opposite direction entirely.
- A flat index means a flat leveraged ETF. It does not. FINRA’s own numerical examples show that a leveraged ETF can lose significant value in a market that finishes exactly where it started, provided that market experienced volatility along the way.
- Leveraged ETFs are appropriate buy-and-hold instruments. They are not designed for this purpose. FINRA Investor Insights explicitly warns that these products are not “suitable as long-term investment vehicles.”
“Over longer horizons, returns can be lower than, higher than, or even opposite in sign relative to the leveraged multiple of the underlying.” — CFA Institute, Understanding Leveraged and Inverse ETFs (2019)
The divergence between the daily promise and the long-horizon outcome is not a product flaw or tracking error. It is a mathematical consequence of compounding on a daily-reset structure. FINRA’s Investor Insights page, updated in 2023 and still actively referenced, describes the “buy-high/sell-low” behaviour embedded within the ETF’s daily rebalancing: the fund mechanically increases exposure after gains and reduces it after losses, locking in a pattern that works against holders in oscillating markets.
What compounds the problem is familiarity bias. Because these products trade like conventional ETFs, through a standard brokerage account, with a ticker symbol and an intraday price, investors assume their long-horizon behaviour resembles a conventional ETF’s. The wrapper is identical. The mechanics inside are not.
How the drag compounds nonlinearly as leverage increases
Moving from a 2x to a 3x leveraged ETF does not simply add one more unit of return and one more unit of risk. The compounding penalty amplifies more than proportionally with each increment of leverage.
The mechanism is the same asymmetry discussed earlier, but steeper. At higher leverage levels the percentage recovery required after a given loss grows exponentially, widening the gap between gains and losses on the daily capital base:
- A 10% loss requires an 11% gain to recover
- A 30% loss requires a 43% gain
- A 50% loss requires a 100% gain
- An 80% loss requires a 400% gain
A 3x fund reaches those deeper loss thresholds faster and more frequently than a 2x fund, which means the recovery burden is not just higher but disproportionately higher. FINRA and the CFA Institute both document that the magnitude of divergence from the stated multiple grows with leverage level. ETF.com’s analysis reinforces this empirically: the assumption that “more leverage is always better” fails once realised volatility and path are accounted for.
The bull market illusion
Even sustained bull markets contain sufficient day-to-day volatility to generate meaningful drag in 3x products. The multi-year window from 2020 through 2023 produced extraordinary returns for QQQ-tracking products. It also contained the extreme volatility of 2020 and the approximately 80% TQQQ collapse of 2022.
Leveraged covered call ETFs represent one structural response to the compounding problem: by combining 1.25x permanent equity exposure with a call-writing overlay, they eliminate the daily reset mechanism entirely while still amplifying income yield, though the call-writing overlay caps upside participation in exactly the sustained trending markets where daily-reset 3x products perform best.
Collectively, those episodes ensured that TQQQ did not deliver three times QQQ’s total return over the period, despite the index finishing substantially higher than where it began. The trending periods rewarded holders; the volatile drawdowns consumed the gains disproportionately. A 3x product in a bull market that includes one severe bear episode is not simply “3x of the bull.” It is 3x of every single day, including the worst ones.
What the structure means in practice for anyone who holds these products
The regulatory and institutional consensus, across FINRA, the CFA Institute, and SEC staff guidance, positions leveraged ETFs as short-horizon instruments. Holding periods measured in days, not weeks or months, represent the structural sweet spot where the daily promise and actual outcome remain closely aligned.
Two practical principles follow from the mechanics:
- Align holding period with the daily reset. The further a position extends beyond a single session, the more the compounding clock runs. In any market that oscillates rather than trends, each additional day increases the probability that realised returns diverge from the stated multiple.
- Anchor position size to the underlying index move, not the ETF allocation. If a trader sizes to risk $1,000 on a 5% underlying move, the 3x ETF equivalent caps the allocation at roughly $6,667 (the $1,000 risk budget divided by the 15% leveraged move), not the $20,000 that would represent the same dollar allocation in the unleveraged index.
Leveraged and inverse ETFs are not “suitable as long-term investment vehicles.” — FINRA Investor Insights
The regulatory framework has not produced new leveraged-ETF-specific rules since FINRA Notice 09-31 in 2009 and SEC Rule 18f-4 in 2020. No new proposal targeting these products has been identified as of May 2026. Investors navigate a product class that has grown past $100 billion in global assets using a guidance structure designed when these products were a fraction of that size.
ETF expense ratios and hidden costs, including tracking difference, bid-ask spreads, and the implicit financing costs embedded in derivative-based leverage, compound across holding periods in ways that are structurally similar to volatility drag: individually small, collectively significant, and nonlinearly worse over longer time horizons.
This article is for informational purposes only and should not be considered financial advice. Investors should conduct their own research and consult with financial professionals before making investment decisions.
The compounding clock starts on day two
Every day a leveraged ETF is held beyond its first is a day the compounding clock runs. In a trending market, that clock works in the holder’s favour, amplifying gains beyond the naive multiple. In an oscillating market, it works against the holder, compounding the asymmetry of percentage losses on a shrinking capital base.
The conditions under which leveraged ETFs deliver outsized returns are specific: sustained, low-volatility directional moves with few sharp reversals. The conditions under which they destroy capital are far more common: choppy, mean-reverting price action over extended holding periods.
ETF.com’s multi-year divergence analysis documents that over periods including the 2020-2023 window, 3x products consistently failed to deliver three times the index’s cumulative return, with the shortfall driven entirely by realised volatility along the path.
The daily reset is not a footnote. It is the product. Understanding it, and the path dependence it creates, is the difference between using a leveraged ETF as the short-horizon instrument it was designed to be and holding a position whose structure is quietly working against the thesis every session it remains open. Verified sources from FINRA Investor Insights, the CFA Institute’s Understanding Leveraged and Inverse ETFs (2019), and ETF.com’s performance documentation provide the empirical foundation for evaluating that distinction.