A trader who loses on 60% of their trades can structurally outperform one who wins 70% of the time. That is not a hypothetical. It is a mathematical certainty under the right conditions, and the reason it works cuts against the way most investors measure their own performance.
The instinct is to track win rate as a proxy for skill. If you are right more often than you are wrong, you assume you are doing well. But win rate alone tells you almost nothing about whether your strategy will survive and compound over time. The metrics that actually determine long-term portfolio outcomes are different from the ones most investors check.
After reading this, you will know how to calculate the single number that reveals whether your strategy has a genuine mathematical edge. You will also understand why large losses do not just set you back; they change the difficulty of the game itself. Most importantly, you will have a five-step method for auditing your own trade history and diagnosing exactly where your approach breaks down.
Why winning most of the time is not the same as winning overall
Before walking through the numbers, you need the formula that ties them together. It has four components: your win rate (the fraction of trades that make money), your loss rate (one minus your win rate), your average win (the mean percentage gain on winning trades), and your average loss (the mean percentage decline on losing trades).
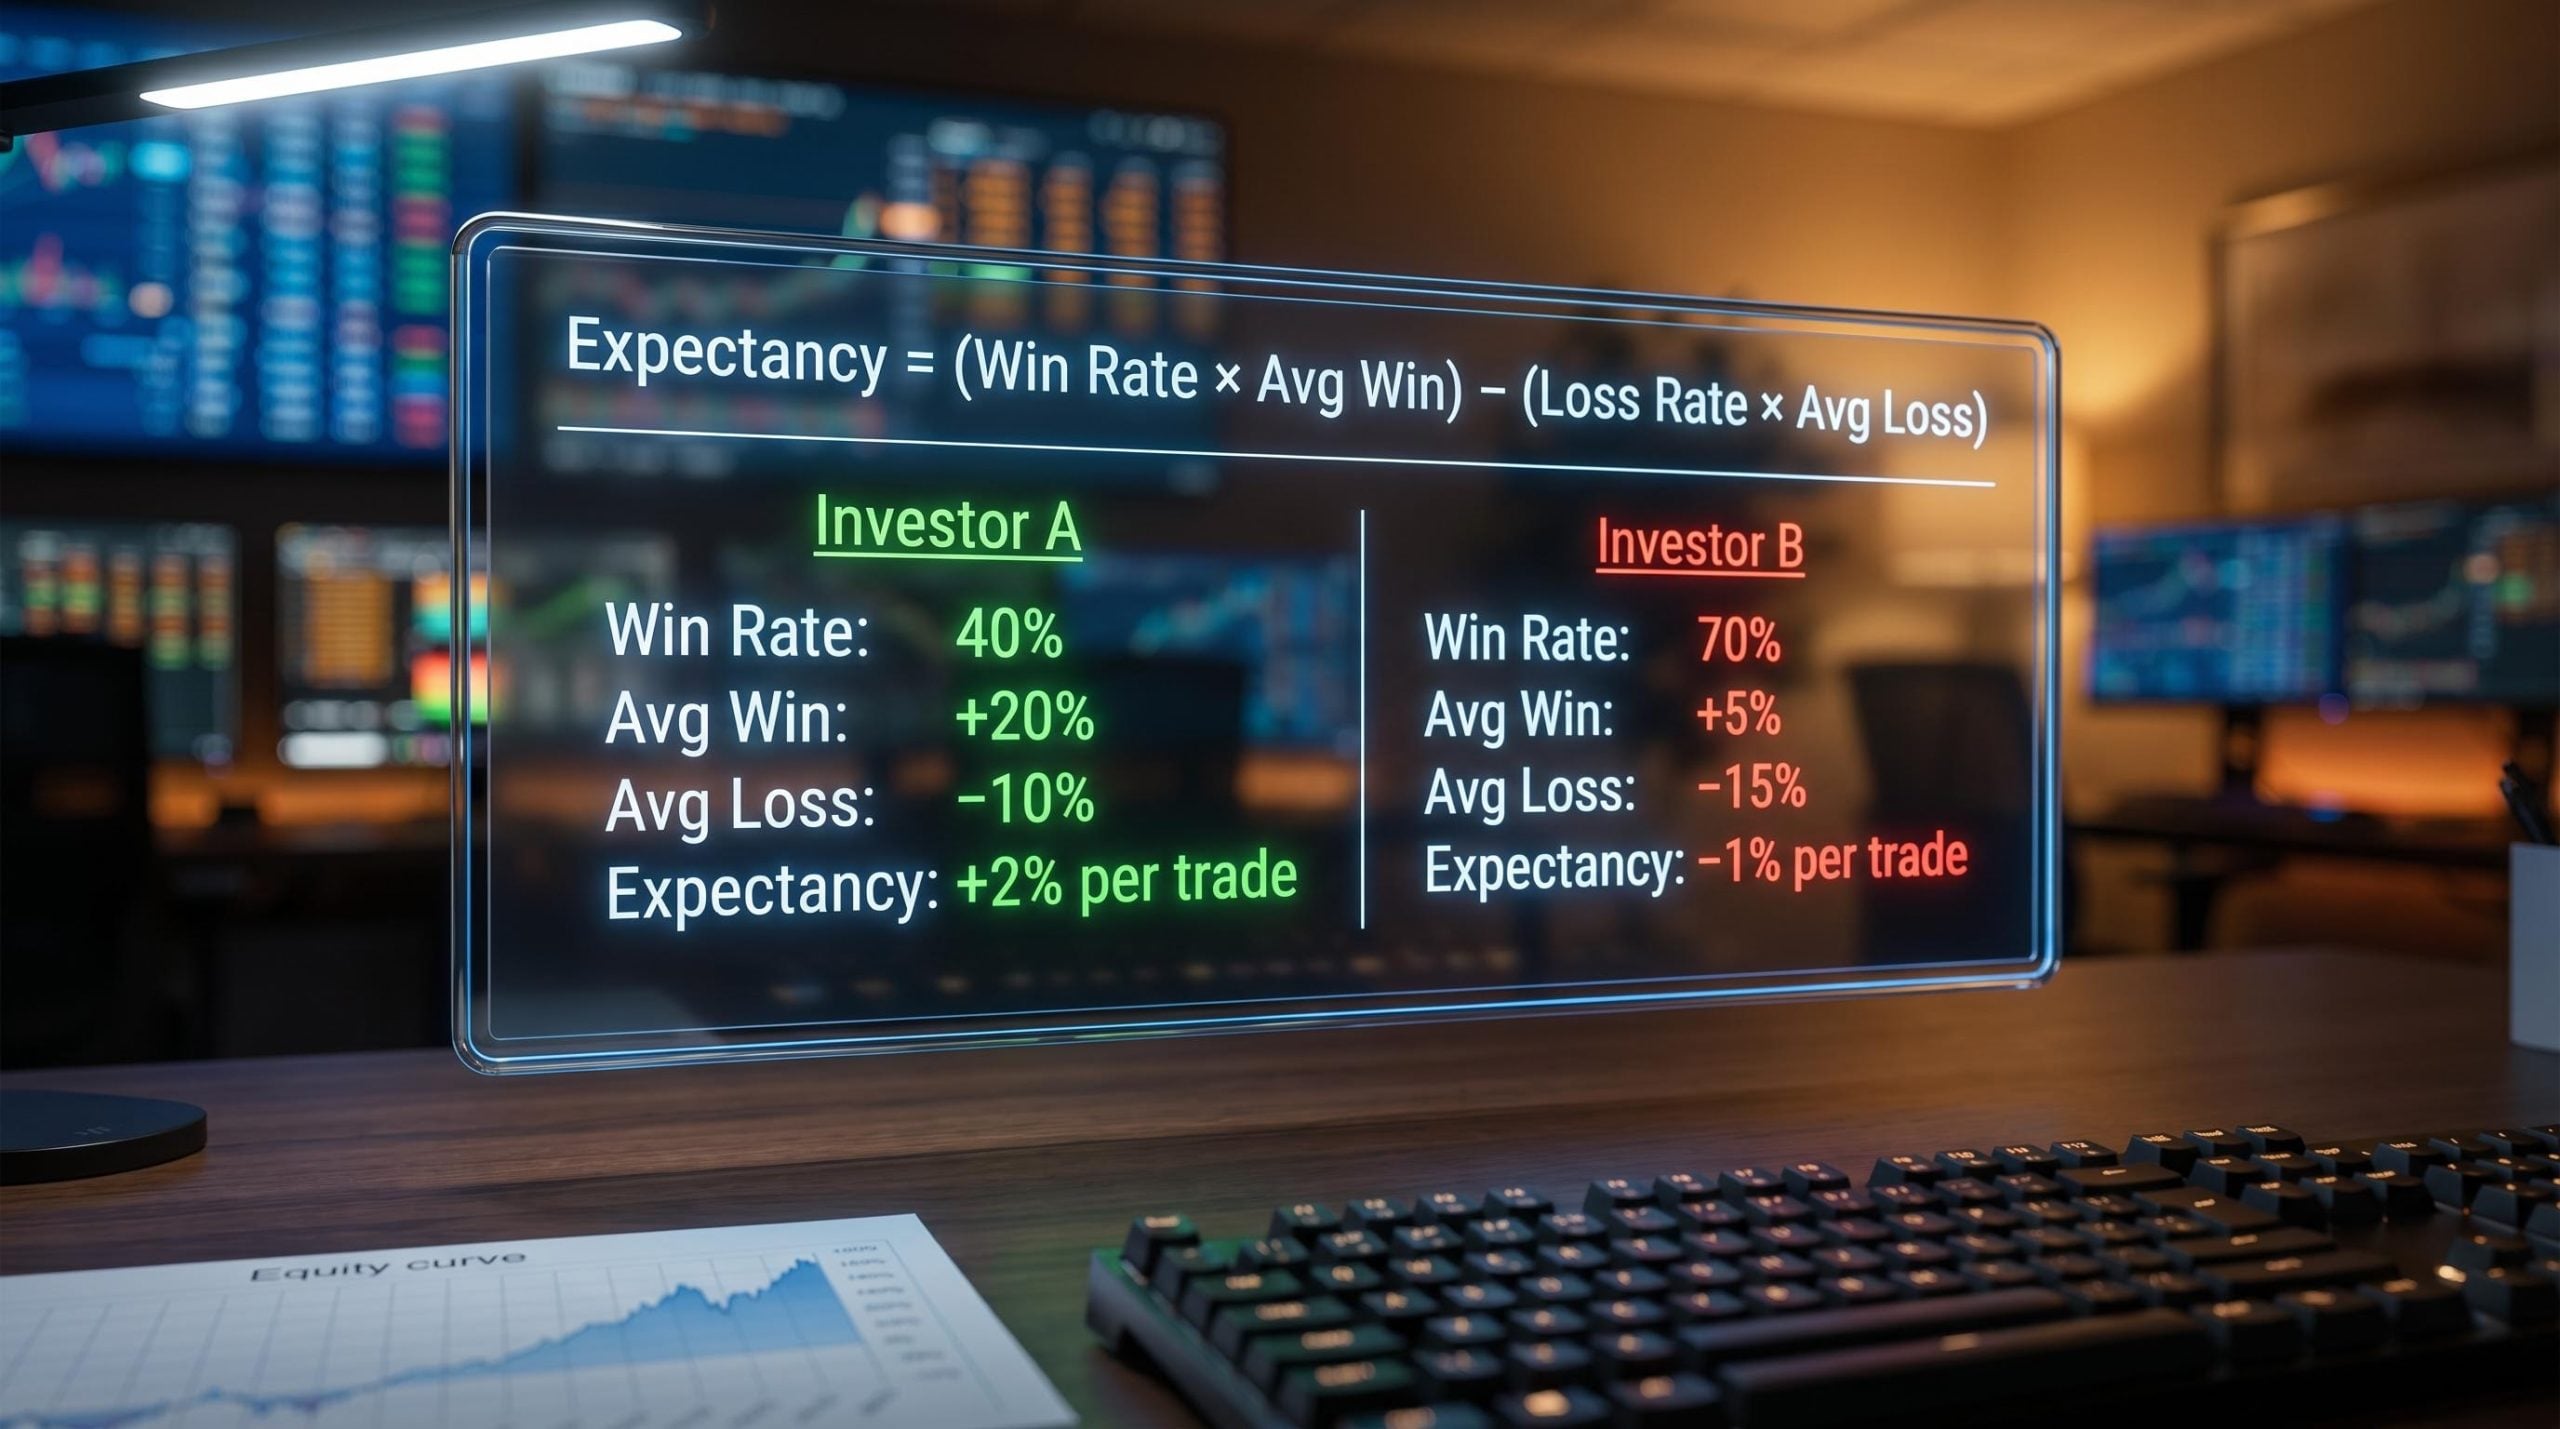
Expectancy = (Win Rate × Average Win) − (Loss Rate × Average Loss)
Now consider two investors.
Investor A has a win rate of just 40%, meaning losses outnumber wins by a ratio of three to two. However, each winning trade delivers an average gain of +20%, while losing trades are kept to an average of -10%.
Investor B wins 70% of the time. But the average gain on a winner is only +5%, and the average loss on a loser is -15%.
| Metric | Investor A | Investor B |
|---|---|---|
| Win Rate | 40% | 70% |
| Average Win | +20% | +5% |
| Average Loss | -10% | -15% |
| Expectancy per Trade | +2% | -1% |
Plugging Investor A’s figures into the formula gives: (0.40 × 20%) − (0.60 × 10%) = +2% per trade. Running the same calculation for Investor B: (0.70 × 5%) − (0.30 × 15%) = -1% per trade.
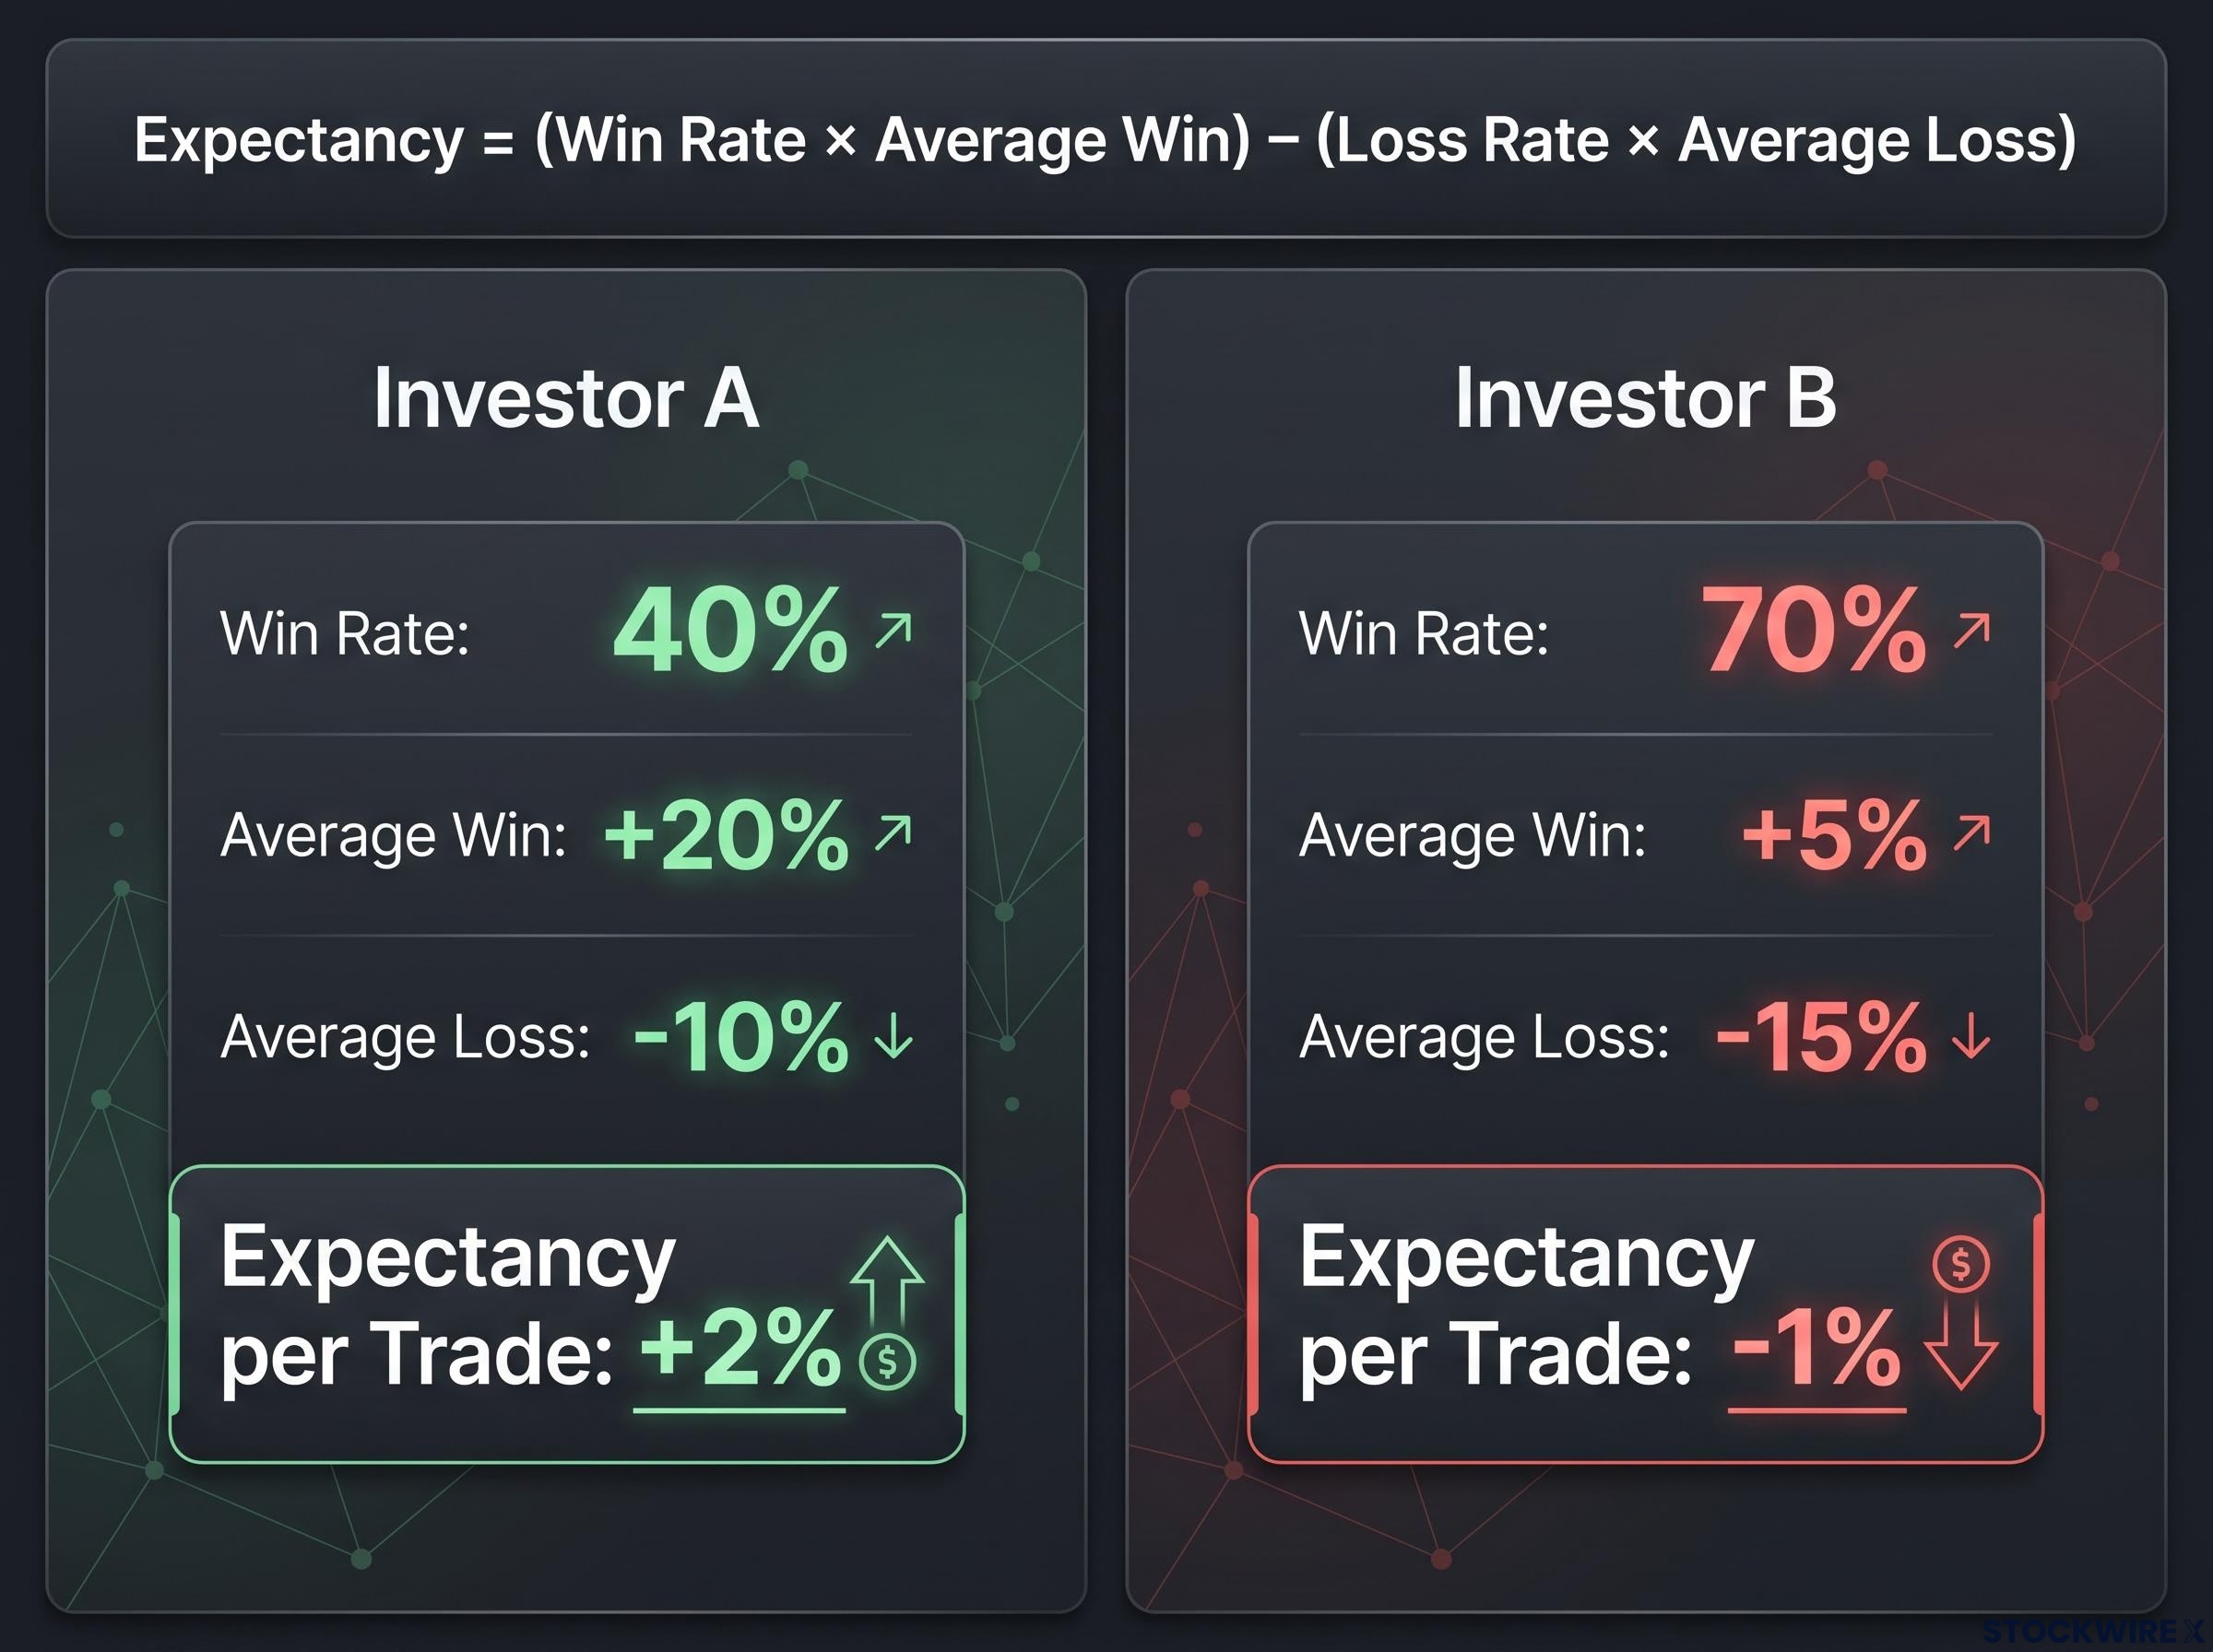
Investor B feels successful. Seven winners out of ten is a satisfying record. But every trade, on average, costs 1% in structural losses. Investor A feels wrong most of the time, yet every trade generates an average gain of 2%. The difference comes down to the payoff ratio, which is your average win divided by your average loss. It is the variable most investors ignore entirely when evaluating their own performance.
If your confidence in your strategy comes from counting how often you are right, you are measuring the wrong thing. A strategy can feel successful while structurally losing money.
The structural drag on active trading compounds well beyond what any single year of poor expectancy reveals; a 30-year simulation of identical monthly contributions shows the passive investor finishing with $1.78 million while even a top-performing day trader accumulates just $511,000 from the same capital deployed.
Barber and Odean’s Journal of Finance research on individual investor trading performance found that overconfidence in win frequency, without accounting for the full payoff structure, was a primary driver of the chronic underperformance gap between active retail traders and market benchmarks.
When big ASX news breaks, our subscribers know first
How expectancy reveals whether your strategy has a structural edge
One trade tells you nothing. You might win because you were lucky. You might lose because an earnings report blindsided the entire market. In isolation, a single result is statistically meaningless.
Expectancy only becomes visible across a large sample of trades. Think of it as a structural property of your strategy, not a reflection of any individual decision’s quality. When you calculate expectancy across dozens or hundreds of trades, you are measuring the system, not the outcome.
What expectancy reveals about strategy quality
This is where the emotional experience of investing collides with mathematical reality. Your brain responds to every trade individually. A string of losers feels like evidence that your approach is broken. A string of winners feels like vindication. Neither feeling constitutes evidence.
- Win rate: the fraction of your trades that finish in profit
- Loss rate: one minus your win rate
- Average win: the mean percentage gain on your profitable trades
- Average loss: the mean percentage decline on your unprofitable trades
Only the expectancy calculation, applied across a meaningful number of trades, gives you an honest verdict. The feeling of being on a streak, whether winning or losing, is noise. The number is signal. Your edge is numerical, not emotional.
Options strategies built around a structural probability edge, such as credit spreads placed at a 15-delta short strike, encode an approximately 85% probability of profit at entry by design, offering a concrete example of how positive expectancy can be engineered into a strategy rather than discovered after the fact.
The recovery trap: why a 50% loss requires a 100% gain just to break even
In investing, a drawdown measures how far a portfolio has fallen from its highest recorded value to the lowest point that follows. To put a number on it: a portfolio that slides from $100,000 down to $80,000 has experienced a 20% drawdown.
Here is the part that catches most investors off guard. Recovering from a loss always requires a proportionally larger gain, because your base of capital has shrunk. The formula is straightforward: the gain required to recover (G) equals the drawdown (D) divided by (1 minus D).
| Drawdown | Required Gain to Recover |
|---|---|
| 10% | 11.1% |
| 20% | 25% |
| 33% | 50% |
| 50% | 100% |
| 100% | Infinite (ruin) |
A 50% drawdown requires a 100% gain just to get back to where you started. You have to double what remains simply to break even.
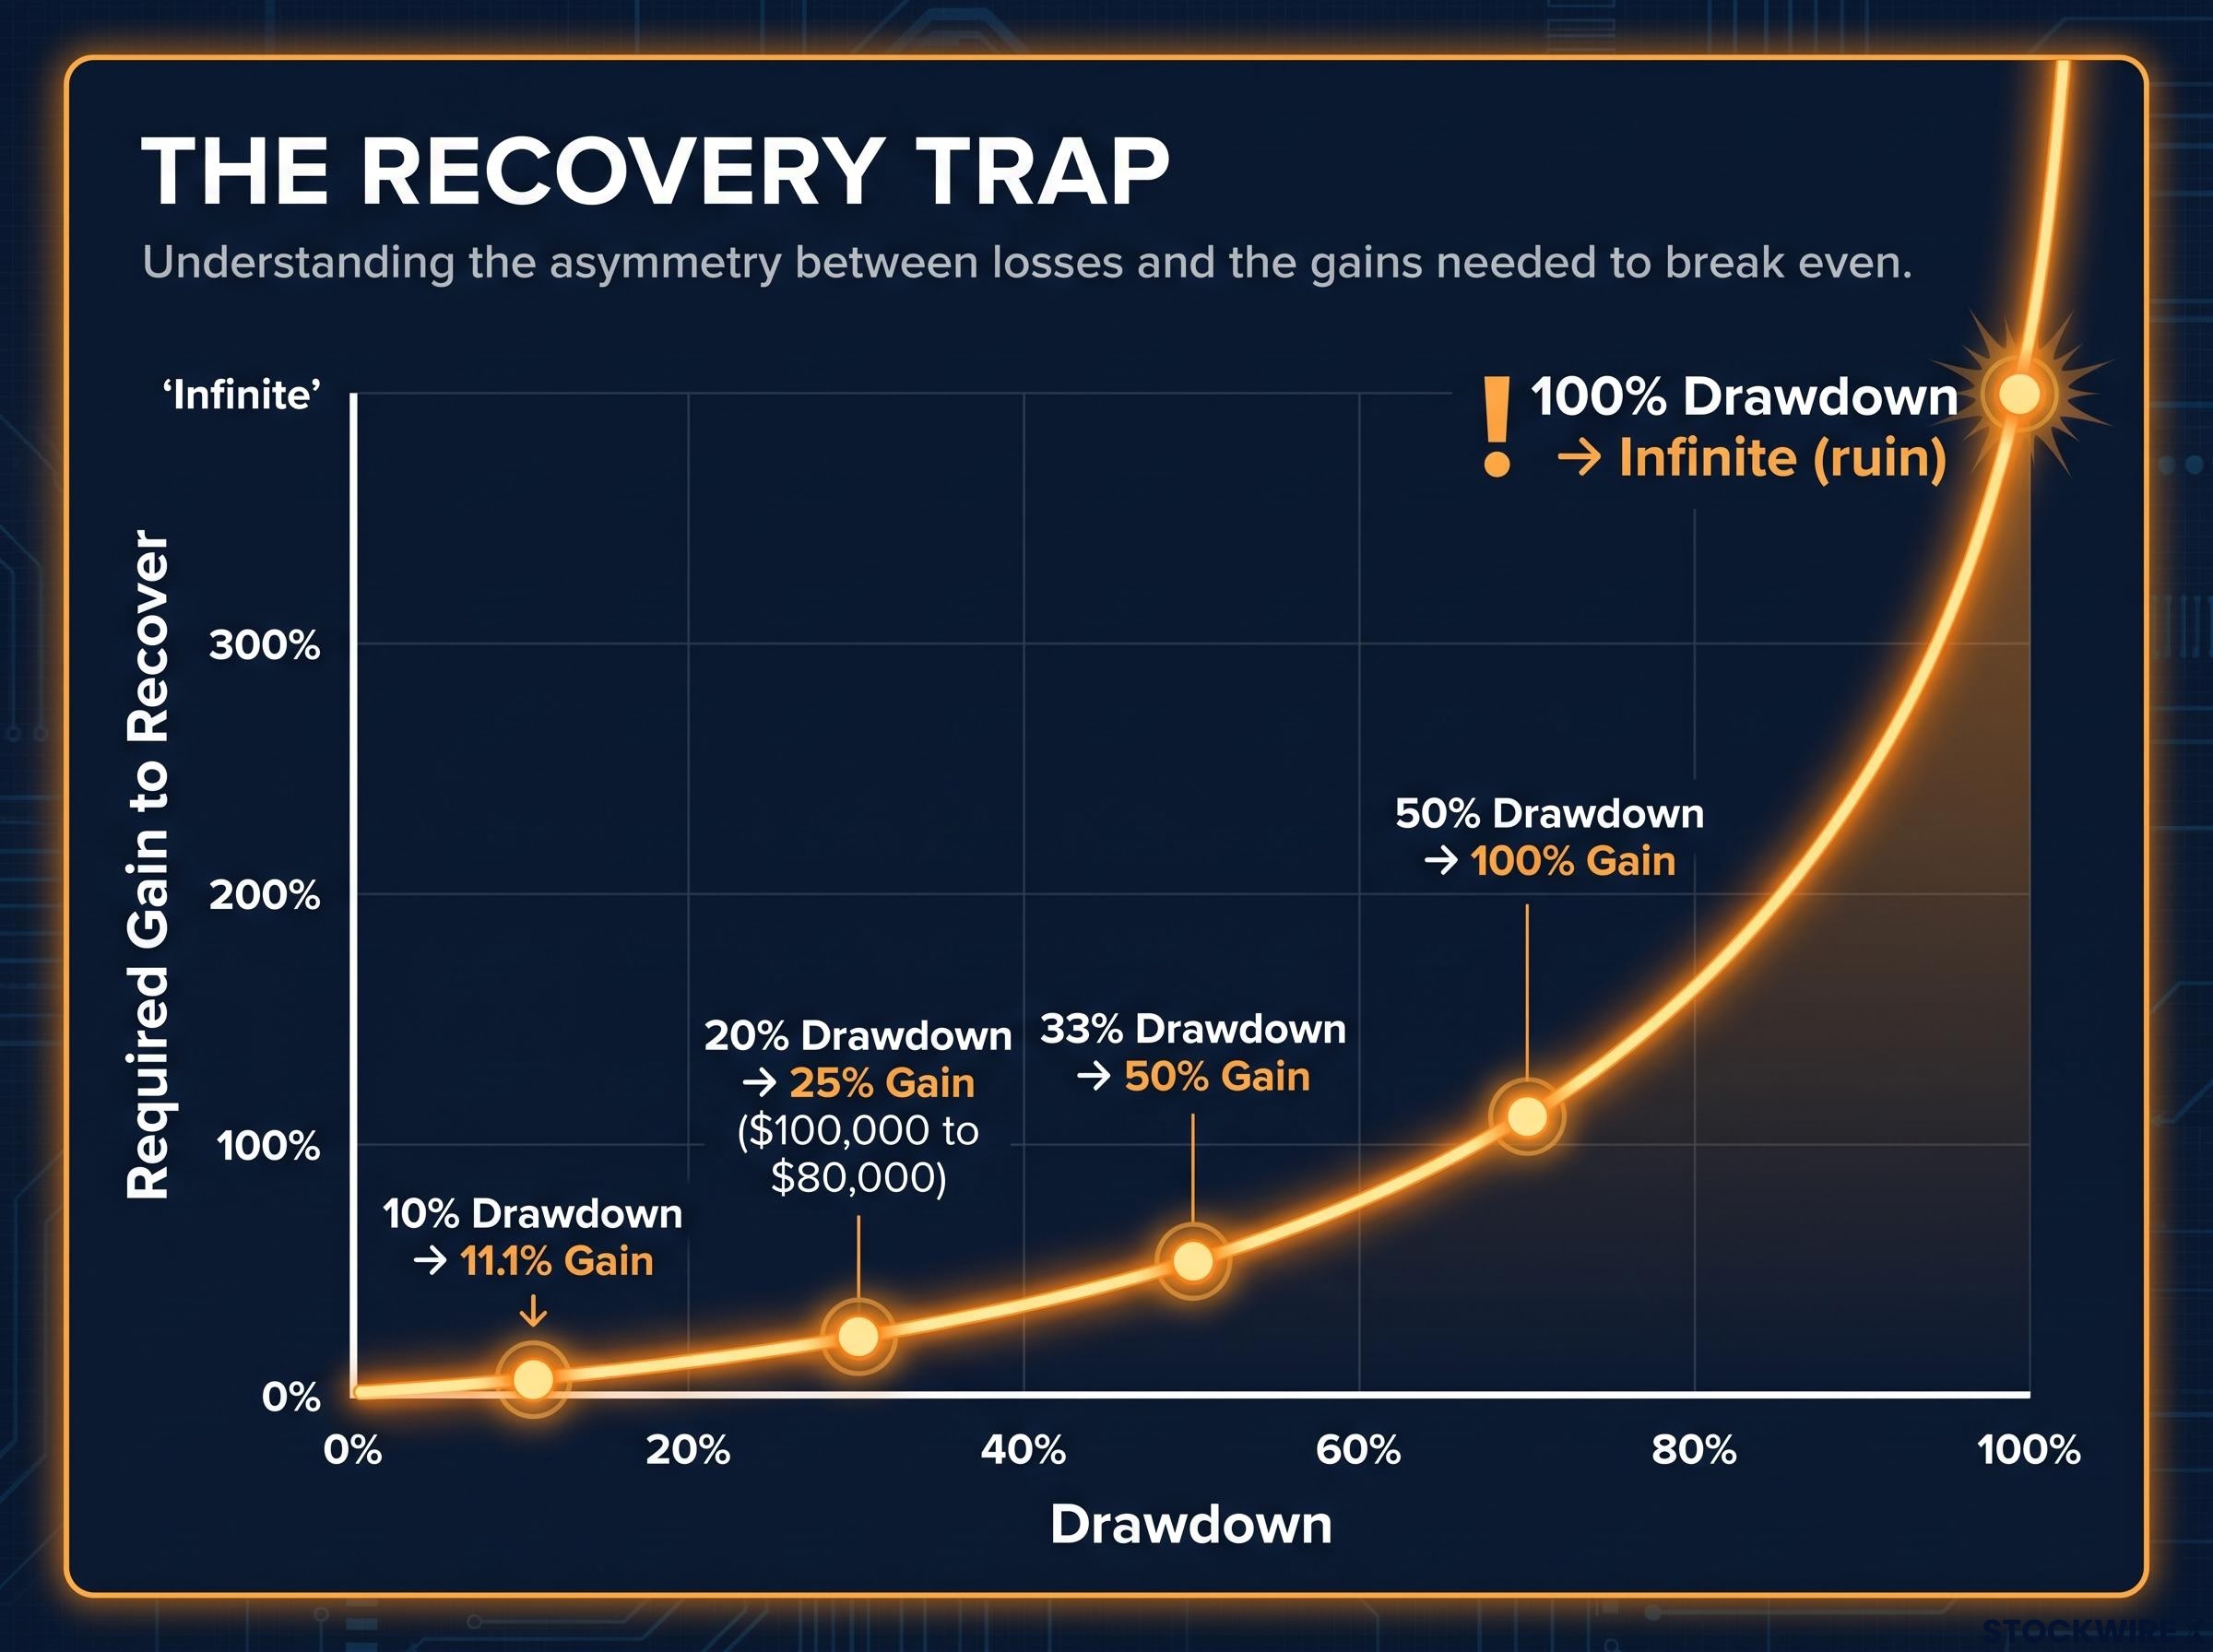
At 10%, the recovery gap is barely noticeable. At 20%, you need 25%, which is uncomfortable but achievable. At 33%, you need 50%, and the timeline starts stretching. By 50%, you are in a different mathematical environment entirely. A 100% drawdown, total loss of capital, requires an infinite return. There is nothing left to compound.
Large losses do not just delay your progress. They change the mathematical difficulty of your situation permanently until you recover. That is why cutting losses early is not a stylistic preference or a matter of risk tolerance. It is a structural mathematical requirement, and it is the most leveraged risk management decision available to you.
How large drawdowns break more than your balance sheet
The previous section covered what happens to your capital. This section covers what happens to you.
When losses mount to 40% or 50%, the psychological weight becomes crushing. Rational thinking gives way to panic, and that shift tends to produce one of two destructive responses: scrapping your rules altogether, or swinging for outsized recovery trades that expose you to even greater losses. Either path compounds the damage rather than reversing it.
The true cost of ruin extends well beyond an empty account. What it really describes is arriving at a point where two distinct forms of damage have occurred together:
- Financial impairment: your capital is gone or severely depleted
- Psychological impairment: you have lost the discipline required to execute a sound strategy
When both are present, clear-headed analysis, the very capacity you need to find your way back, is no longer something you can reliably call on. The financial hole is only part of the problem; the impaired judgement that tends to accompany it means further poor decisions are likely to follow, deepening the loss rather than reversing it.
This is why loss limits need to be enforced before they feel necessary. By the time the emotional pressure makes rule-breaking feel rational, the damage is already compounding. Protecting yourself from large drawdowns is not just protecting your capital. It is protecting your future ability to act.
Psychological impairment during drawdowns does not arrive as a sudden shift; it accumulates gradually as losses mount, which is why a pre-drawdown personal audit covering income stability, portfolio concentration, and emotional state provides far more protection than any rule written after the pain has already started.
How to audit your own strategy in five steps using 12 months of trades
You can run this audit this week. All you need is your trade history from the past 12 months and a willingness to let the numbers tell you something your intuition might not.
- Gather your data. List every closed trade from the past 12 months. For each one, record the percentage gain or loss relative to your entry price.
- Compute the three key inputs. Win rate equals the number of winning trades divided by total trades. Average win equals the mean percentage gain across all your winners. Average loss equals the mean percentage decline across all your losers.
- Calculate your expectancy. Loss rate equals one minus your win rate. Then apply the formula: (Win Rate × Average Win) minus (Loss Rate × Average Loss). If the result is above zero, your strategy has a structural edge. If it is below zero, your strategy structurally loses money, regardless of how it feels.
- Link the result to a specific diagnosis. This is where the number becomes actionable.
- Check your maximum drawdown. Track your portfolio’s equity curve over the same 12 months and compute the largest peak-to-trough decline. Then ask two questions: is this drawdown small enough that recovery is realistic? And did you remain disciplined while it was happening?
Reading your result: what the numbers diagnose
| Result Pattern | Diagnosis | Action |
|---|---|---|
| Decent win rate, but large average losses | Risk management problem | Tighten stop-loss rules, reduce position sizes |
| Low win rate and low average win | Entry quality problem | Improve selection criteria and signals |
| Good expectancy, but occasional massive losses | Tail-risk problem | Add hard rules to cap single-trade or portfolio-level drawdowns |
If your win rate looks reasonable but your average loss dwarfs your average win, you are holding losers too long. The fix is mechanical: tighter stops, smaller positions, a shorter leash on anything moving against you.
If both your win rate and your average win are low, your entries are the problem. You are picking the wrong trades, or entering at the wrong time. Improving your selection criteria, filters, or signals is where the leverage sits.
Entry quality determines how often your trades start in a favourable position before risk management even becomes relevant; volume confirmation, specifically requiring at least 1.5 to 2 times the 20-day average on a breakout bar, is one of the most directly measurable filters for separating high-probability setups from noise.
If your expectancy looks healthy overall but your equity curve shows an occasional catastrophic drawdown, you have a tail-risk problem. The strategy works until it does not, and the fix is adding hard rules that cap your maximum exposure on any single trade or across the portfolio.
This process transforms “I think I’m a good investor” into something far more useful: “My strategy has (or lacks) a measurable edge of X% per trade, and here is exactly where it breaks down.”
What the right question actually is
The two frameworks covered here, expectancy and drawdown asymmetry, are not independent risk checks. They are mutually reinforcing requirements. Positive expectancy builds capital. Drawdown control ensures that capital is preserved long enough for the expectancy to compound. Remove either one and the system fails.
Is my strategy mathematically structured to grow capital over time, and have I constrained my drawdowns so that this edge can actually compound?
That is the question worth asking. Not “how often am I right?” Not “did I pick good stocks this quarter?” The question is whether your process, across enough trades to be statistically meaningful, makes or loses money on average, and whether your loss controls keep drawdowns in a zone where recovery does not require extraordinary future performance.
You now have both the diagnostic question and the method for answering it. Every future portfolio review can be a quantitative exercise rather than a confidence exercise. Calculate your expectancy. Check your maximum drawdown. Let the numbers deliver the verdict your intuition cannot.
This article is for informational purposes only and should not be considered financial advice. Investors should conduct their own research and consult with financial professionals before making investment decisions. Past performance does not guarantee future results.