Why the 2026 Midterm Could Break a Rare Presidential Streak
1 hr ago


Bank of America’s top strategist is keeping the door open for buying equity dips, but he has attached two specific, observable conditions to that call and a warning that most investors are already late.
Michael Hartnett, Chief Investment Strategist at BofA Global Research, published a note on 10 July 2026 that frames the current market regime not as a broad risk-on rally but as a conditional rotation. Two technical tripwires must hold simultaneously for tactical dip-buying to remain defensible. Sitting alongside those thresholds is the BofA Bull and Bear Indicator at 9.5 out of 10, the kind of extreme bullish reading that has historically preceded below-average forward returns.
Here is exactly what Hartnett is watching, what the numbers mean, and what a breach of either threshold would signal. If you are deciding whether to add on pullbacks or stand aside, these are the specific levels to know.
Hartnett’s 10 July note does not read as an all-clear. The regime he identifies is rotation across sectors, regions, and styles rather than wholesale de-risking. Investors are moving capital around within equities, not pulling it out.
The psychology behind the moves is what he calls an “anything but bonds” dynamic: persistent reluctance to buy fixed income paired with reluctance to sell equities. That combination fuels internal rotation rather than a true risk-on mandate, because capital needs somewhere to go and bonds are not the destination.
Leverage has been squeezed out as financial conditions have tightened, clearing speculative excess from the more stretched corners of the market. Korean small-cap technology stocks shed roughly 36% across the eight weeks prior to the note, which Hartnett reads as the frothiest pockets having already been drained. That clearing, in his view, leaves the broader equity structure on a firmer footing.
The Korean small-cap technology selloff Hartnett cites as evidence of speculative clearing was part of a broader momentum factor unwind that erased approximately 9.5%-10% from high-beta equities in a single June 2026 session, the worst such one-day loss since the COVID-19 era.
The rotation framing changes the practical question. The opportunity is not in chasing what has already run but in identifying where capital is repositioning next, which shifts the focus from whether to be in the market to where within it.
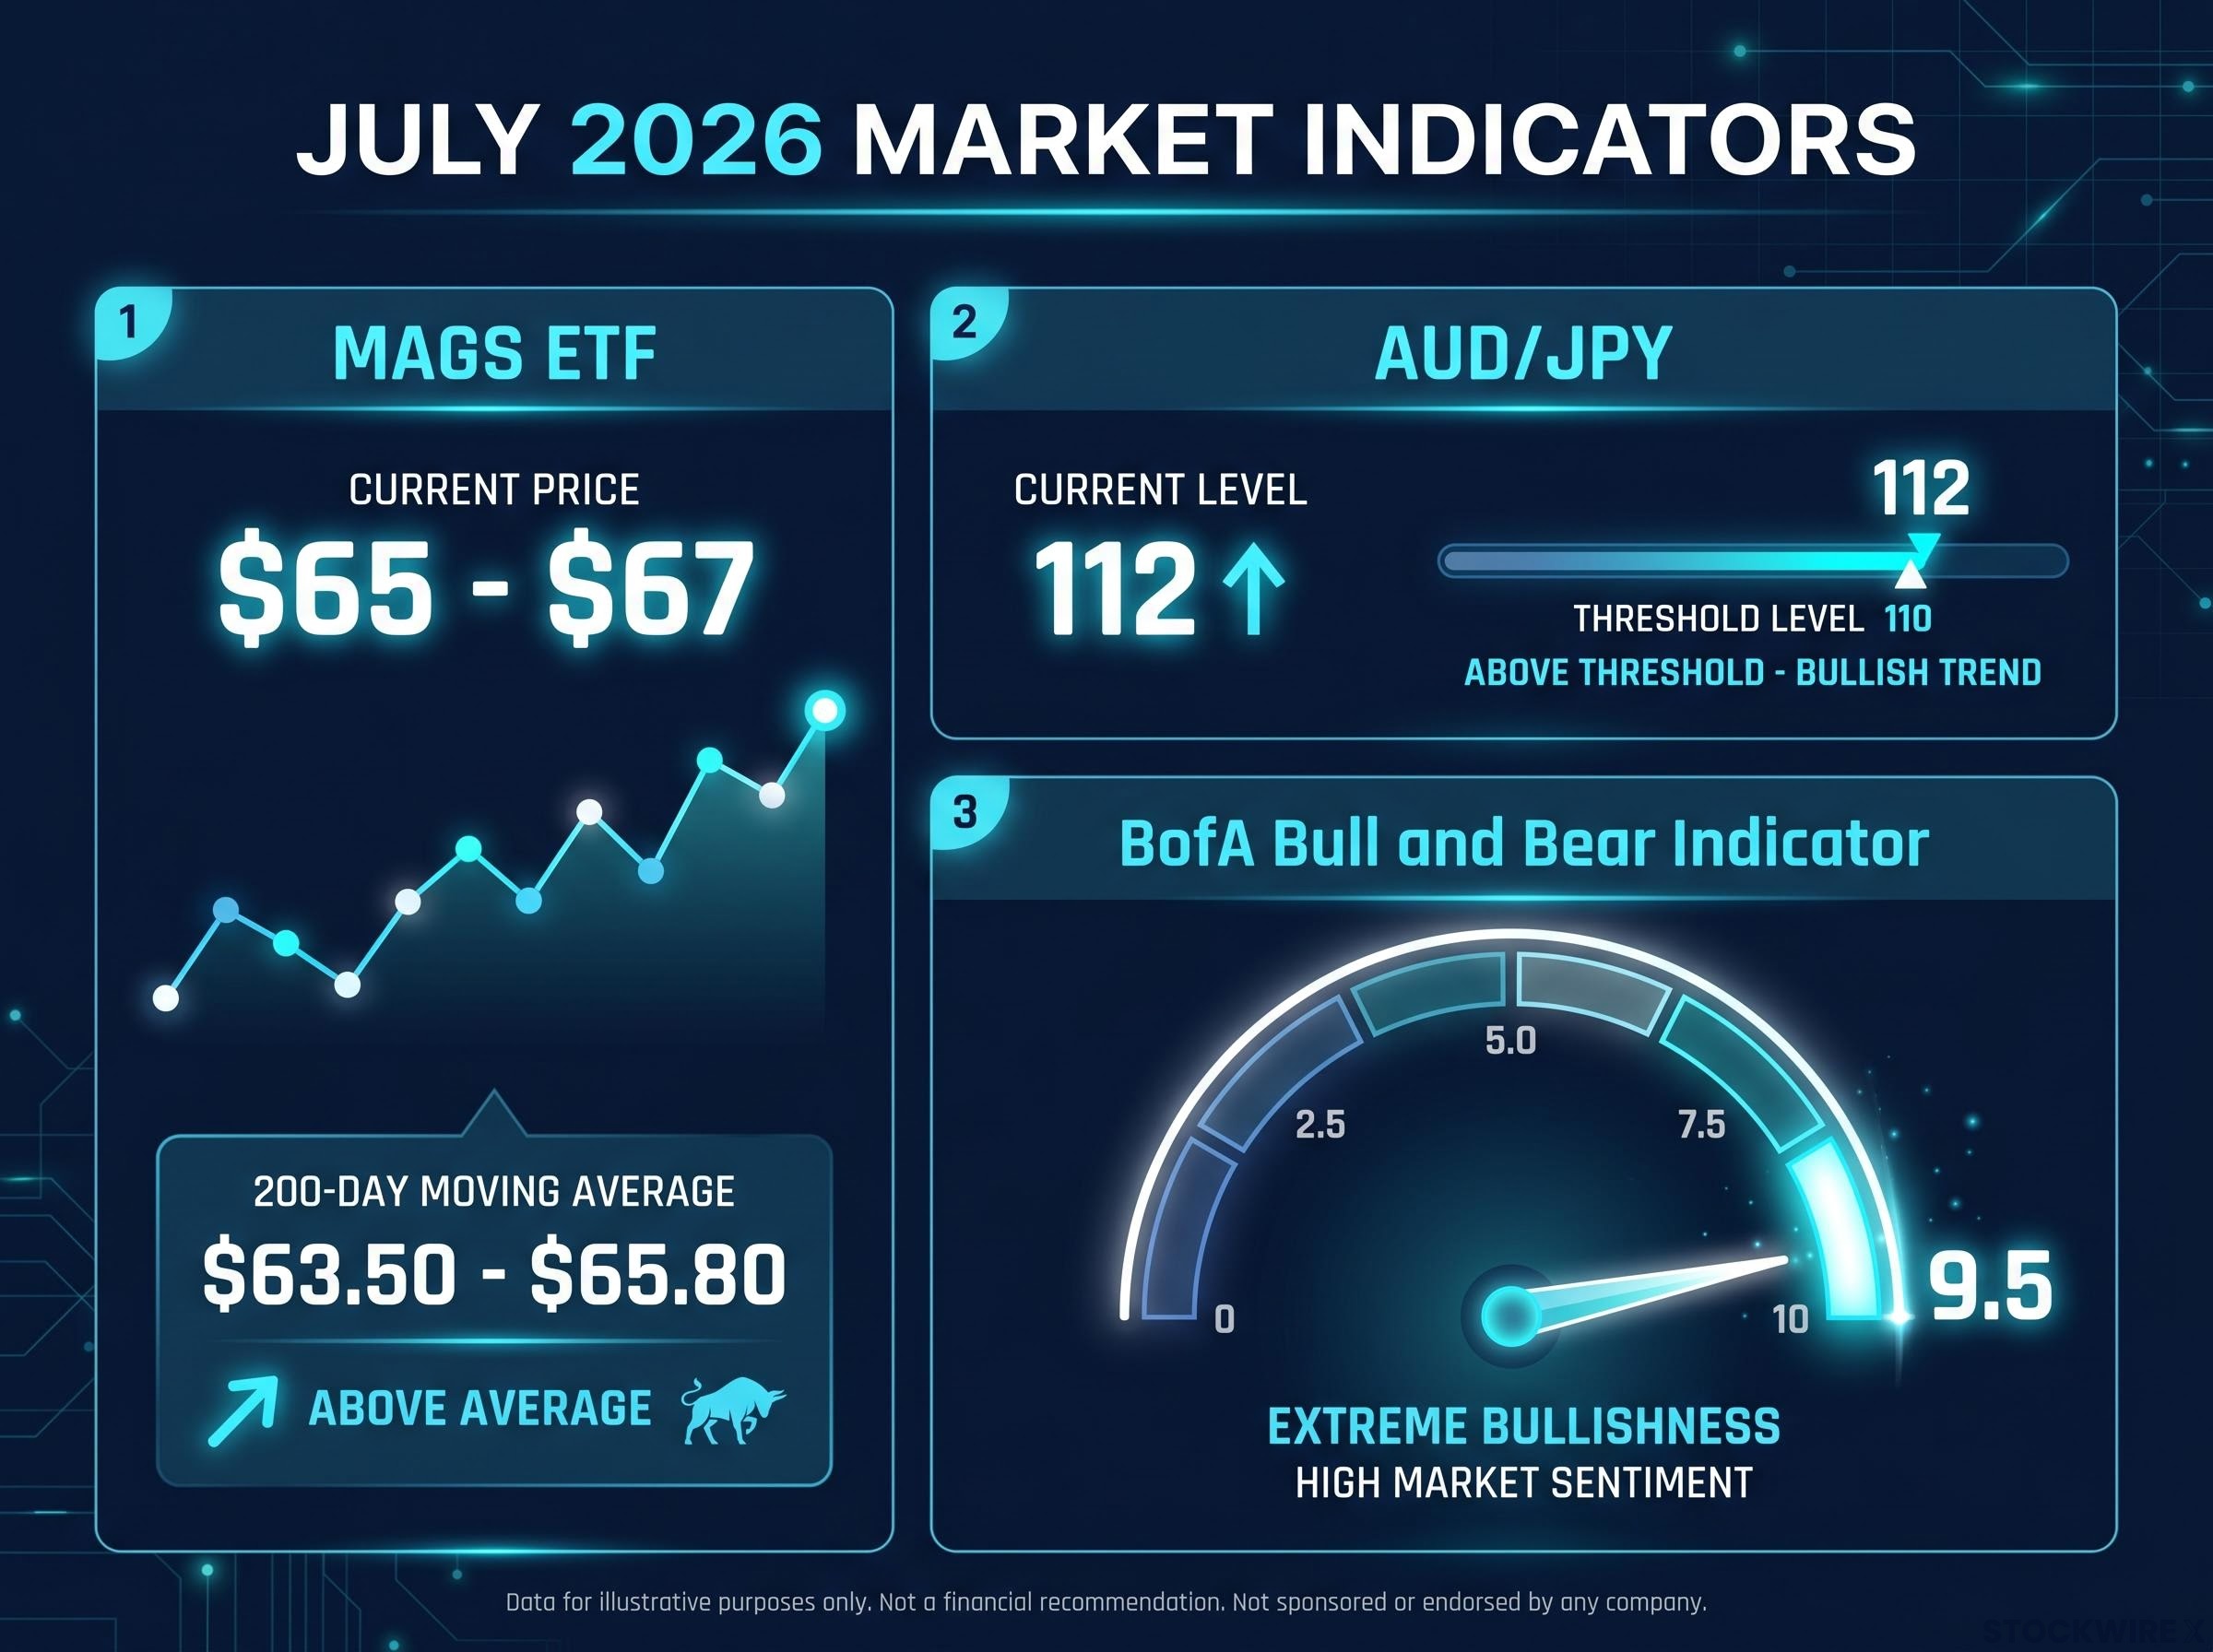
Hartnett’s first tripwire is the 200-day moving average on the Roundhill Magnificent Seven ETF (MAGS), which he places in the mid-$60s zone.
A 200-day moving average is the average closing price of an asset over roughly the past year of trading sessions, smoothing out short-term noise to show the longer-term trend direction.
As of early July, MAGS was trading near $65-$67, while its 200-day simple moving average sits in an estimated $63.50-$65.80 range depending on the calculation date. That places the ETF a small distance above the threshold. Different technical services are reading this setup differently; some flag a “strong sell” on shorter-term indicators, while others show a “strong buy.” Hartnett anchors specifically to the 200-day because it captures the structural trend rather than short-term oscillations.
The proximity matters. A modest pullback in mega-cap tech could test the level within days, making this the most time-sensitive variable in the framework.
| Scenario | MAGS price level | Signal interpretation |
|---|---|---|
| MAGS holds above 200-day | $65+ | Dip-buying defensible; mega-cap trend intact |
| MAGS breaks and holds below 200-day | Below ~$63.50-$65 | Regime-change warning; reduce exposure |
The Australian dollar/Japanese yen cross rate is not a pair most equity investors track, but in Hartnett’s framework it functions as a global risk barometer. The Australian dollar strengthens when global growth and commodity demand look healthy (risk-on), while the yen strengthens during stress episodes as carry trades unwind (risk-off). The pair compresses both sides of the global risk equation into a single number.
Yen carry-trade dynamics are central to why AUD/JPY functions as a global risk barometer: when yen strength forces carry-trade liquidation, the shock transmits directly into the Australian dollar and higher-beta equity sectors within hours, which is precisely the mechanism Hartnett’s threshold is designed to capture.
Hartnett’s threshold is specific: AUD/JPY above 110 confirms global risk appetite remains intact and dip-buying remains defensible. A sustained break below 110 is a broader macro warning that warrants stepping back from equities.
As of early July 2026, AUD/JPY was trading near 112, keeping approximately 2 points of buffer above Hartnett’s threshold.
A break below 110 would not be a currency-isolated event. It would signal deteriorating risk appetite that typically spills across asset classes simultaneously. The practical implication is not to rebalance currency holdings but to treat it as a prompt to reassess the size and timing of any equity positions you were planning to add.
Here is where the tension sits. Both technical thresholds are intact, but the sentiment picture is flashing a contrarian warning.
The BofA Bull and Bear Indicator registered 9.5 for the week ending 10 July 2026. On BofA’s 0-10 scale, readings above 9 are classified as contrarian sell signals.
The indicator aggregates flows, positioning, and sentiment across markets to gauge how collectively bullish or bearish investors are. Readings near 0 signal extreme bearishness, historically a contrarian buy signal. Readings near 10 signal extreme bullishness, meaning crowded trades and thin margins for positive surprise.
The BofA Bull and Bear Indicator reached the 8.0 contrarian sell threshold for only the 18th time since 2002 in May 2026, and that reading was followed by the accelerating inflows that have since pushed the gauge to 9.5, compressing the margin for positive surprise even further.
At 9.5, forward returns from this starting point have historically been below average. That does not mean a crash is coming. It means the market is particularly exposed to negative catalysts because consensus is already fully long.
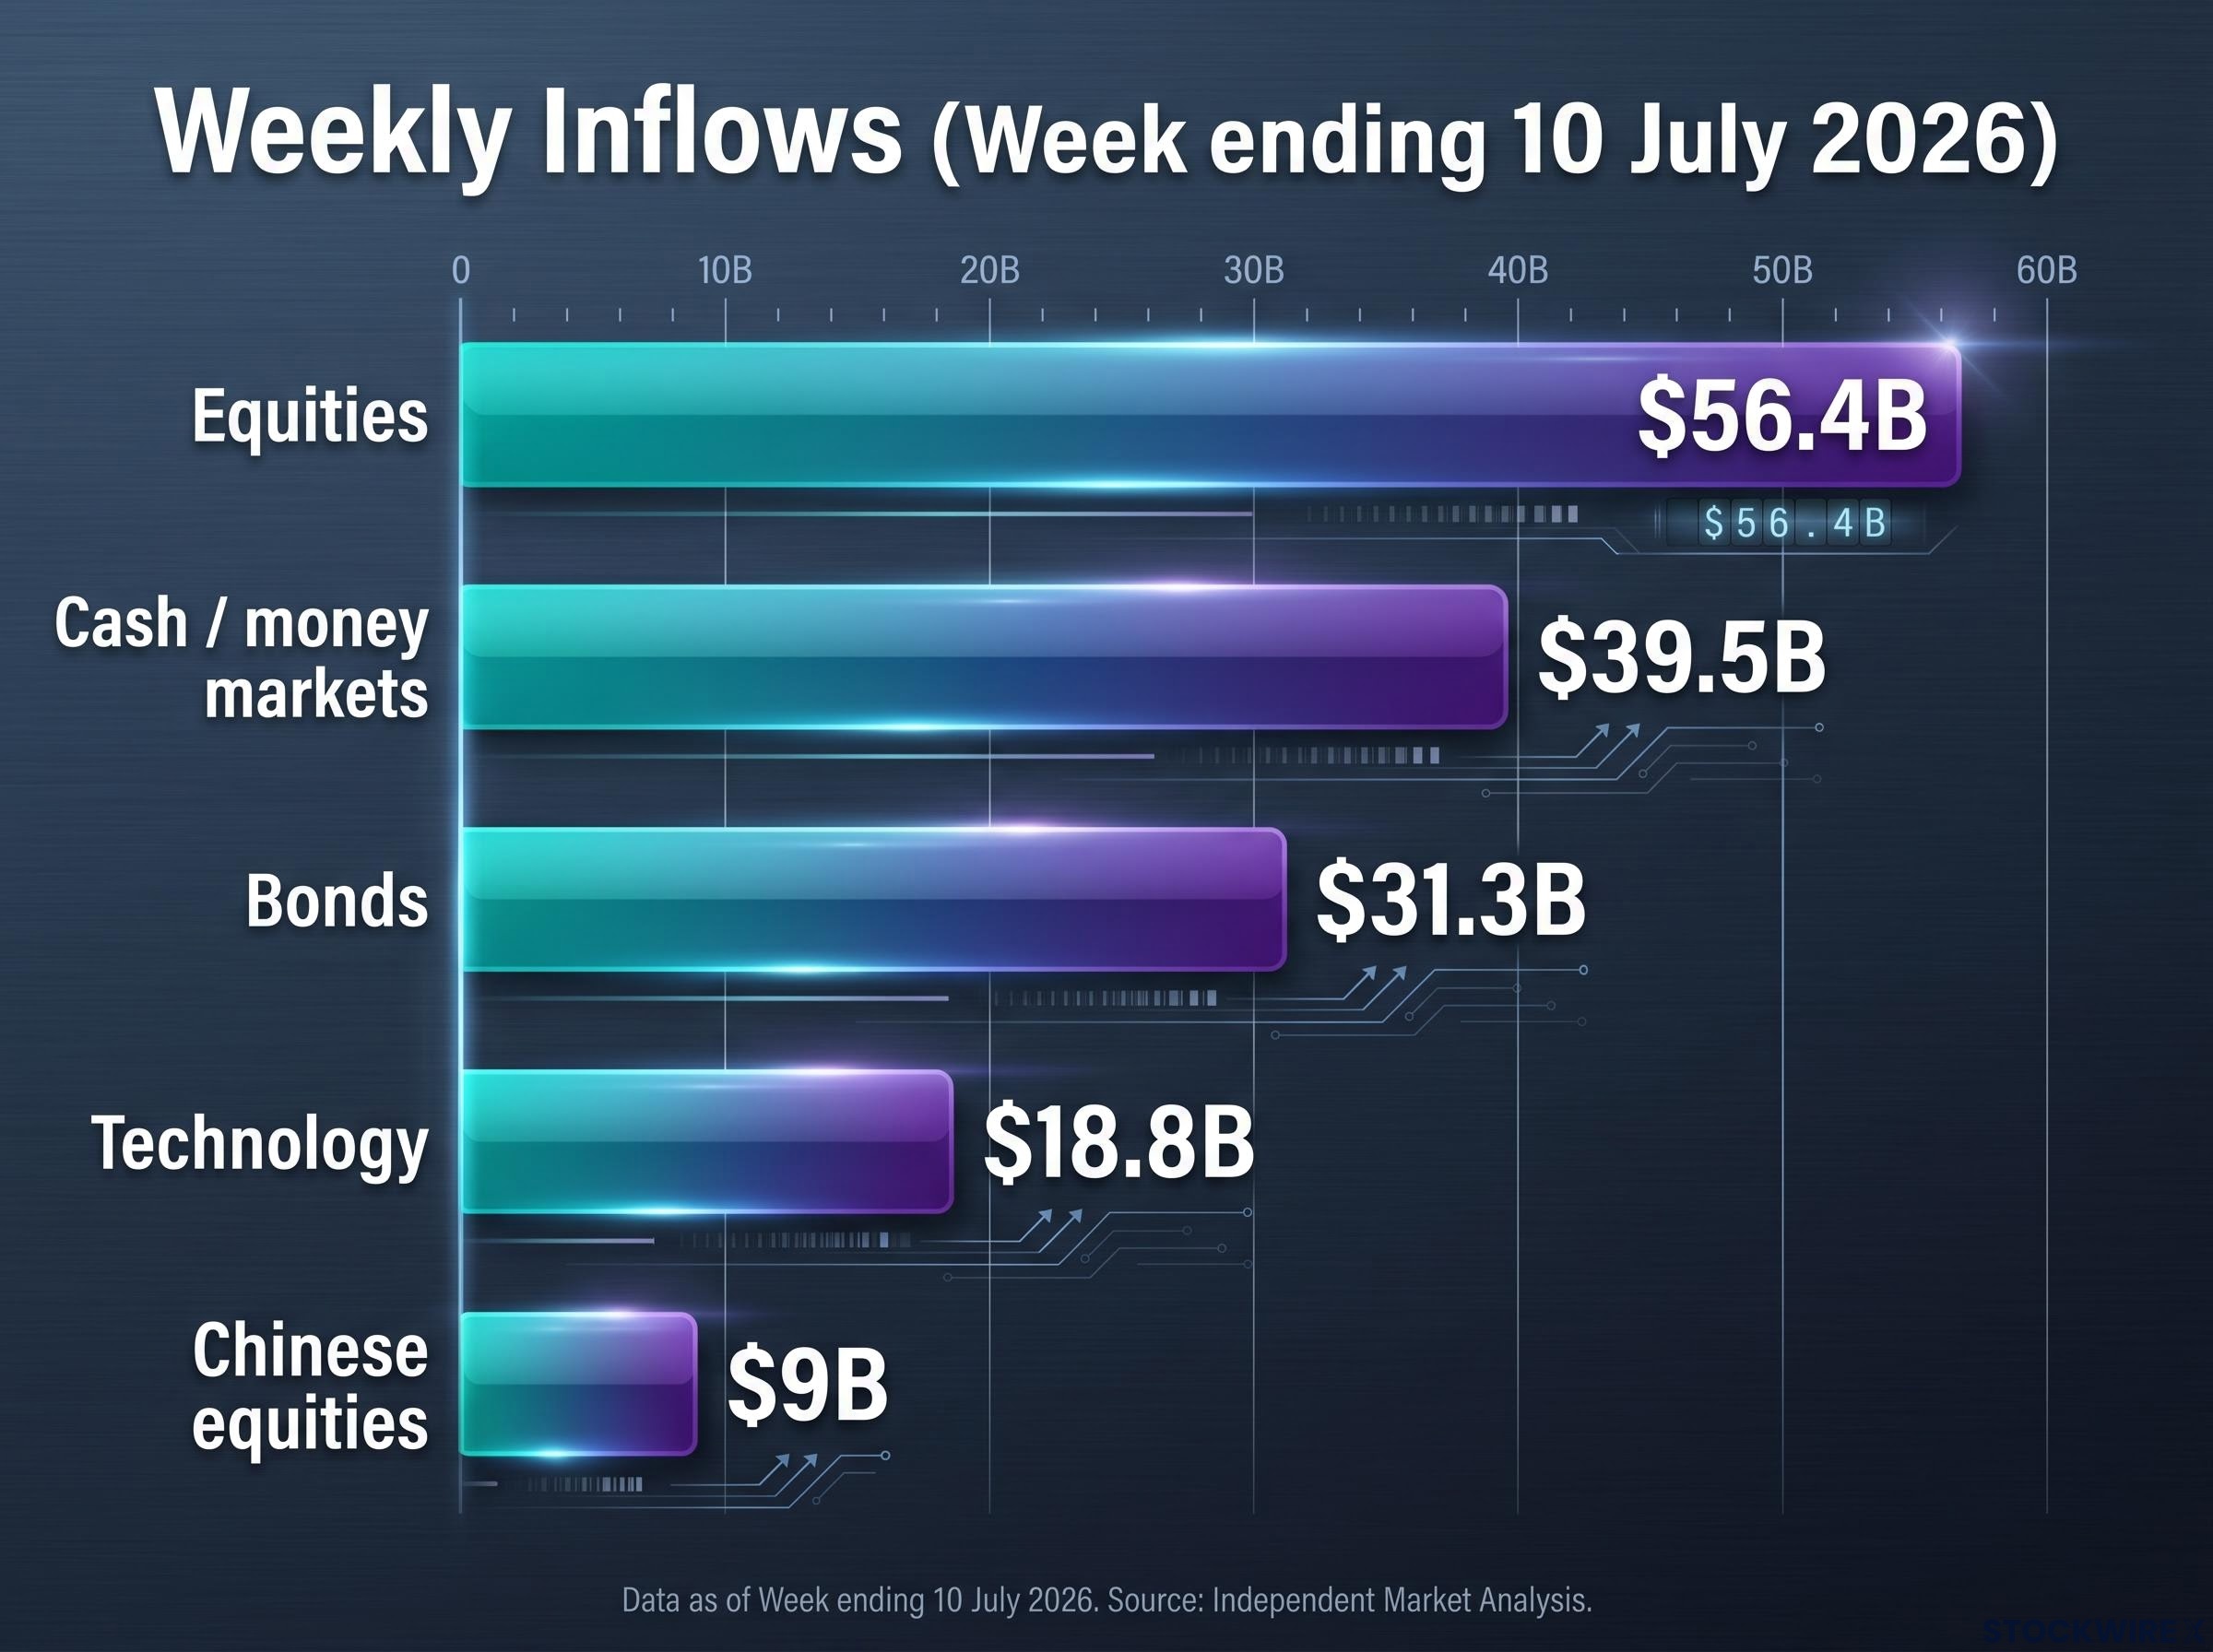
The flow data from the same week tells a contradictory story. A lot of capital has already chased the move, but a vast pool of sidelined cash also exists.
| Asset class | Weekly inflow / level | Context |
|---|---|---|
| Equities | $56.4B | 4th largest weekly total of 2026 |
| Technology | $18.8B | On pace for record $183B annual total |
| Chinese equities | $9B | Largest weekly inflow since December |
| Bonds | $31.3B | Concurrent demand alongside equities |
| Cash / money markets | $39.5B | Total assets at record $7.9 trillion |
A 9.5 reading does not tell you to sell. It tells you that adding large new high-beta positions into current strength is doing the opposite of what Hartnett’s framework recommends, because you would be joining a trade that is already extremely crowded.
The 200-day moving average is one of the most widely referenced technical levels in institutional investing, and understanding why it carries weight helps explain why Hartnett anchors his entire framework to it.
SSRN research on moving average distance as a predictor of equity returns finds that the gap between short- and long-run moving averages generates statistically significant return signals that survive realistic trading costs at the institutional level, which helps explain why the 200-day carries disproportionate weight in systematic risk frameworks.
Rules-based funds and systematic strategies are programmed to de-risk when price breaks below the 200-day. That automated selling adds pressure that can turn a modest technical breach into a more significant move. It is the shared reference point quality of the level that makes it powerful, not any inherent mathematical property.
This is why Hartnett specifies a “sustained break below” rather than any intraday dip through the level. A one-day breach followed by recovery is far less significant than a multi-day failure to reclaim the threshold. For MAGS, with the 200-day estimated in the $63.50-$65.80 range as of July 2026, the distinction between a brief touch and a sustained failure matters enormously.
You do not need to understand every technical detail to use the 200-day productively. The key is recognising that it functions as a widely shared reference point, which means a break below it tends to carry more weight than a break below a private indicator nobody else uses.
Hartnett’s framework converts into a decision tree with three clear scenarios:
As of 10 July 2026, both thresholds are intact. MAGS sits near $65-$67, above its $63.50-$65.80 200-day band. AUD/JPY trades near 112, above the 110 line. The framework supports cautious participation, not a signal to step aside entirely.
The value here is specificity. Instead of relying on ambiguous sentiment reads, you have two price-level variables you can check daily, giving you a rules-based way to know when conditions have changed.
Hartnett is offering something uncommon in equity strategy: a conditional call with named, observable exit conditions rather than a directional view with no specified invalidation point. MAGS above its 200-day and AUD/JPY above 110 keep the door open. The 9.5 Bull and Bear reading keeps the door narrow.
Both thresholds are intact today. That means the framework supports buying pullbacks with measured size, not chasing breakouts with conviction capital. The rotation across sectors and regions is where the opportunity lives, not in adding to the trades that have already drawn record inflows.
The analytical work is only useful if you are willing to act on the thresholds rather than rationalise your way through a breach. The levels are set. The sessions ahead will show whether they hold.
For investors wanting to assess whether their own income stability, portfolio concentration, and risk horizon actually support acting on Hartnett’s thresholds, our dedicated guide to investing during market pullbacks works through the personal audit that should precede any capital deployment into a falling market.
This article is for informational purposes only and should not be considered financial advice. Investors should conduct their own research and consult with financial professionals before making investment decisions. Past performance does not guarantee future results. Financial projections are subject to market conditions and various risk factors.
The BofA Bull and Bear Indicator aggregates fund flows, positioning, and sentiment data on a 0-10 scale to measure how collectively bullish or bearish investors are. A reading of 9.5, as recorded for the week ending 10 July 2026, sits above the 9.0 contrarian sell threshold, meaning consensus is extremely crowded long and historical forward returns from this level have been below average.
Hartnett requires the Roundhill Magnificent Seven ETF (MAGS) to hold above its 200-day moving average, estimated in the $63.50-$65.80 range, and AUD/JPY to stay above 110. As of 10 July 2026, both thresholds were intact, with MAGS near $65-$67 and AUD/JPY near 112.
AUD/JPY compresses both sides of the global risk equation into a single exchange rate: the Australian dollar strengthens when global growth and commodity demand are healthy, while the yen strengthens during stress episodes as carry trades unwind. A sustained break below Hartnett's 110 threshold typically signals deteriorating risk appetite that spills across equities and other asset classes simultaneously.
Hartnett treats a sustained break below the 200-day as a regime-change signal, not a buying opportunity, and the framework calls for reducing equity exposure and waiting to see whether price can reclaim the level. The emphasis is on a sustained break, not an intraday dip, because rules-based and systematic funds programmed to de-risk at that level can turn a modest breach into a more significant selloff.
Equity funds attracted $56.4 billion in the week ending 10 July 2026, the fourth largest weekly total of 2026, with technology alone pulling in $18.8 billion and tracking toward a record $183 billion annual pace, underscoring how crowded the trade already was when the Bull and Bear Indicator hit 9.5.