Hartnett: Buy the Dip, but Only If These Two Levels Hold
1 hr ago

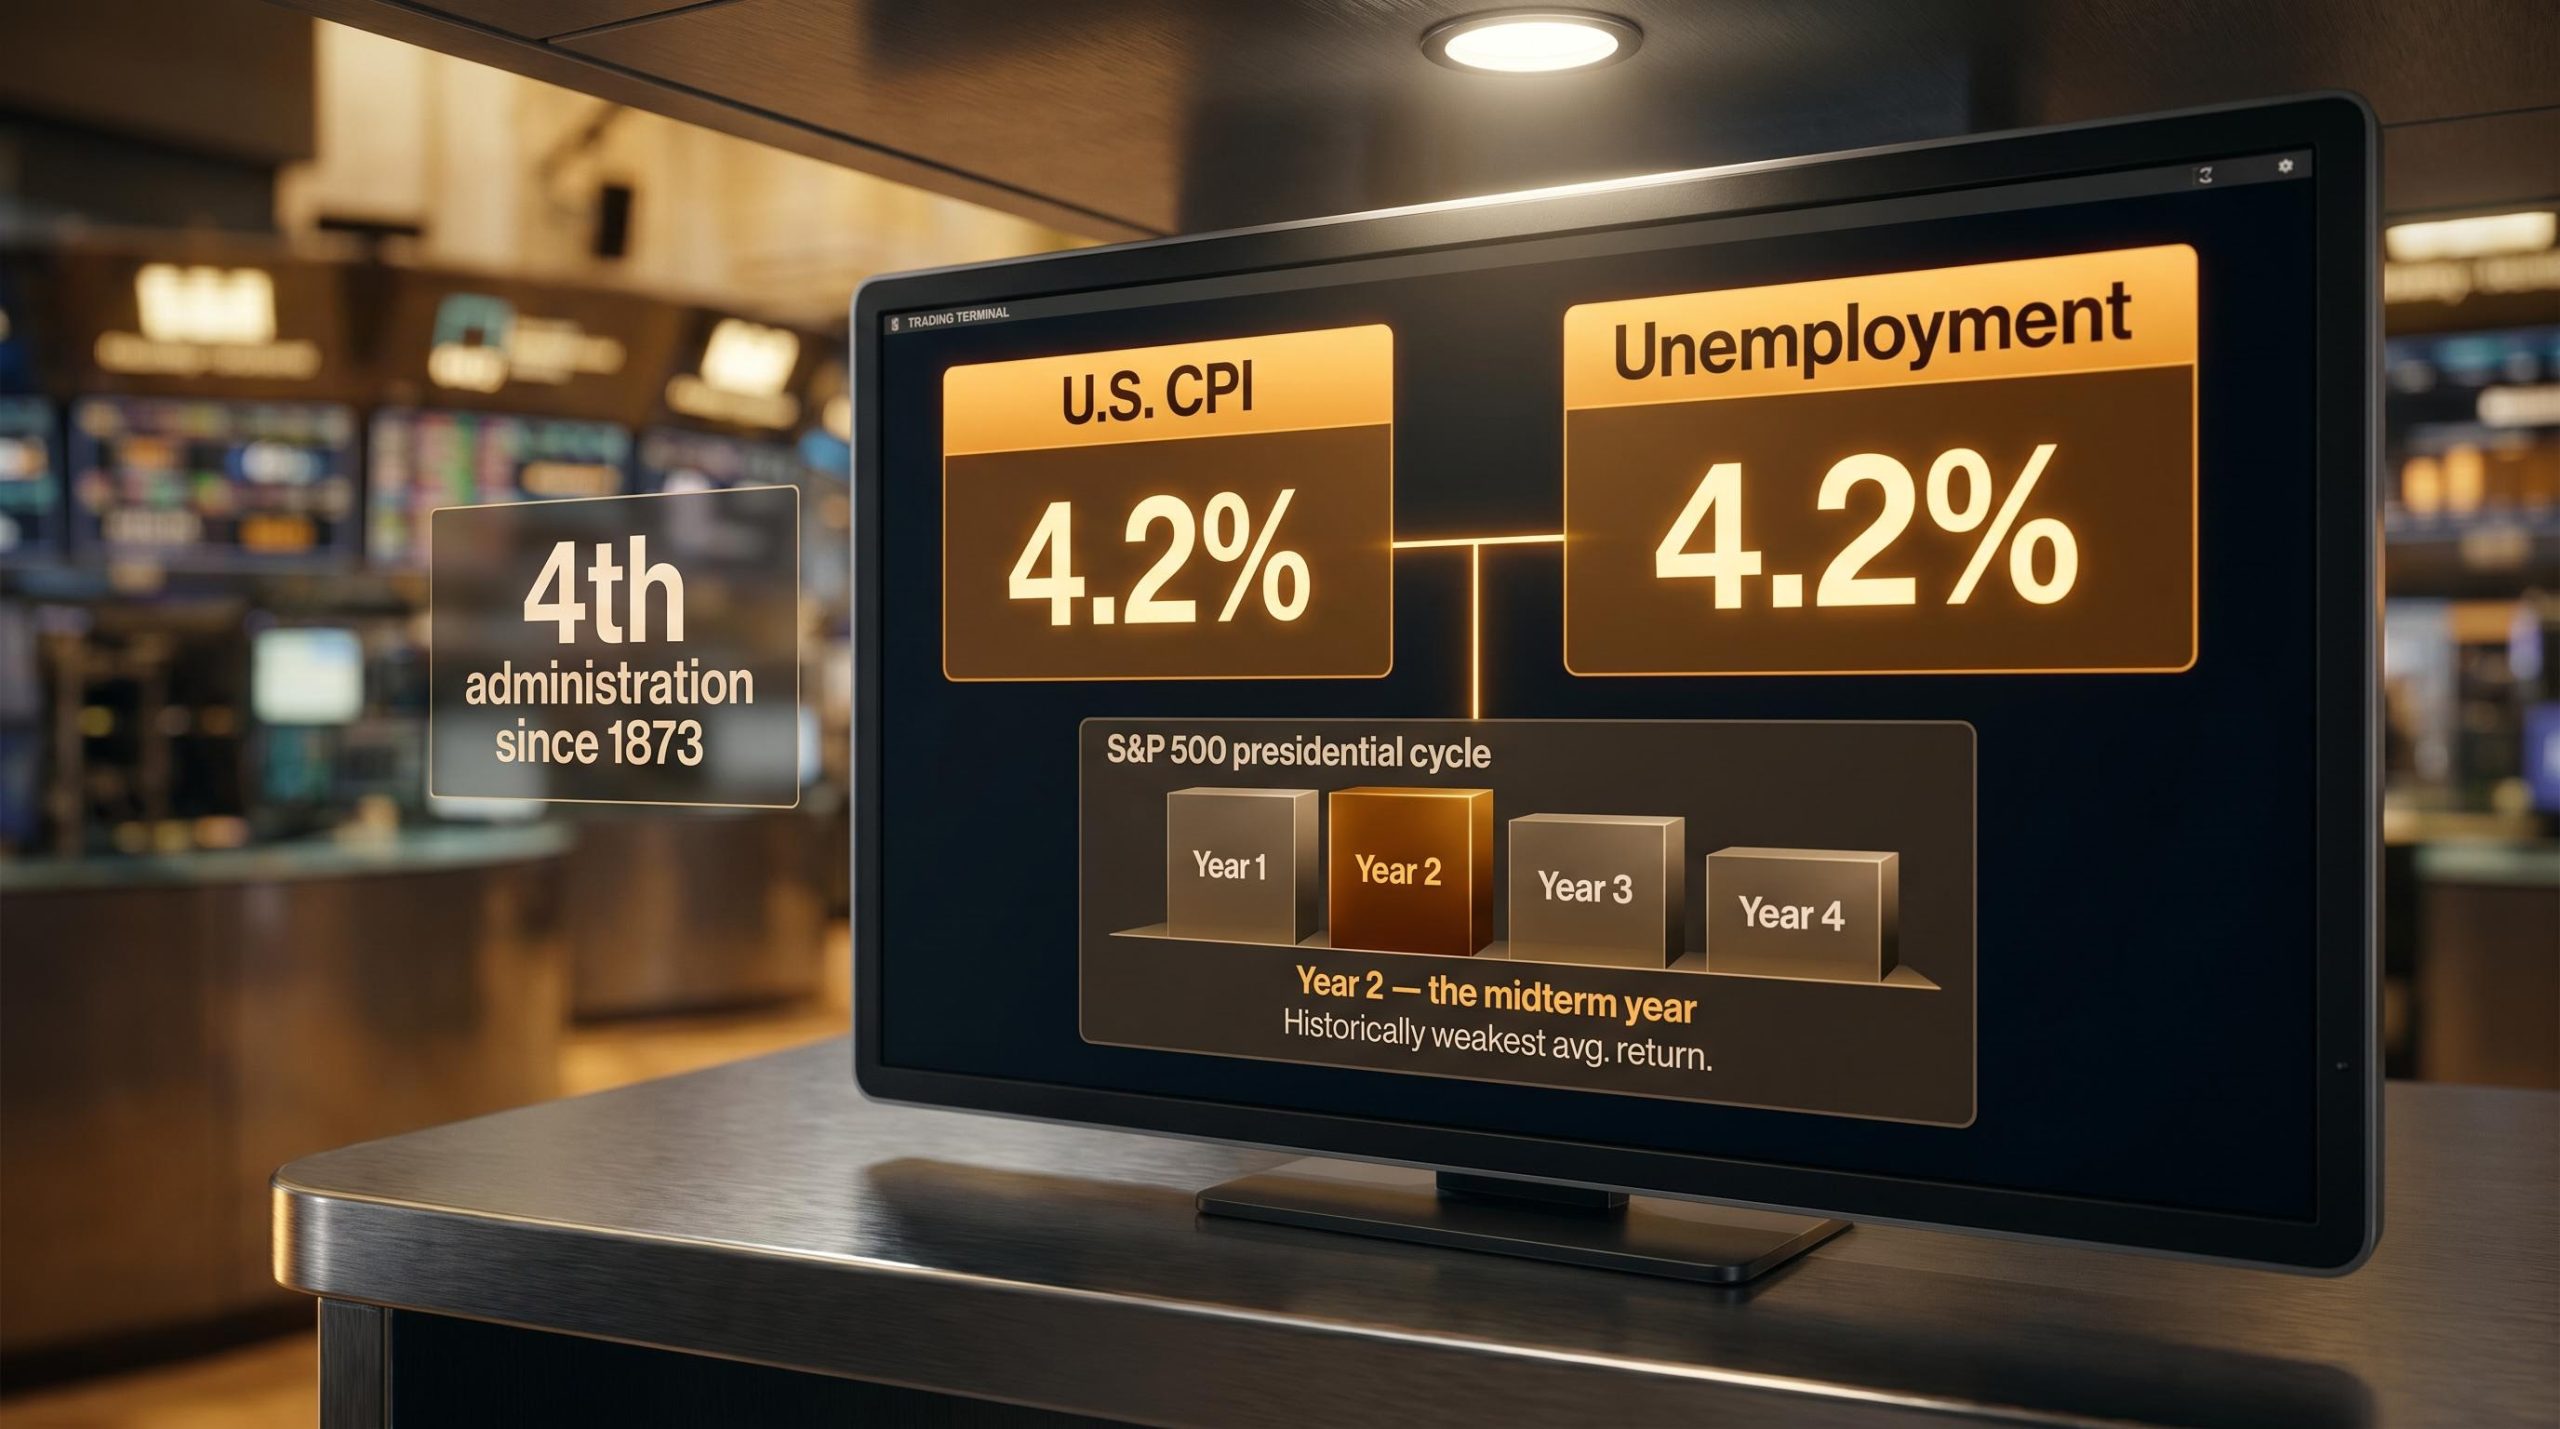
U.S. CPI and the unemployment rate have both settled at 4.2% simultaneously, a numerical coincidence that Bank of America’s Michael Hartnett is treating as anything but accidental. In his latest research note, the strategist reads this convergence not as a headline curiosity but as a late-cycle warning sitting quietly underneath a market that has barely paused to notice.
Hartnett’s argument operates on two timescales at once. On the long scale: by Hartnett’s count, Trump’s second term is positioned to join a very short list, only the fourth presidential administration since 1873, to deliver positive stock market returns in each individual year of a full term. On the near-term scale: in his view, the midterm elections stand as the single event most capable of determining Wall Street’s direction in the second half of 2026. These two observations are not separate claims. They are connected: the midterm outcome is the event most likely to either extend or end the streak.
Here is the framework for evaluating Hartnett’s thesis on its own terms, separating the parts grounded in independently verifiable history from the parts that belong to his interpretive construction, and giving you a structured way to think about equity risk over the next six months without treating the outcome as predetermined.
Hartnett’s headline claim is striking enough to warrant careful handling.
According to Bank of America’s Michael Hartnett, Trump’s second term is positioned to enter rare historical company, potentially becoming only the fourth presidential administration since 1873 to achieve gains in every single year across a full four-year term.
That statistic does not appear in standard public financial databases. It belongs to Hartnett’s proprietary presidential cycle framework, and it should be read accordingly. The question is whether the underlying logic holds even if the precise anchor date cannot be independently confirmed.
It does, at least directionally. The independently verifiable record tells a consistent story about the rarity of extended winning streaks:
The distinction matters. A verified base rate tells you the odds. A proprietary framework tells you one strategist’s reading of those odds. 2023 and 2024 delivered confirmed strong returns for the S&P 500, with gains concentrated in large-cap growth and AI-related names, so the first two years of the streak stand on solid ground. Whether the framework built around them functions as a law or a lens determines how much conviction it should carry.
Strip away Hartnett’s proprietary framing and there is still a well-documented empirical pattern underneath it. The presidential election cycle, studied across academic and practitioner literature from 1926 onward, shows a consistent rhythm in equity returns depending on where a given year falls relative to a presidential term.
Year 2, the midterm year, has historically produced the weakest average returns of the four-year cycle. Year 3, the pre-election year, has historically produced the strongest. The 12 months following midterm elections have delivered above-average returns on average, regardless of which party wins, a pattern broadly attributed to the clearing of policy uncertainty that midterm campaigns generate.
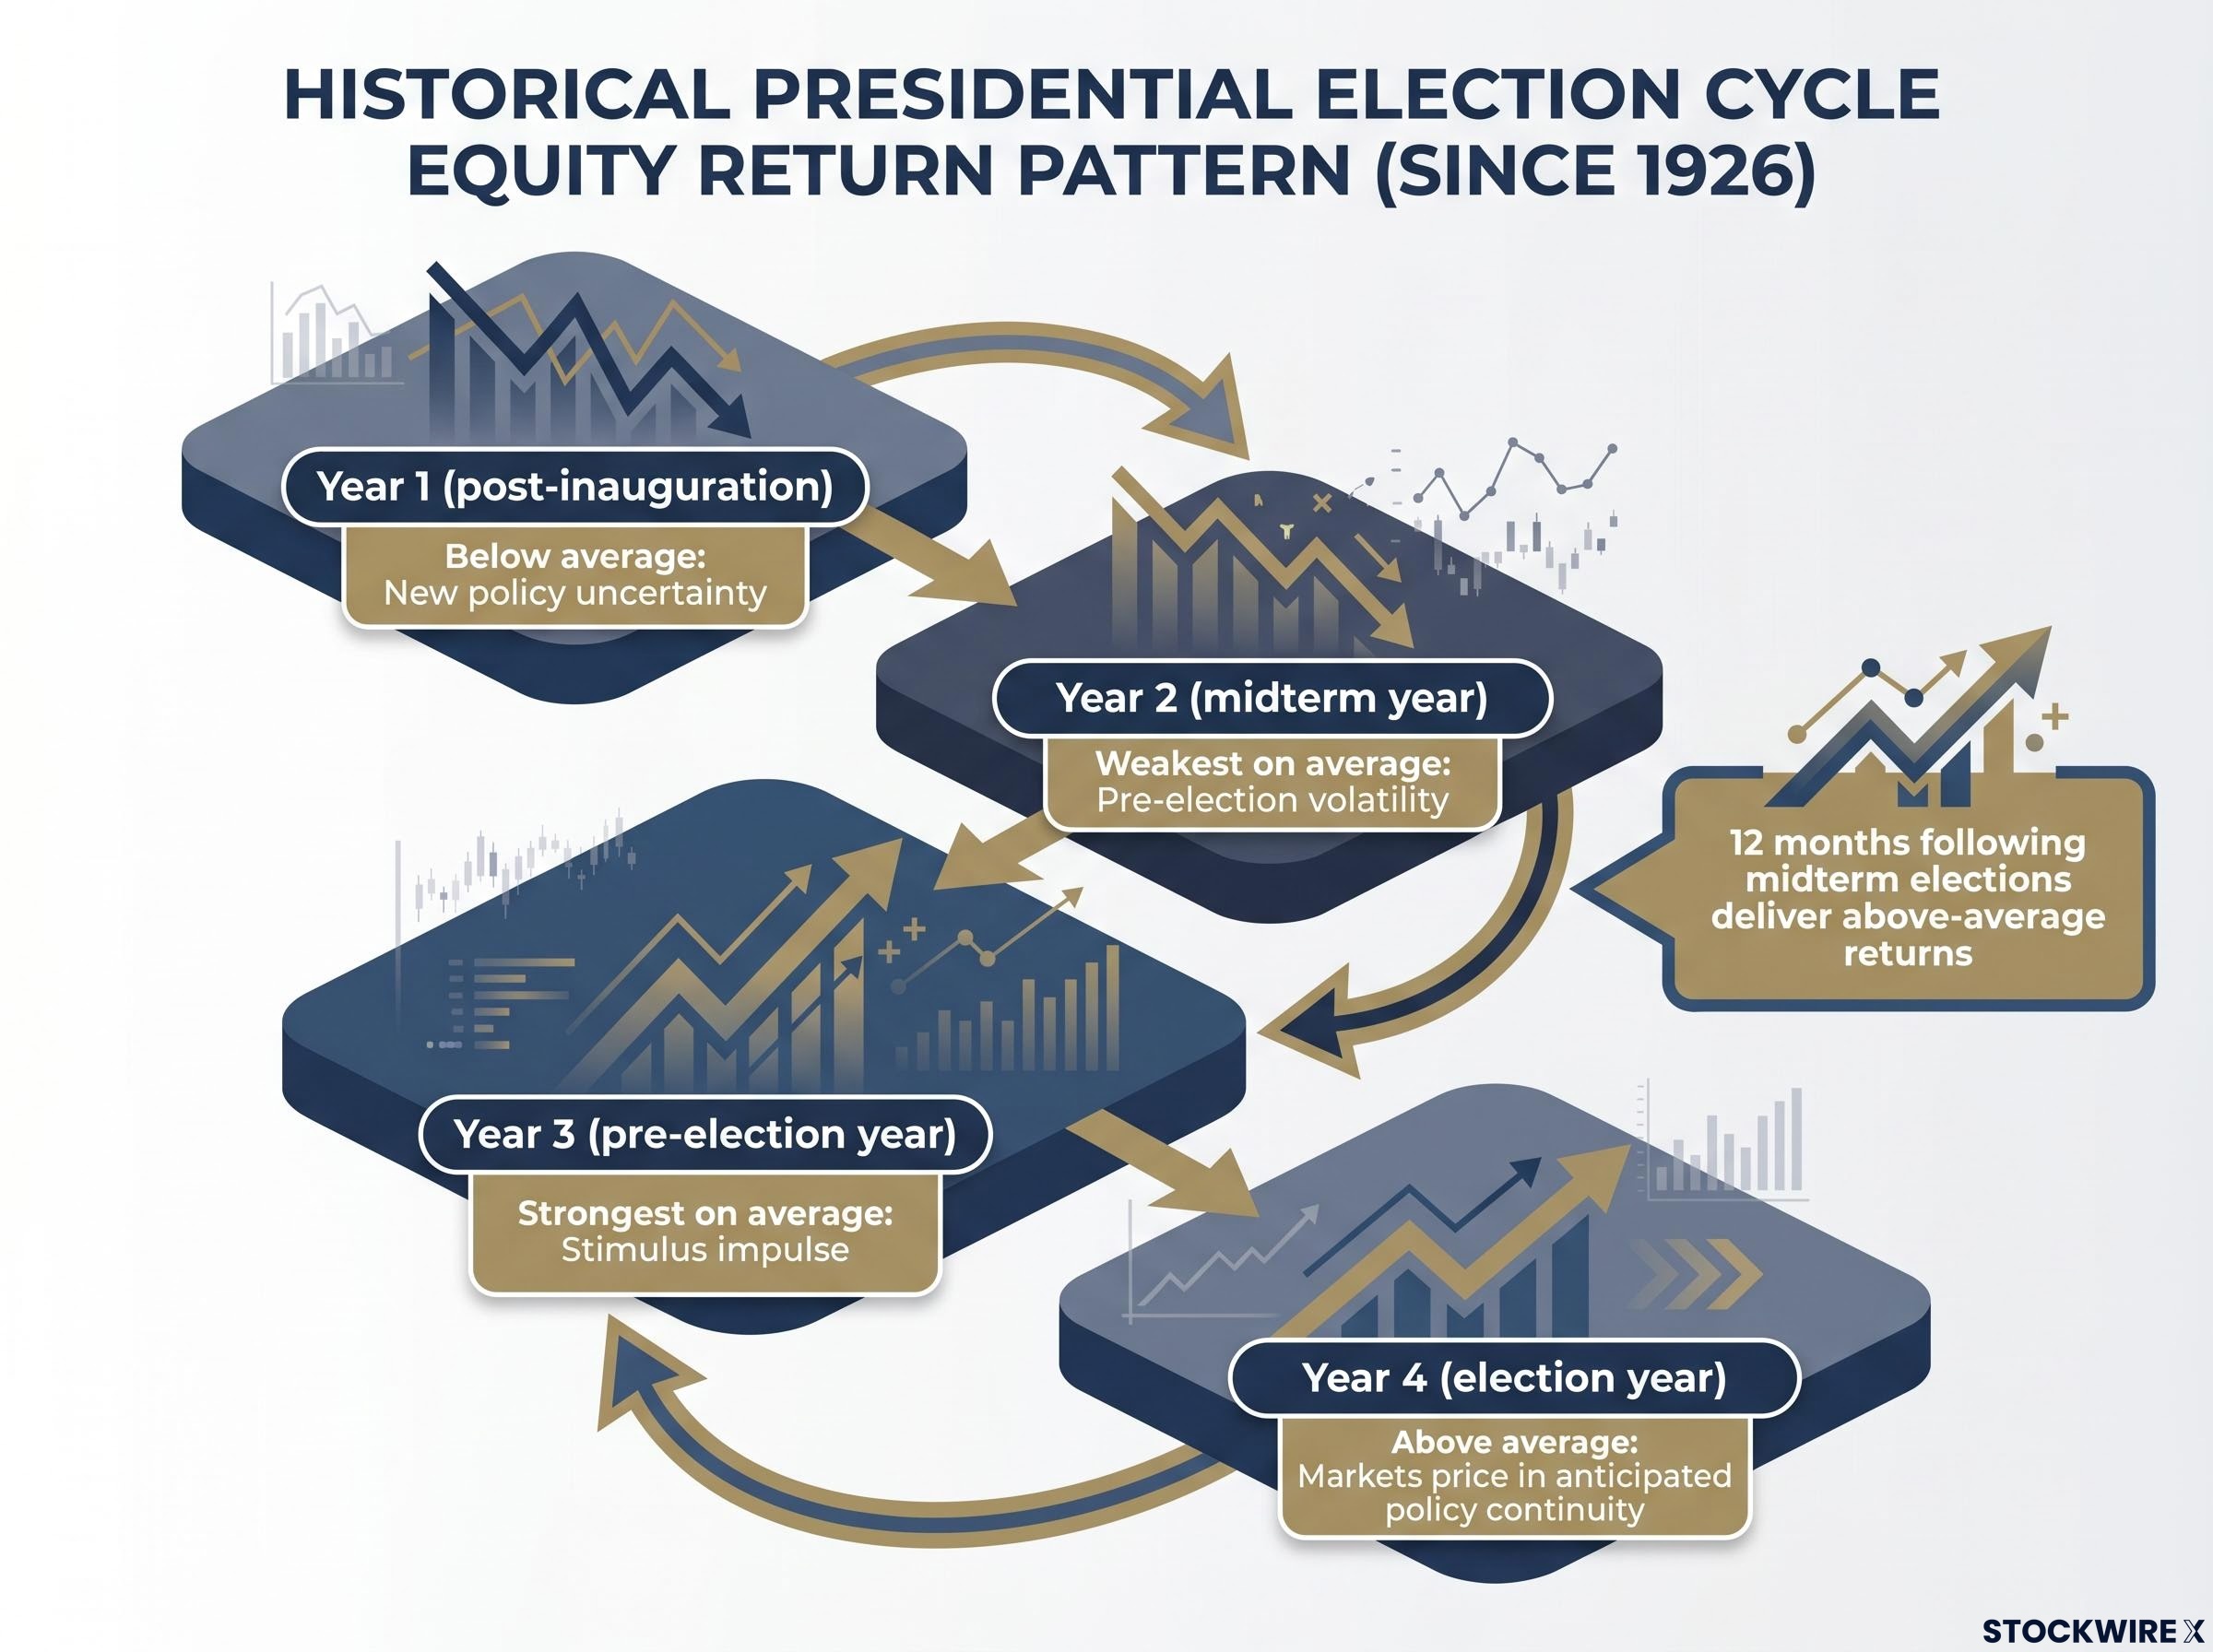
| Presidential cycle year | Historical return characterisation | Key equity market dynamic |
|---|---|---|
| Year 1 (post-inauguration) | Below average | New policy uncertainty; markets adjusting to administration priorities |
| Year 2 (midterm year) | Weakest on average | Pre-election volatility; policy gridlock risk; uncertainty peaks |
| Year 3 (pre-election year) | Strongest on average | Stimulus impulse; administration pushes for economic strength ahead of re-election cycle |
| Year 4 (election year) | Above average | Markets price in anticipated policy continuity or change |
The fact that Year 2 has historically been the weakest and that the post-midterm window has historically been the strongest is not a prediction for 2026. But it is the base rate context against which Hartnett’s “binary risk” framing becomes intelligible. When he calls the midterm the most consequential event for markets in the second half, he is not inventing a concern. He is placing it within a pattern that the data has supported across decades of election cycles.
The post-midterm return pattern has held across cycles marked by recessions, elevated inflation, and geopolitical shocks, with the driving mechanism being uncertainty resolution rather than any specific policy outcome; the clearing of election results has historically been sufficient to unlock sidelined capital regardless of which party emerges with control.
In his research note, Bank of America’s Michael Hartnett drew attention to U.S. CPI and the unemployment rate both sitting at 4.2% simultaneously, describing this alignment as uncommon in the historical record and noting that similar readings have tended to appear in periods that gave way to Federal Reserve tightening cycles which markets subsequently judged harshly.
The framing is Hartnett’s. No standard macro framework treats exact numerical equality between the CPI rate and the unemployment rate as a formal policy threshold. The specific 4.2%/4.2% figure functions as a rhetorical anchor in his analysis rather than a recognised rule.
That said, the underlying concern it points toward is analytically sound. When inflation remains elevated and the labour market remains firm at the same time, the Federal Reserve’s room to stay patient narrows. The question becomes: allow inflation to run and risk de-anchoring expectations, or tighten into a still-strong labour market and risk a later, sharper slowdown. Historically, tightening cycles that begin late have often been associated with poor subsequent equity returns, particularly when valuations are already elevated.
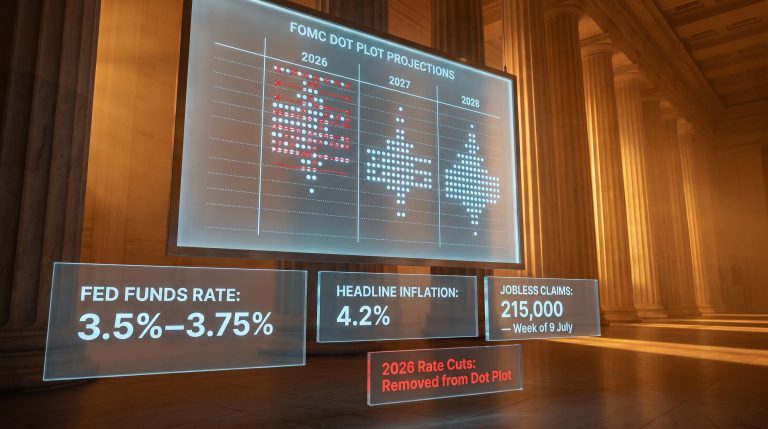
Markets are now pricing a 65-70% rate hike probability by December 2026, a full reversal from the 50-75 basis points of cuts that were consensus just ten weeks earlier, with Goldman Sachs forecasting April core PCE at 3.8% year-over-year against the Fed’s own year-end projection of roughly 3.0%.
The three frameworks that actually formalise this tension are worth knowing, because they are the tools you can use to stress-test Hartnett’s signal yourself:
The honest read of Hartnett’s indicator is this: he is using a numerical coincidence as a memorable anchor for a legitimate concern. When inflation and employment are both holding firm, the Fed’s decision space narrows, and markets historically have not handled that narrowing well. That is the takeaway, not the number itself.
Hartnett’s research note identifies four specific conditions whose absence kept bearish sentiment subdued through the first half of 2026. Framed as negatives that did not materialise, they collectively define the conditional structure of the current bull case:
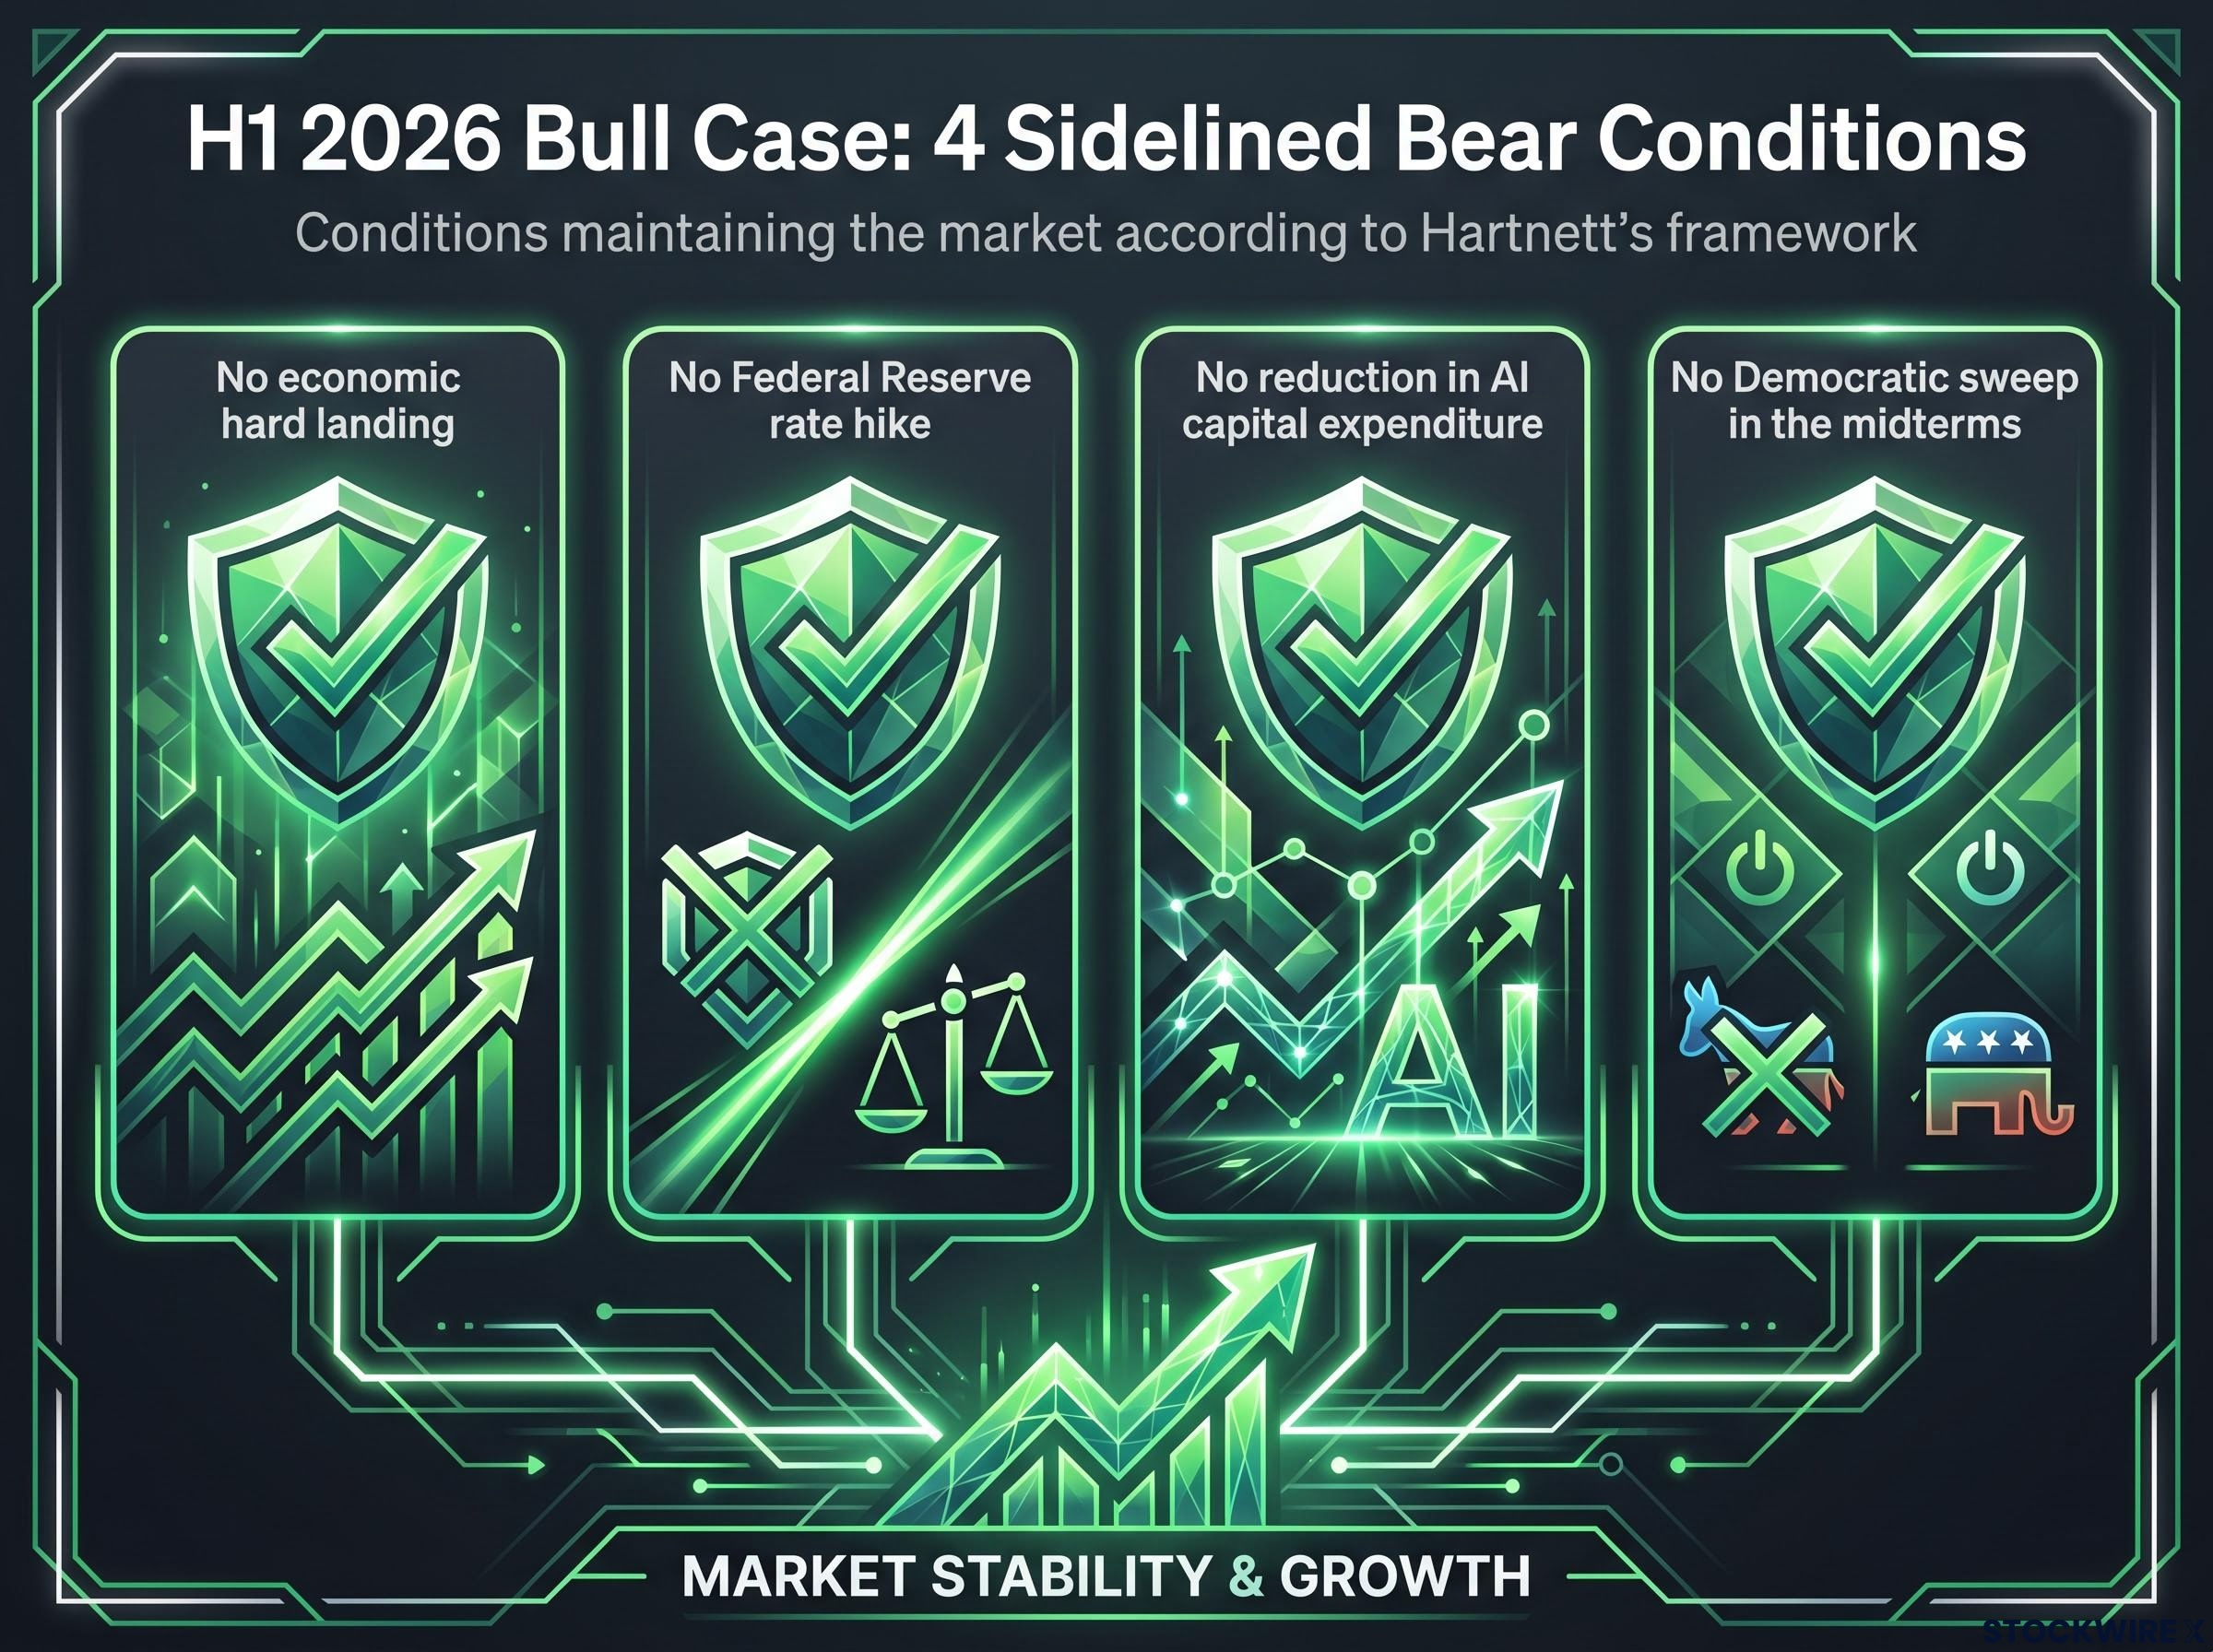
The framing matters. The bull case in 2026 has not been unconditional optimism. It has been a set of specific things that did not happen. Each of those conditions could still reverse, and each reversal carries different implications for the streak Hartnett has documented. Three of the four have already cleared their primary risk windows. The midterm election has not.
In his Bank of America research note, Hartnett identifies the midterm election as the event carrying the greatest binary weight for markets across the back half of 2026, framing it as the single outcome with the most direct bearing on whether the current conditions hold.
The characterisation is his, not a mechanical historical law, but the logic behind it is structurally coherent. The midterm is the one remaining event in 2026 with the scale to shift multiple conditions simultaneously. A change in Congressional control that alters the policy environment on taxation, spending, or regulation could rewrite the terms under which the current bull market has been sustained.
Hartnett’s scenario analysis, attributed to his framework, suggests that a Democratic sweep would represent the most direct threat to the four-year gain streak, because it would change the fiscal and regulatory backdrop that has supported equity valuations through the term. That is an interpretive political-risk extrapolation, not a historical rule, and it should be handled accordingly.
Two conditional paths emerge from this framing:
The post-midterm 12-month period has historically delivered above-average returns on average, regardless of which party wins. But that pattern reflects the clearing of uncertainty, not immunity from specific policy outcomes. If the outcome is sufficiently disruptive to the conditions Hartnett has identified, the structural tailwind could be overridden.
What this tells you is that the midterm is not binary because one outcome is definitively good and the other definitively bad. It is binary because it is the one event with the leverage to shift multiple variables at once: policy certainty, Fed posture expectations, and sector leadership.
Hartnett’s presidential cycle framework is useful in the way that any well-constructed analytical lens is useful: it organises your attention around specific variables rather than letting it scatter across noise. The parts grounded in verified base rates, Year 2 weakness, post-midterm return tendencies, the rarity of extended winning streaks, are independently documented. The parts that belong to his interpretive construction, the 1873 anchor, the 4.2%/4.2% signal, the streak framing itself, require Hartnett attribution and a lower confidence weighting.
Three variables warrant monitoring through H2 2026, each derived from the conditional structure Hartnett has mapped:
The Fed leadership transition adds a layer of hawkish uncertainty that runs parallel to the data-driven repricing: Kevin Warsh, sworn in as Chair on 22 May 2026, holds a structurally higher view of the neutral rate than his predecessor and has pledged to accelerate quantitative tightening, introducing an independent upward pressure on long-term yields that operates regardless of whether CPI and unemployment readings move in a more favourable direction.
The long-term S&P 500 return of approximately 10% nominal annually is the anchor against which any elevated risk assessment should be held. Historically, similar setups have often coincided with periods of above-average volatility. The conditional probability of a sharper drawdown rises if multiple conditions shift at once.
The reader who treats Hartnett’s streak claim as a law will be poorly positioned. The reader who treats it as a structured set of conditional risks, with specific variables to monitor, will be better positioned to respond rather than react.
This article is for informational purposes only and should not be considered financial advice. Investors should conduct their own research and consult with financial professionals before making investment decisions. These statements are speculative and subject to change based on market developments and company performance.
The analytical tension at the centre of Hartnett’s framework is real: a historically rare multi-year gain streak, a macro backdrop with a genuine late-cycle signal, and a political event with the scale to shift multiple conditions simultaneously. None of these observations are trivial, and together they form a coherent risk map for the second half of 2026.
The value of Hartnett’s presidential cycle analysis is not the prediction it implies but the discipline it enforces. It forces you to name the specific conditions under which your thesis holds, and then to watch for the specific events that could change them. The midterm election is the event that will test the most of those conditions at once. Whether the streak extends or ends, the framework gives you a better question to ask than “will the market go up?”
Investors wanting to stress-test how direct government involvement reshapes individual equity valuations will find our deep-dive into political influence on stock prices examines documented cases including the U.S. government’s equity stake in Intel and the precedent it sets for interpreting sector-specific announcements through a political timing lens.
The presidential election cycle is an empirically documented pattern showing that equity returns vary systematically depending on where a given year falls within a four-year presidential term: Year 2 (the midterm year) has historically produced the weakest average returns, while Year 3 (the pre-election year) has historically produced the strongest.
The post-midterm rally pattern, documented since 1926, is driven by uncertainty resolution rather than any specific policy outcome: the clearing of election results historically unlocks sidelined capital regardless of which party wins control of Congress.
Hartnett uses the numerical coincidence of both readings sitting at 4.2% as a memorable anchor for a legitimate policy concern: when inflation and employment are both holding firm simultaneously, the Fed faces pressure to tighten even if the economy looks healthy, and tightening cycles that begin late have historically been associated with poor subsequent equity returns.
Hartnett identifies no economic hard landing, no Federal Reserve rate hike, no reduction in AI capital expenditure, and no Democratic sweep in the midterms as the four conditions whose absence prevented bearish sentiment from taking hold through the first half of 2026.
The Sahm Rule triggers when the three-month moving average of the unemployment rate rises by 0.5 percentage points or more relative to its 12-month low, measuring changes in unemployment against its own recent trend; it has no relationship to CPI levels and should not be conflated with Hartnett's convergence framing.