What Trading Expectancy Reveals About Your Strategy’s Edge
10 hrs ago


An investor who was right about Tesla for three years, watched the stock gain roughly 80%, and held a 2x leveraged ETF the entire time walked away with approximately 22%. Not because the thesis was wrong. Because the product was.
Single stock leveraged ETFs have proliferated rapidly since their U.S. debut around 2022, drawing retail capital with the promise of amplified upside on names like Tesla, Nvidia, and Apple. The structural mechanics responsible for that performance gap are not visible from the marketing description. They are embedded in every one of these products, operating quietly whether you hold for a week or a decade.
Here is what the numbers, the construction, and the cost layers actually tell you about how these instruments work, what they do to your returns over time, and the narrow set of circumstances where they make legitimate sense. After this, you will understand exactly what you are agreeing to structurally when you buy a leveraged single stock product, not just directionally.
Most investors assume a 2x Tesla ETF means owning twice as much Tesla. It does not. Rather than holding shares in the underlying company, the fund’s portfolio is built almost entirely around derivative contracts, specifically total return swaps arranged with an investment bank.
The swap works like this: the bank agrees to deliver a specified multiple of the stock’s daily percentage move, and the fund pays interest in return for that exposure. If Tesla rises 3% on a given day, the bank owes the fund 6%. If it falls 4%, the fund owes the bank 8%. The arrangement is a contractual agreement between two parties, not a claim on the company’s shares.
That distinction matters. Your returns depend on the counterparty fulfilling its obligations, a layer of risk entirely absent from owning shares directly. And it means every structural risk that follows, financing costs, daily resets, counterparty exposure, flows from that single design choice.
What investors expect:
What the fund actually holds:
Expense ratios for these products run approximately 0.95% to 1.00% per year, compared with roughly 3 basis points for broad index ETFs such as VOO. That fee gap alone should prompt a question. The answer is that you are paying for synthetic derivative exposure, not simple stock ownership.
Leverage via swaps is not free. Under the swap arrangement, the fund makes ongoing interest payments to the investment bank, and those financing costs layer on top of whatever the headline expense ratio already takes.
These financing costs are typically tied to short-term benchmark rates such as SOFR (Secured Overnight Financing Rate), the dominant U.S. rate benchmark since the LIBOR transition completed in June 2023. The original source reports that banks charge approximately 25 to 50 basis points above SOFR, though exact spreads vary by agreement and market conditions.
In the current rate environment, these embedded costs represent a meaningful ongoing drag that you will not see broken out as a separate line item on any fund fact sheet.
Every leveraged single stock ETF recalculates its leverage exposure at the end of each trading session relative to that day’s closing net asset value. Each day starts fresh from a new base. This is not a flaw. It is how the product is deliberately engineered: it delivers a multiple of daily returns, not multi-day or cumulative returns.
The reset period is the single most consequential variable separating these products from one another: daily-reset structures compound volatility drag every 24 hours, while modestly leveraged funds with no reset mechanism carry a structurally different risk profile that makes direct comparison between the two categories misleading.
On any single day, the leverage multiple works exactly as advertised. The problem reveals itself across multiple days, and the mathematics are worth seeing directly.
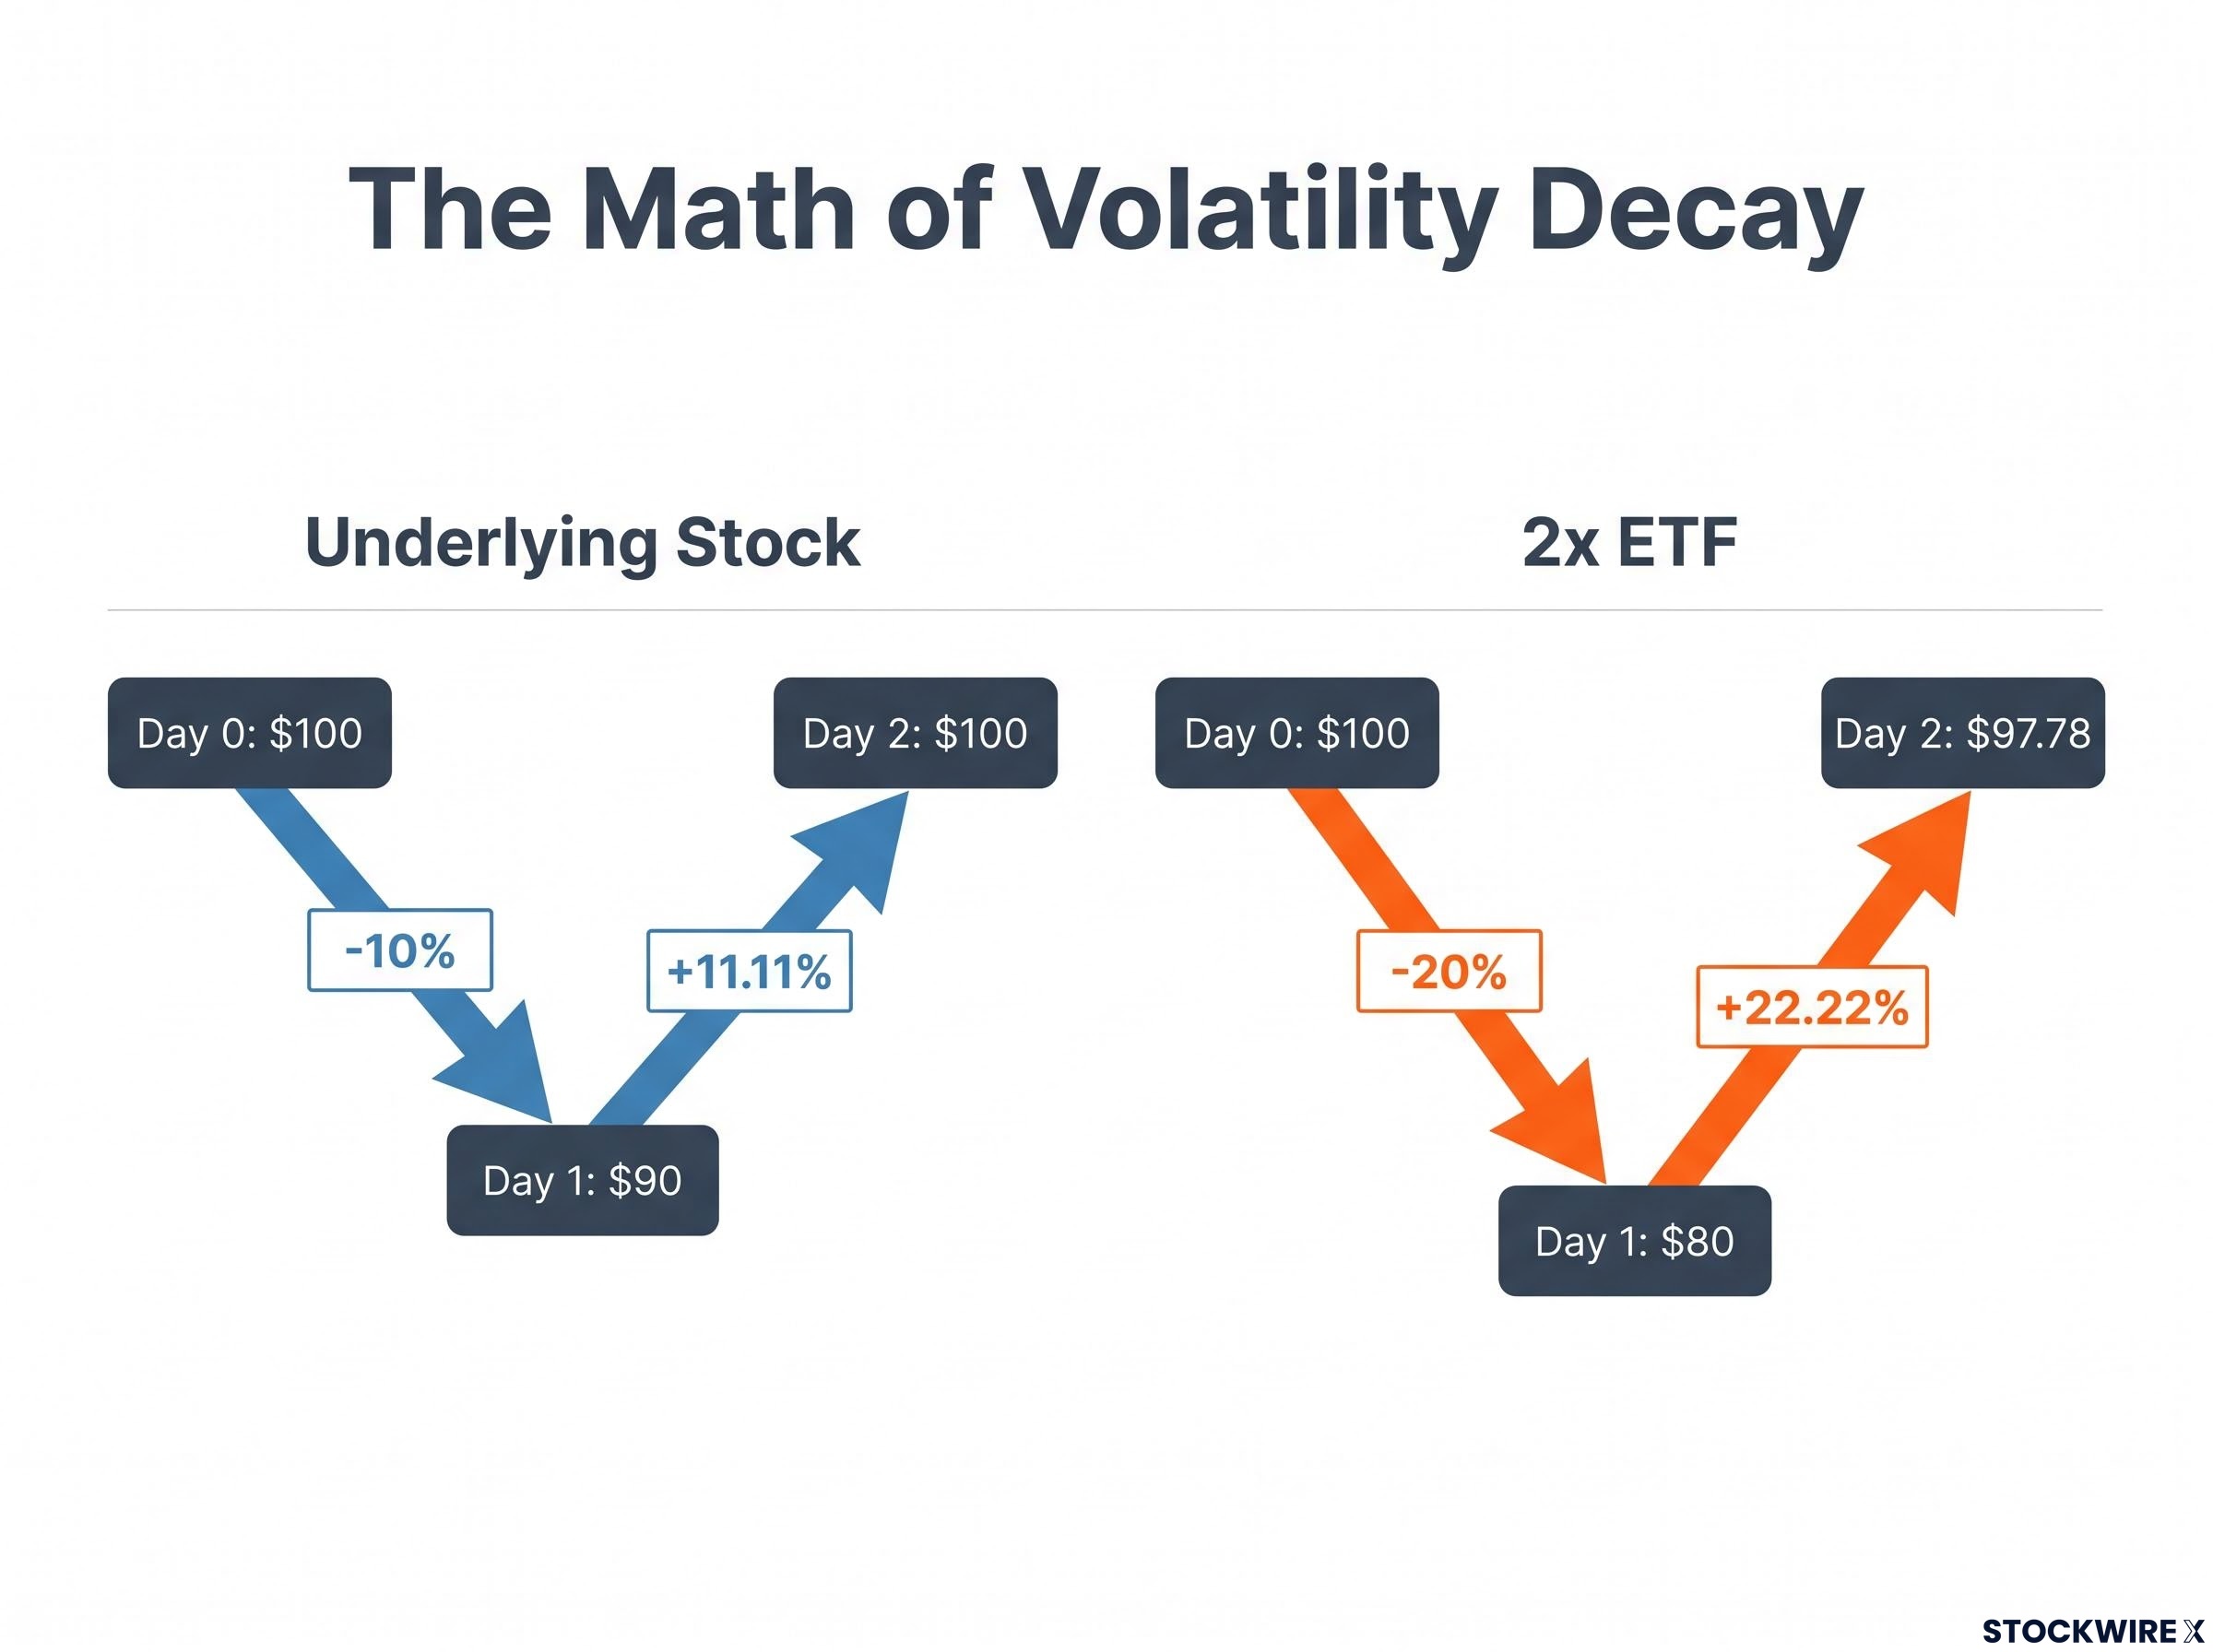
Start with $100 in the underlying stock. It drops 10% to $90. The next day it recovers 11.11%, bringing it back to $100. You broke even.
Now run the same two days through the 2x leveraged version. Day one: the underlying drops 10%, so the ETF drops 20%, falling from $100 to $80. Day two: the underlying gains 11.11%, so the ETF gains 22.22%. But 22.22% of $80 is $17.78, not $20. Your position sits at $97.78.
The underlying broke even. The leveraged version lost money.
| Day | Underlying move | Underlying value | 2x ETF move | 2x ETF value |
|---|---|---|---|---|
| Day 0 | $100.00 | $100.00 | ||
| Day 1 | -10% | $90.00 | -20% | $80.00 |
| Day 2 | +11.11% | $100.00 | +22.22% | $97.78 |
This phenomenon is called volatility decay (also known as beta slippage or compounding drag): the gradual erosion of a leveraged ETF’s value caused by daily compounding in volatile markets. It means the sequence of daily returns, not just the starting and ending prices, determines your multi-period outcome. Professionals call this path dependence.
The volatility drag mechanics at work here become even more visible when you isolate a scenario where the underlying index ends exactly flat: the leveraged ETF still loses value, because percentage losses require proportionally larger gains to recover on a daily-resetting capital base.
“Chop hurts; trend helps.” Alternating up-and-down days systematically erode the leveraged position, even when the underlying stock ends flat. A smooth, low-volatility upward trend is the one scenario where the daily reset works in the product’s favour. The problem is that the high-beta growth names these products target rarely deliver that smooth trending scenario in practice.
Volatility itself, entirely separate from the direction of the stock, is steadily destroying value inside your position. And that destruction accelerates in the high-beta names these products are most commonly built around.
Start with the directional result. Across the three-year period in question, Tesla’s stock delivered a cumulative gain of roughly 80%, which works out to an annualised figure of just under 22%. The investor who held the stock directly did well. The directional call was right.
Now apply the naive expectation. A 2x leveraged ETF should, in a simplified mental model, roughly double the underlying’s total return. Even accounting for fees and financing, that implies something in the range of 120% to 160% over three years.
The actual result: approximately 22%.
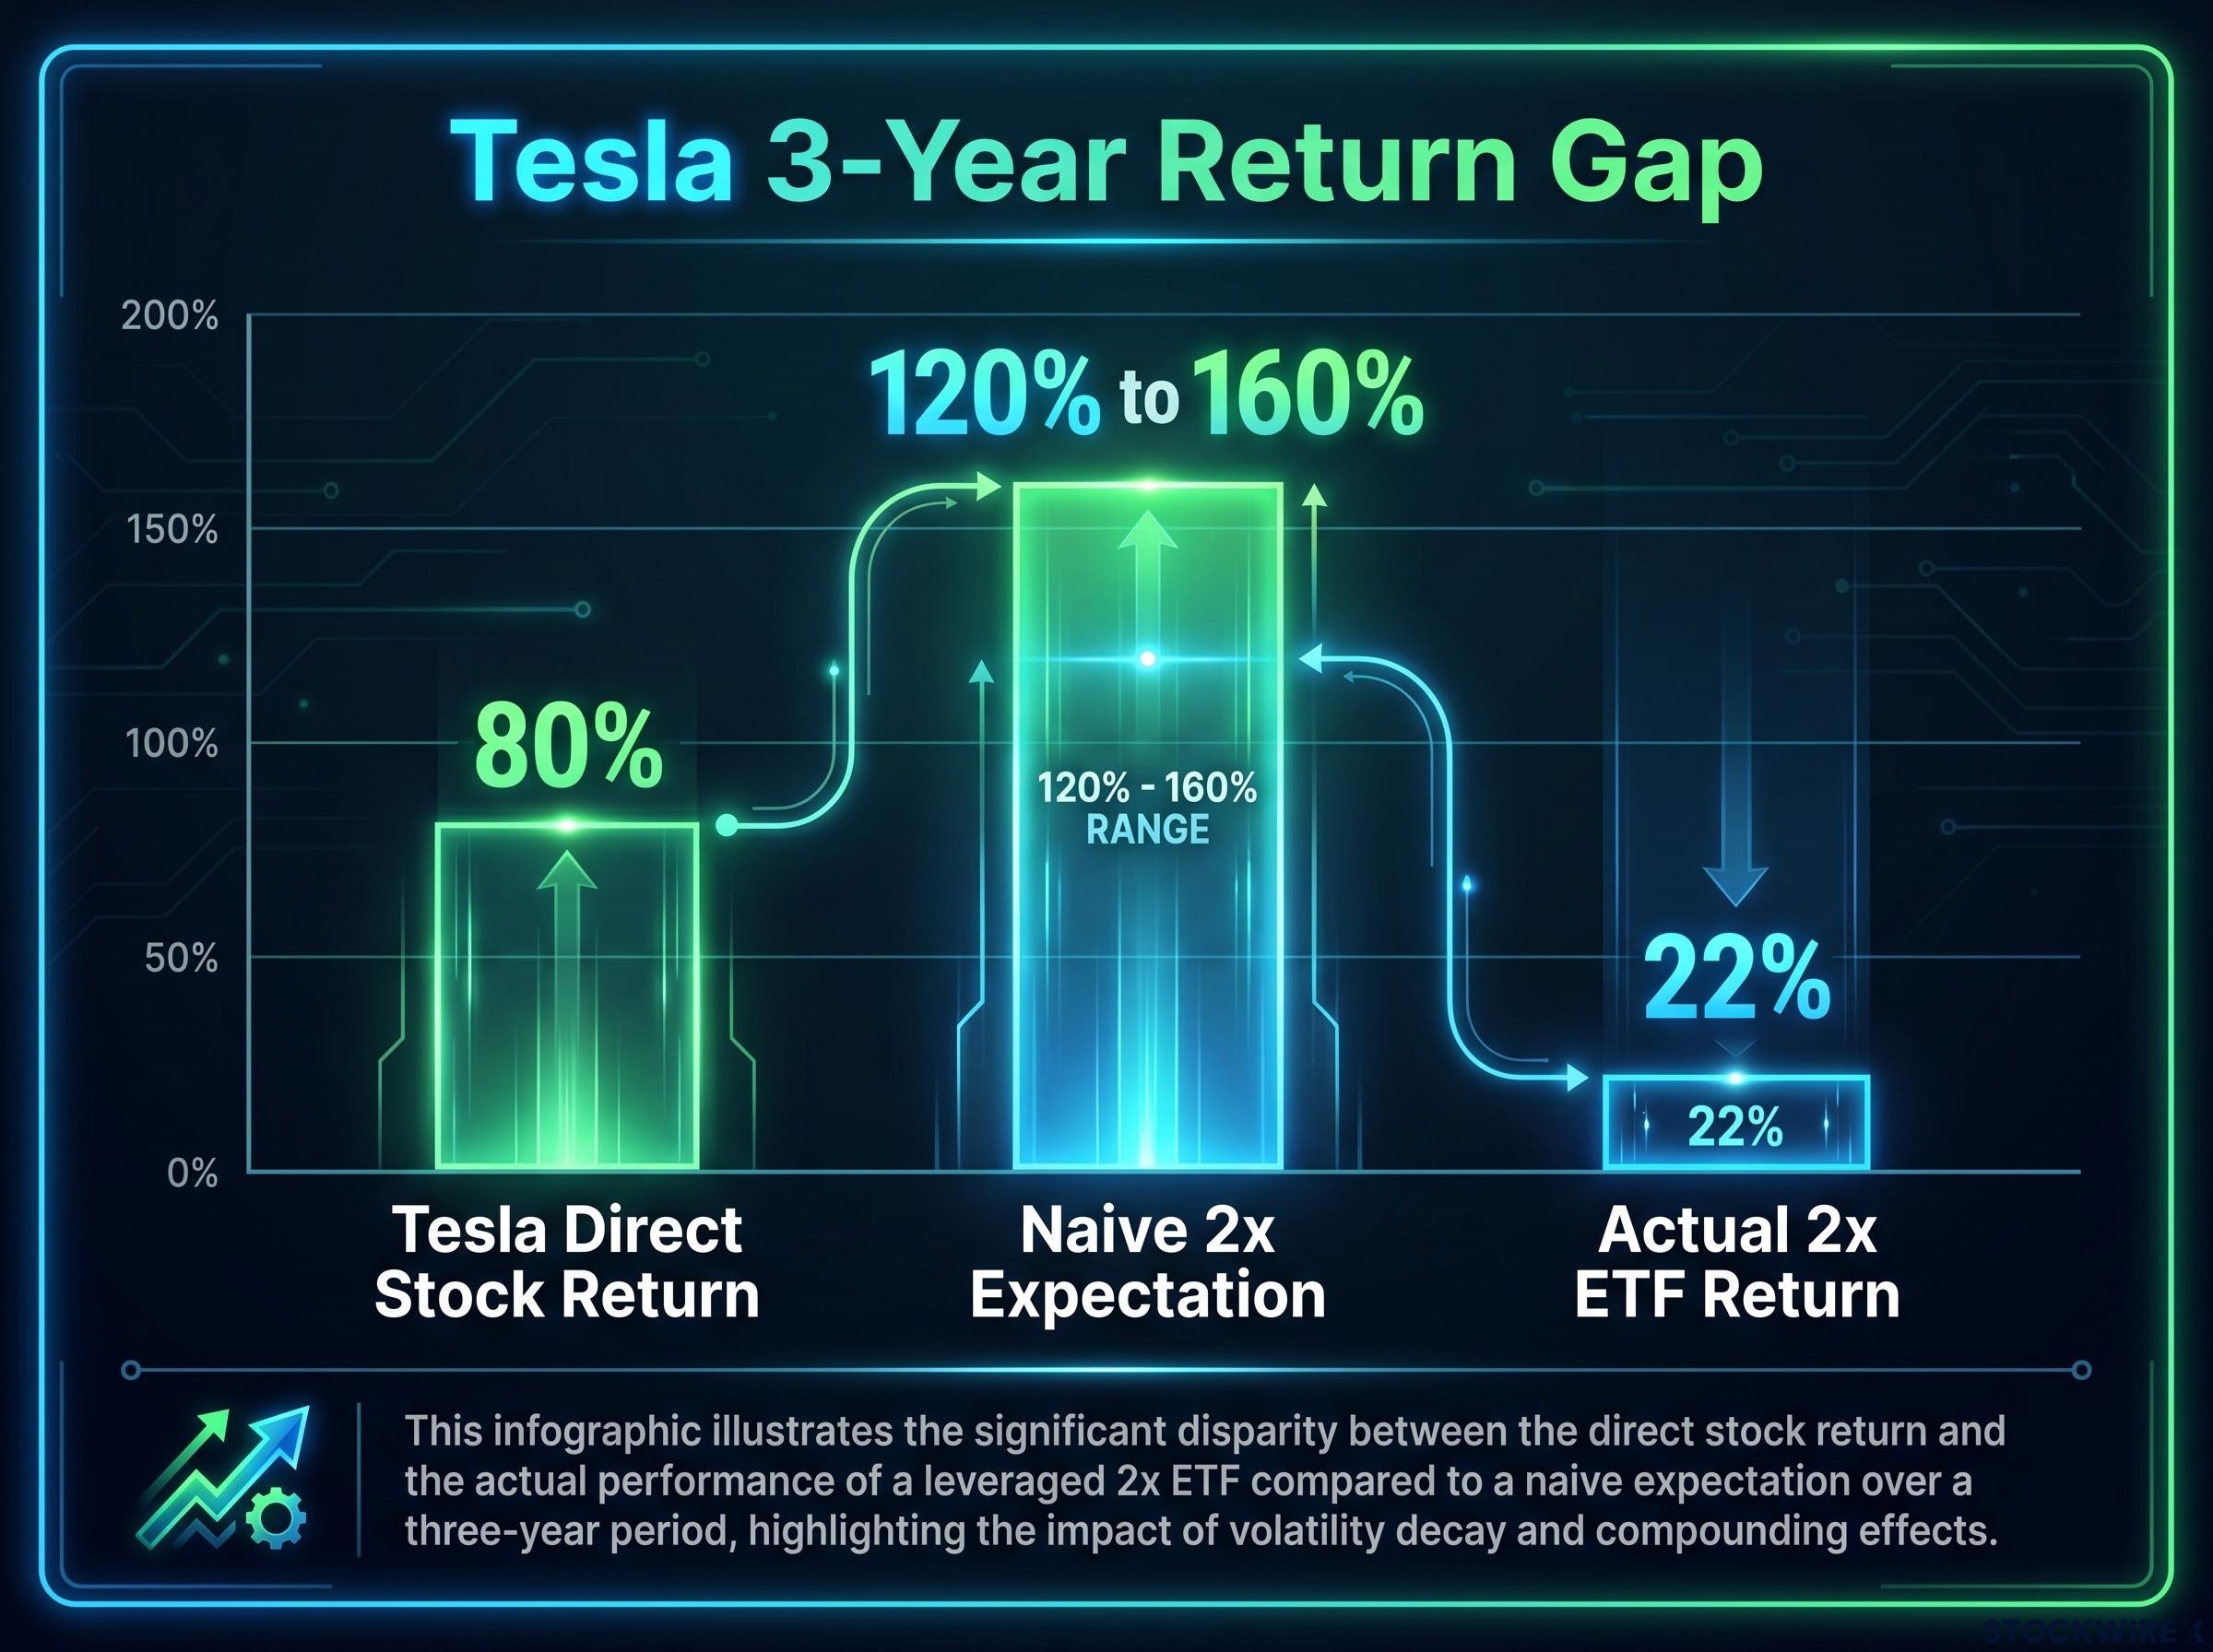
That gap is not explained by a bad directional call. The investor was right about the company for three years. The gap is the direct product of compounding erosion and layered costs documented in the sections above, operating every single trading day regardless of whether Tesla finished up or down over the full period.
A caveat worth noting: actual figures depend sensitively on the precise ETF ticker, exact date range, and corporate events such as stock splits. The directional point, however, is well supported by the mechanics. Being right about a company for years is not sufficient to produce expected returns inside a leveraged ETF wrapper, because the structure itself is consuming return through compounding erosion regardless of the directional outcome.
The performance drag from volatility decay operates on its own. The cost stack operates on top of it. Three distinct layers compound on one another, and understanding them in sequence reveals why the hurdle for justifying a leveraged single stock position is far higher than most retail investors realise.
None of these layers simply adds arithmetically to the drag from daily resets. They interact with it over time, compounding on top of compounding erosion.
Retail loss rates in leveraged instruments follow a pattern that extends well beyond ETF wrappers: CFD traders using similar notional leverage face documented account loss rates of 74% to 89% across regulated jurisdictions, a figure that underscores how the structural mechanics of daily leverage, not the underlying asset class, drive most of the damage.
Explicit fees, embedded financing, and trading friction all compound on top of volatility decay, stacking multiple layers of structural headwind on a position that needs to overcome all of them to generate net return.
The bar for a leveraged single stock ETF to justify its place in your portfolio is substantially higher than “I think this stock is going up.” The product must overcome significant embedded structural headwinds before you see any net gain. A simple directional thesis is not enough; your expected return needs to clear every one of these layers.
The structural risks documented above do not make single stock leveraged ETFs inherently worthless. They make them precision instruments calibrated for a specific tactical purpose. The danger is using a scalpel as a hammer.
Product documentation from issuers consistently describes these funds as trading instruments rather than vehicles suited to long-term investing. Regulators echo this framing, cautioning that leveraged ETFs “won’t necessarily work for a buy-and-hold investor.”
The SEC and FINRA investor guidance on leveraged ETFs states explicitly that these products are not suitable for buy-and-hold investors, a position rooted in the same daily reset and compounding mechanics this article documents through the Tesla case.
The specific scenario where design and intent align: short-term directional conviction over a period of days to roughly one week, typically around a catalyst such as an earnings release, product announcement, or macro event, with a defined exit plan. That is the product working as intended.
One edge case deserves honest acknowledgement. In a low-volatility, smooth upward trend, a leveraged ETF can actually outperform a naive multiple of the underlying’s total return. The structural problem is volatility, not the leverage concept itself. But single stocks, especially the high-beta growth names these products typically target, rarely deliver that smooth trending scenario in practice.
Appropriate use:
Misaligned use:
The question is not whether single stock leveraged ETFs are good or bad in the abstract. The question is whether your specific situation, time horizon, and risk tolerance align with what these products are structurally designed to deliver. Four diagnostic questions can help you make that assessment before committing capital.
Tools for analysing holdings, fees, and performance data for specific leveraged ETF products are available through standard financial data platforms. Before entering any position, you can verify the specific cost structure and historical performance for the exact ticker you are considering.
The structural risks documented in this piece are not hypothetical warnings. They are mathematical certainties that operate regardless of whether your directional call proves correct.
For readers who have a short-term catalyst in mind and want to move beyond the diagnostic framework above, our comprehensive walkthrough of leveraged ETF position sizing covers the specific notional allocation methodology, margin risk analysis, and practitioner-tested holding period guidelines used by active traders across TQQQ, SOXL, and UPRO.
This article is for informational purposes only and should not be considered financial advice. Investors should conduct their own research and consult with financial professionals before making investment decisions. Past performance does not guarantee future results. Financial projections are subject to market conditions and various risk factors.
Volatility decay (also called beta slippage or compounding drag) is the gradual erosion of a leveraged ETF's value caused by daily compounding in volatile markets; because percentage losses require proportionally larger gains to recover on a daily-resetting capital base, a leveraged ETF can lose value even when the underlying stock ends flat over multiple days.
Every leveraged single stock ETF recalculates its leverage exposure at the close of each trading session relative to that day's closing net asset value, meaning the product delivers a multiple of daily returns rather than cumulative returns; over weeks or months, alternating up-and-down days systematically erode the position even if the underlying stock trends in the right direction overall.
Beyond the headline expense ratio of approximately 0.95%-1.00% per year, these products carry embedded financing costs tied to SOFR plus a spread of approximately 25-50 basis points, and daily rebalancing friction from trading at potentially unfavourable prices; none of these additional costs appear as a separate line item on standard fund data pages.
These products are designed for short-term directional conviction over a period of days to roughly one week, typically around a specific catalyst such as an earnings release or product announcement, with a defined exit plan in place before the position is opened.
The investor was right about Tesla's direction, but the 2x leveraged ETF returned approximately 22% over the same period that Tesla stock itself gained roughly 80%, because volatility decay, embedded financing costs, and daily rebalancing friction compounded against the position every trading day regardless of the stock's long-term trajectory.