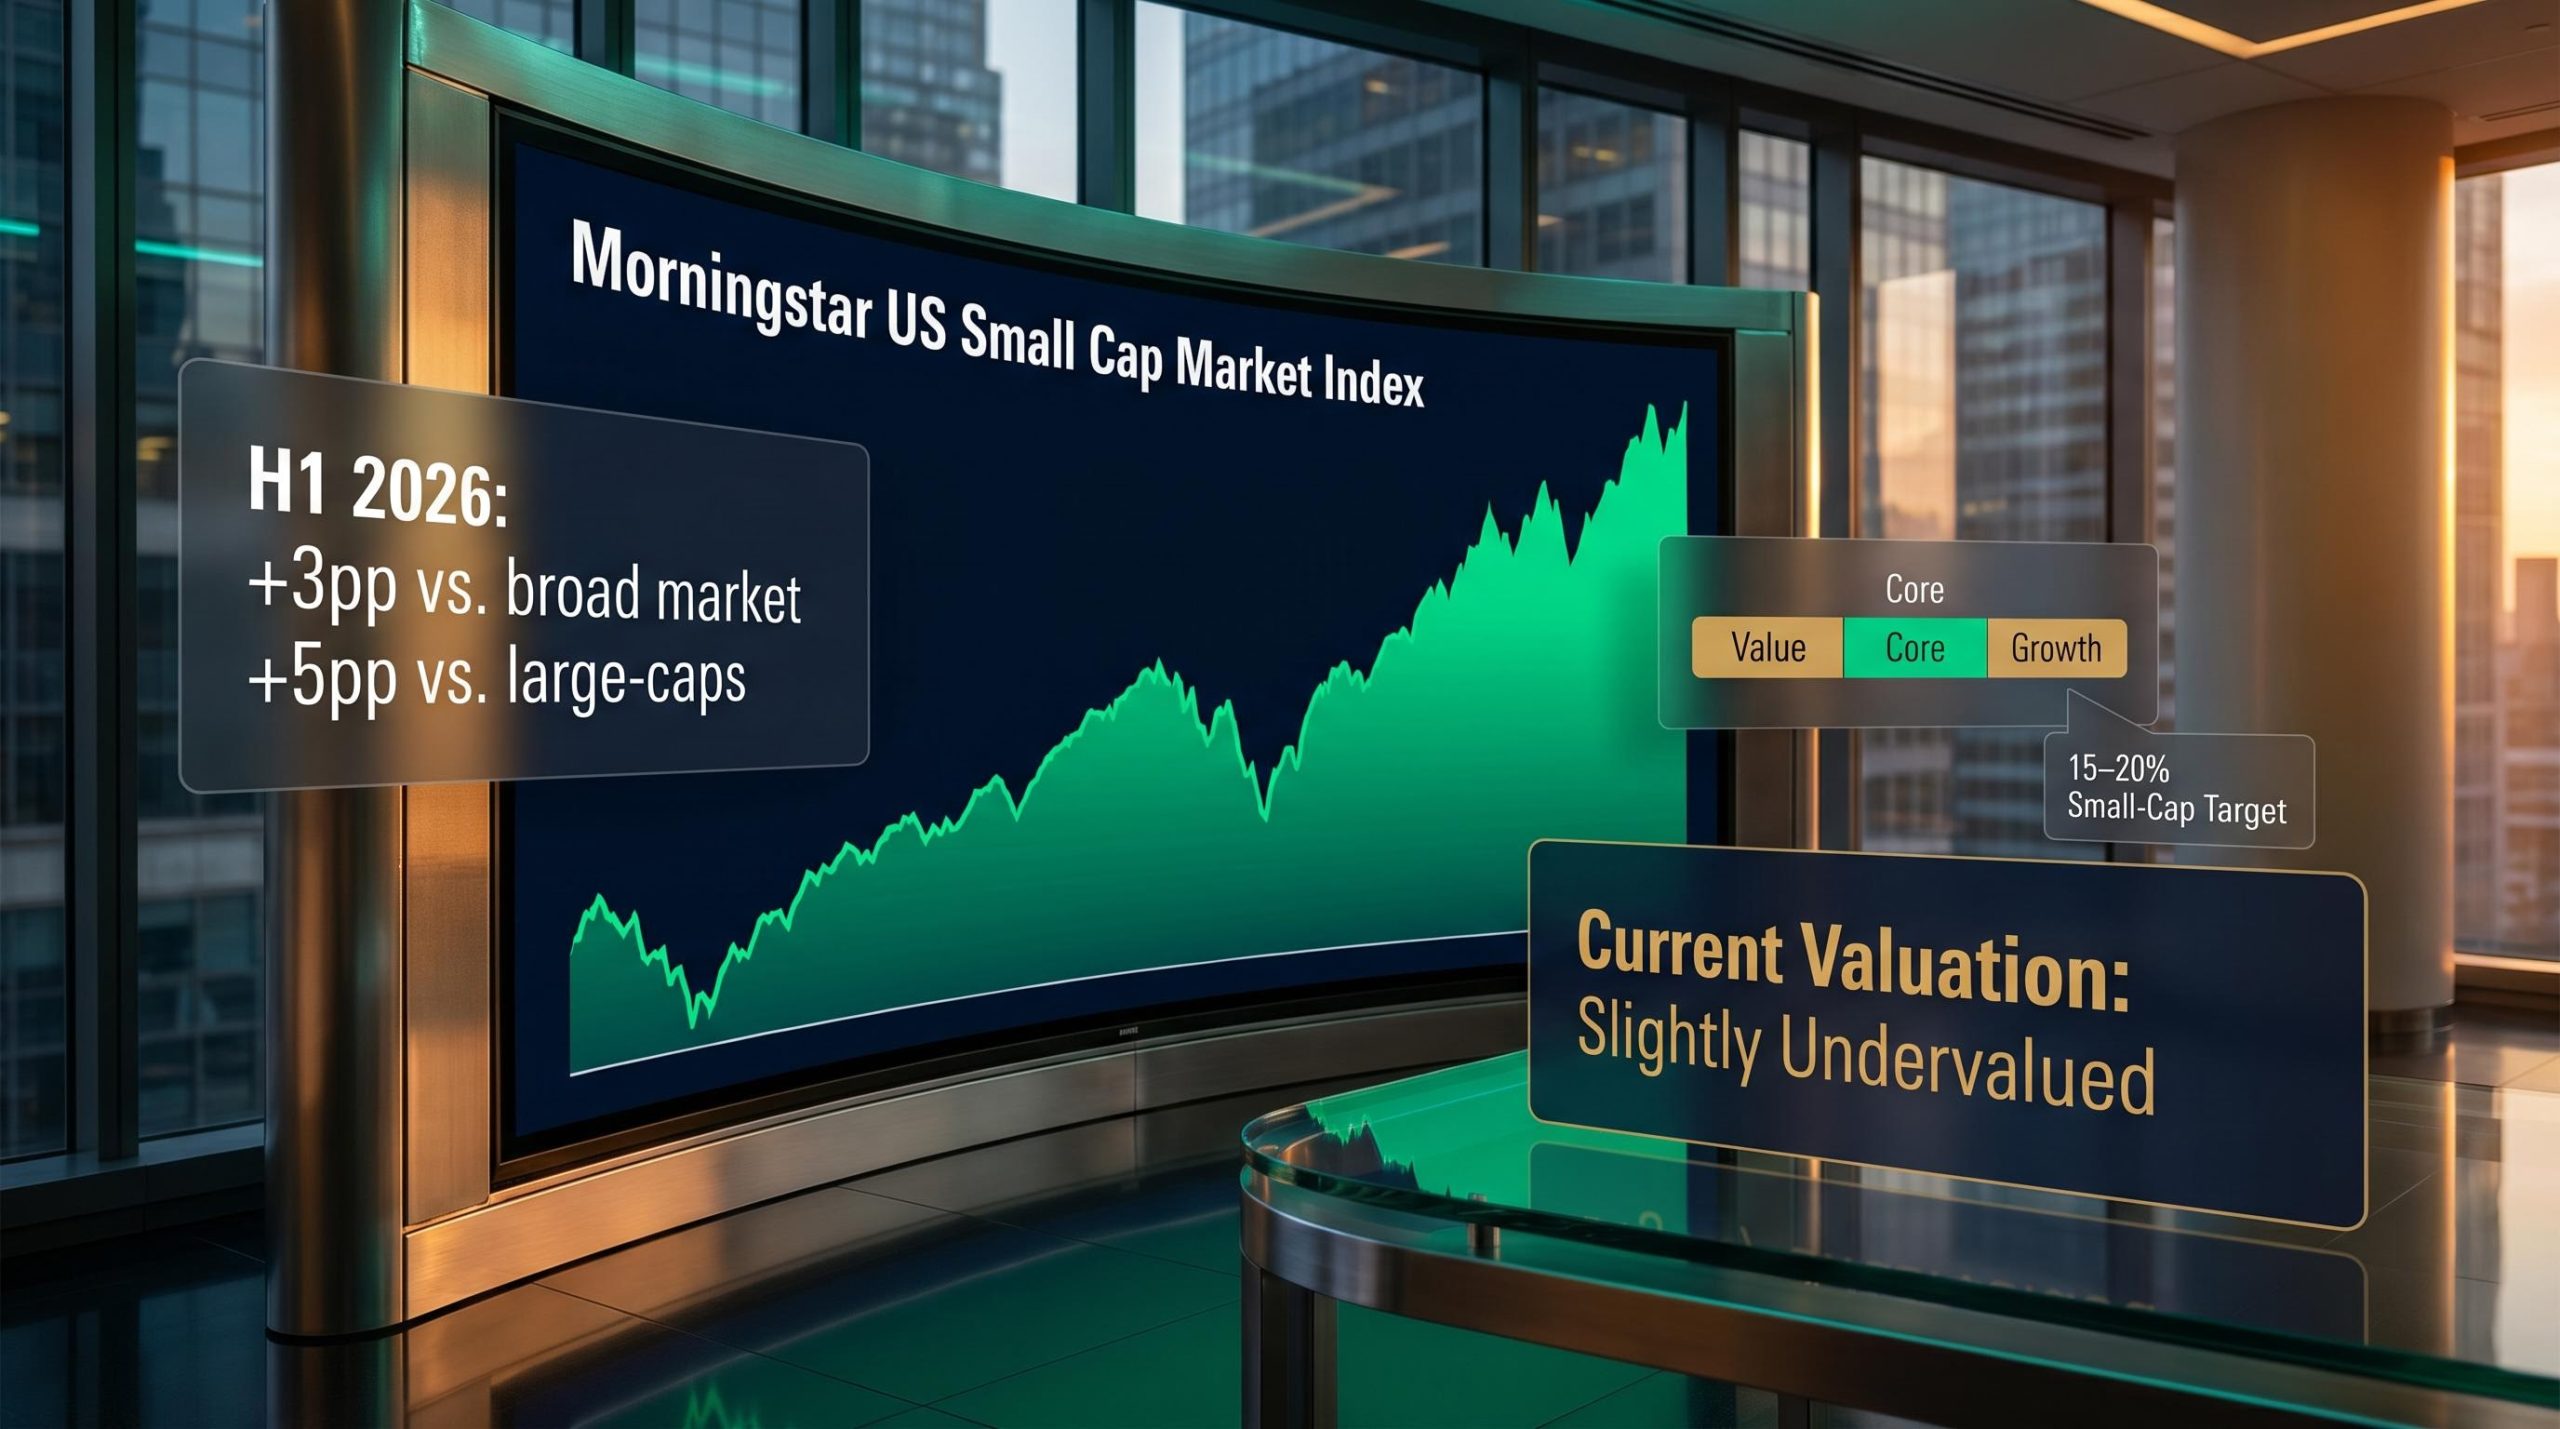
Small-cap stocks delivered their most powerful opening half in more than thirty years, and yet the segment still looks cheap by fair-value measures. That is not a typo. The segment of the market that rallied hardest in the first six months of 2026 still looks cheap on fair-value measures heading into the second half.
The portfolio construction question has shifted. The easy style dislocations that defined early 2026 have largely closed after a compressed rotation cycle that moved from barbell positioning to near-neutrality in under six months. The macro backdrop, sticky inflation with range-bound long rates and at least one more potential federal-funds rate hike, is supportive but not simple. What matters now is architectural: how you weight styles, whether you hold a small-cap overweight, and how you size the real risks that could disrupt either thesis.
This is a decision-support guide, not a market prediction. By the time you finish, you will know what stance to take on three portfolio-architecture questions (style weighting, cap-size tilt, and risk concentration management) and why each stance is grounded in current data rather than macro storytelling.
Why the H1 2026 style rotation changes your starting point for the second half
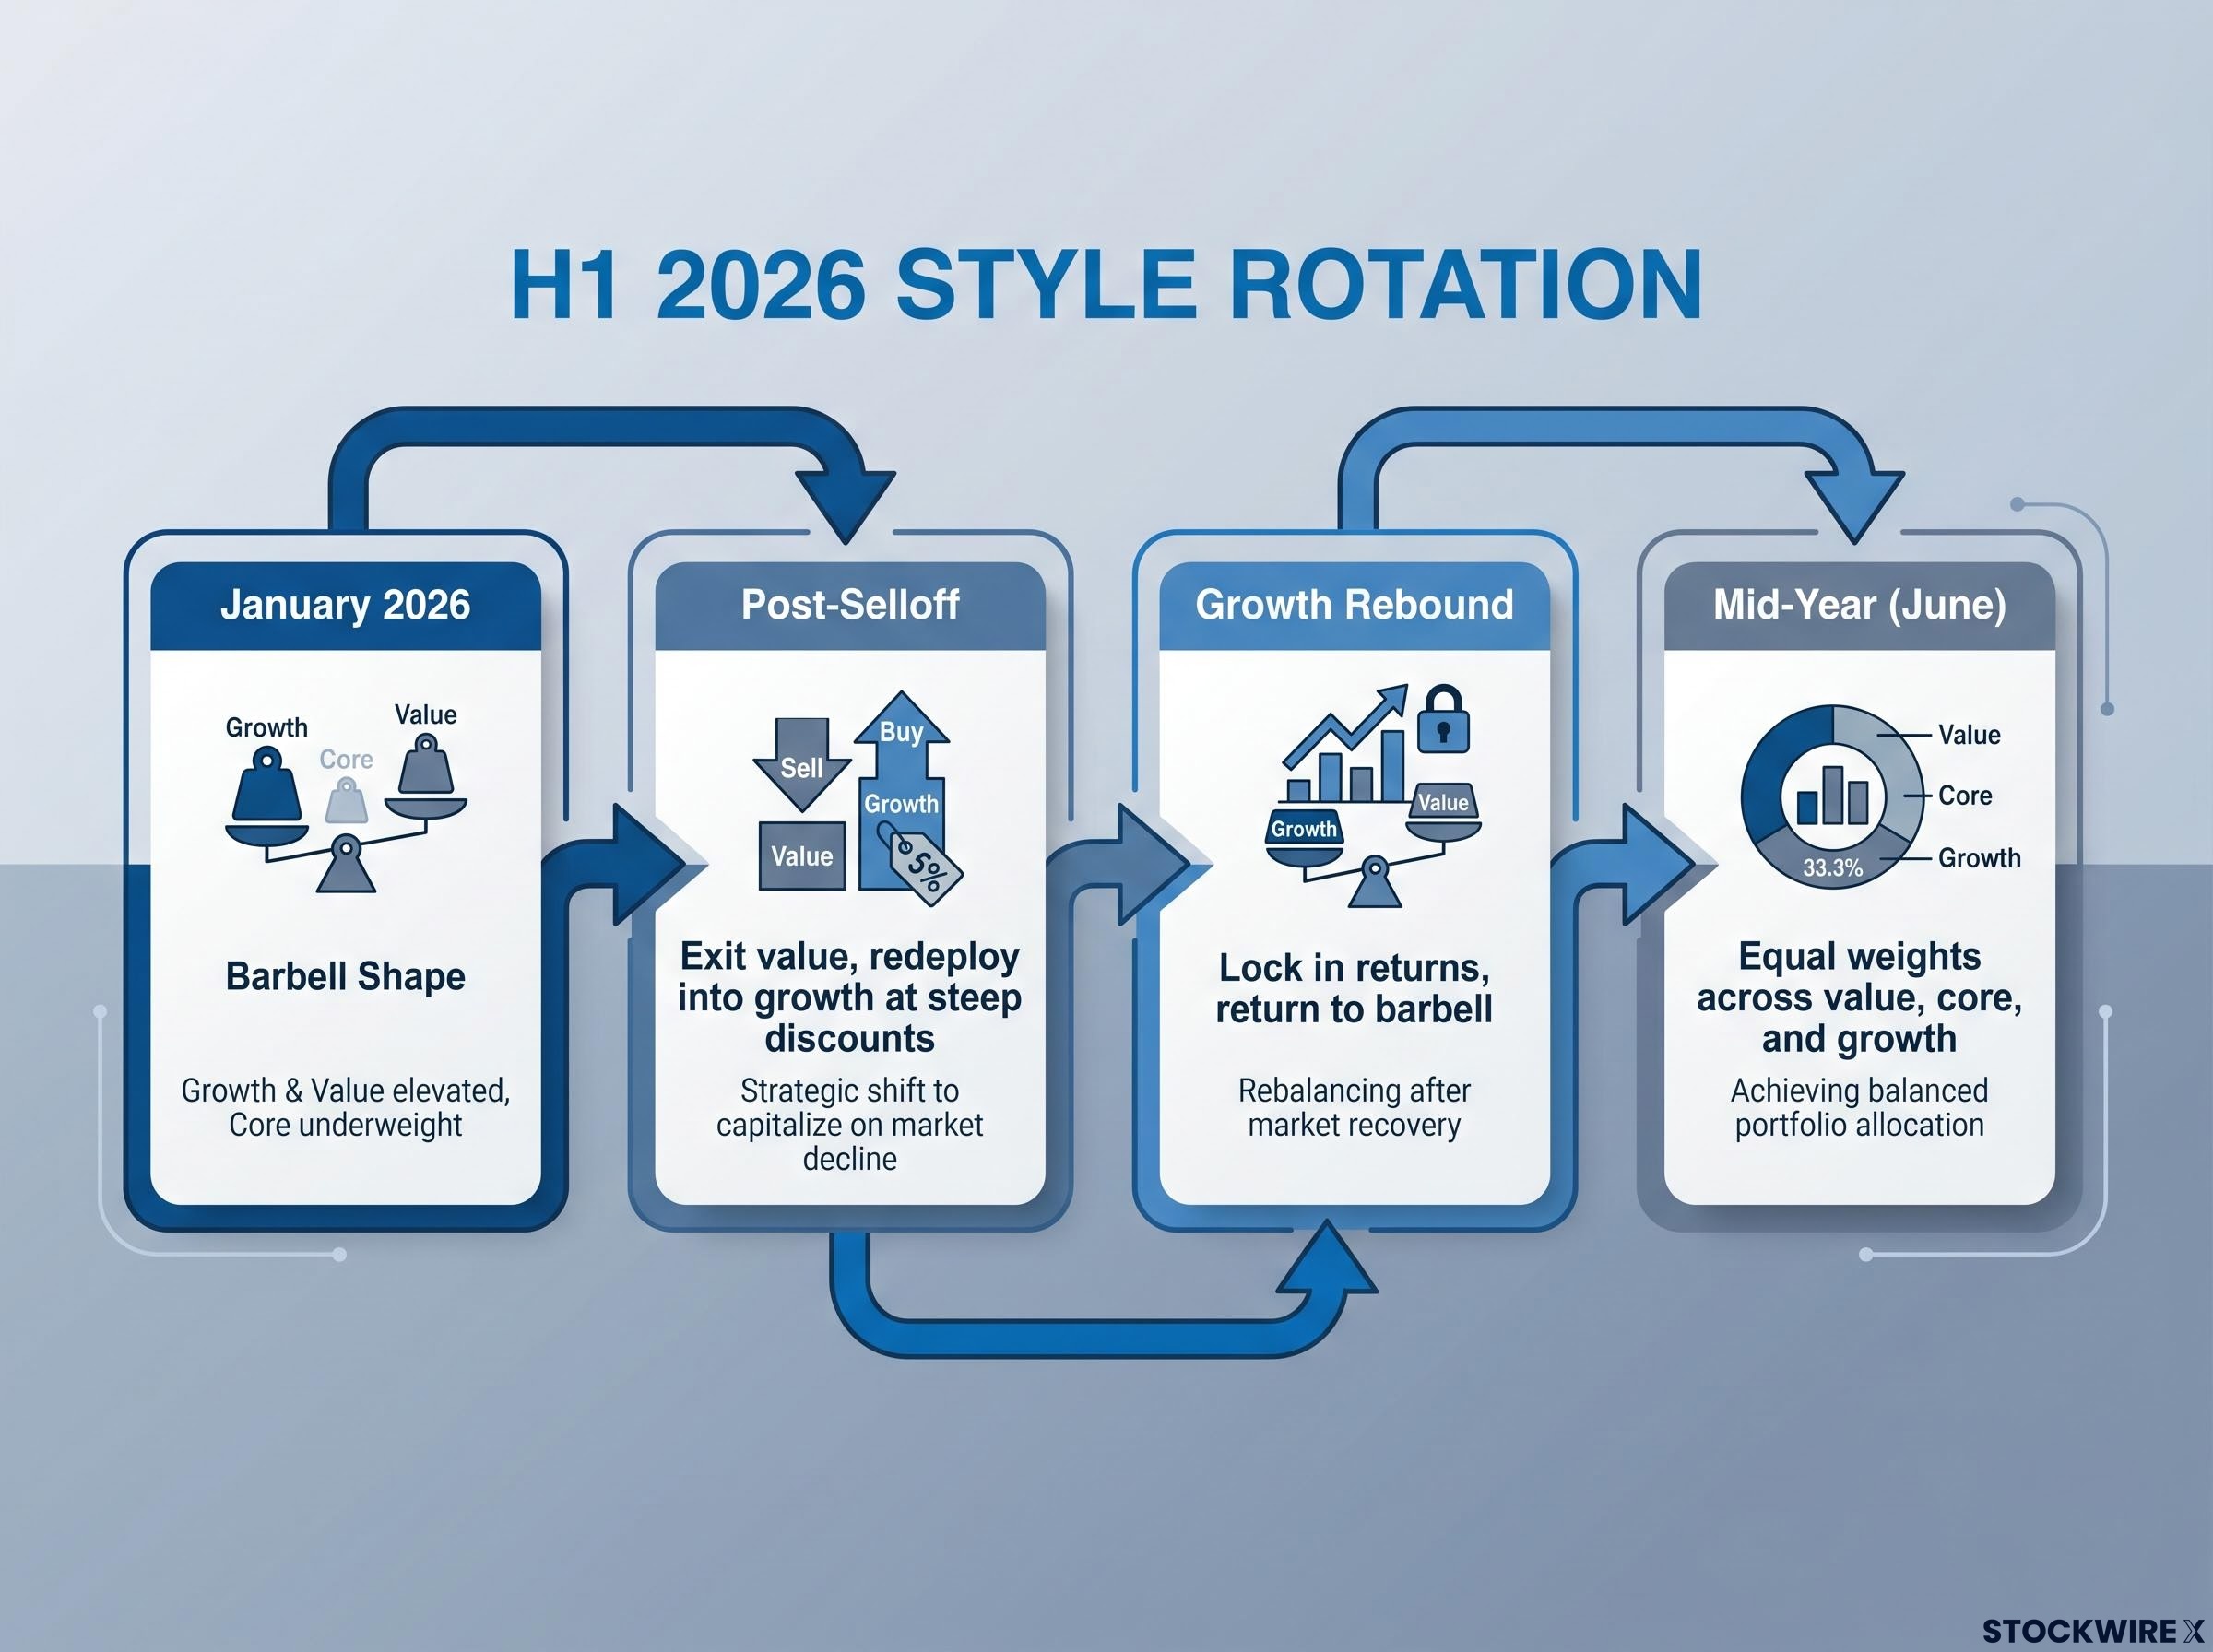
The first half of 2026 produced a four-stage style rotation that was unusually compressed. Each shift was driven by observable fair-value gaps opening and closing, not by sentiment or macro narratives. Understanding the sequence matters because it explains why entering the second half at roughly equal style weights is the rational conclusion rather than a lack of conviction.
Here is how the rotation unfolded:
- January 2026: The starting position was a barbell shape, with growth and value both carrying elevated weights while core sat underweight.
- Post-selloff rotation: A sharp market drawdown created the opening to exit value positions at a profit and redeploy that capital into growth stocks trading at steep discounts.
- Growth rebound: As growth names recovered and closed in on fair value, the logical response was to lock in those returns and return to the barbell configuration.
- Mid-year convergence: By June, the category-level pricing gaps had narrowed sufficiently that the evidence no longer supported an outsized tilt in any direction, and positioning shifted toward broadly equal weights across value, core, and growth.
Each rotation was a response to a measurable valuation gap, not a top-down call. When the gaps closed, the tilts lost their justification.
“Large style tilts primarily add tracking-error risk without a commensurate expected-return benefit when dislocations are modest.”
Two conditions would justify a strong style tilt right now: clear, persistent valuation gaps across styles, or macro conditions that strongly favour one style over another. Neither is cleanly present entering H2 2026. If your portfolio still carries an oversized value or growth tilt inherited from the H1 barbell, that tilt is no longer supported by the valuation evidence that created it. Holding it now adds risk without a matching return expectation.
The capital rotation in 2026 has already begun reshaping sector leadership in measurable ways: energy gained more than 22% year-to-date by mid-June while the broad Morningstar US Market Index returned less than 1%, a gap that reflects the same rebalancing away from stretched AI and mega-cap valuations that the H1 style convergence described in this article set in motion.
When big ASX news breaks, our subscribers know first
The small-cap case: strongest rally in three decades, still undervalued
The paradox is worth sitting with. The Morningstar US Small Cap Market Index outperformed the broad US market by more than 3 percentage points and large-caps by more than 5 percentage points in the first half of 2026. That is the strongest small-cap first-half showing in over three decades. And yet, as of end of June, small-caps still screen as slightly undervalued on Morningstar’s fair-value measures.
The explanation is straightforward: the H1 rally was a partial correction, not a full normalisation. Small-caps entered 2026 at much deeper discounts after an extended period of underperformance. The first half closed part of the gap. Not all of it.
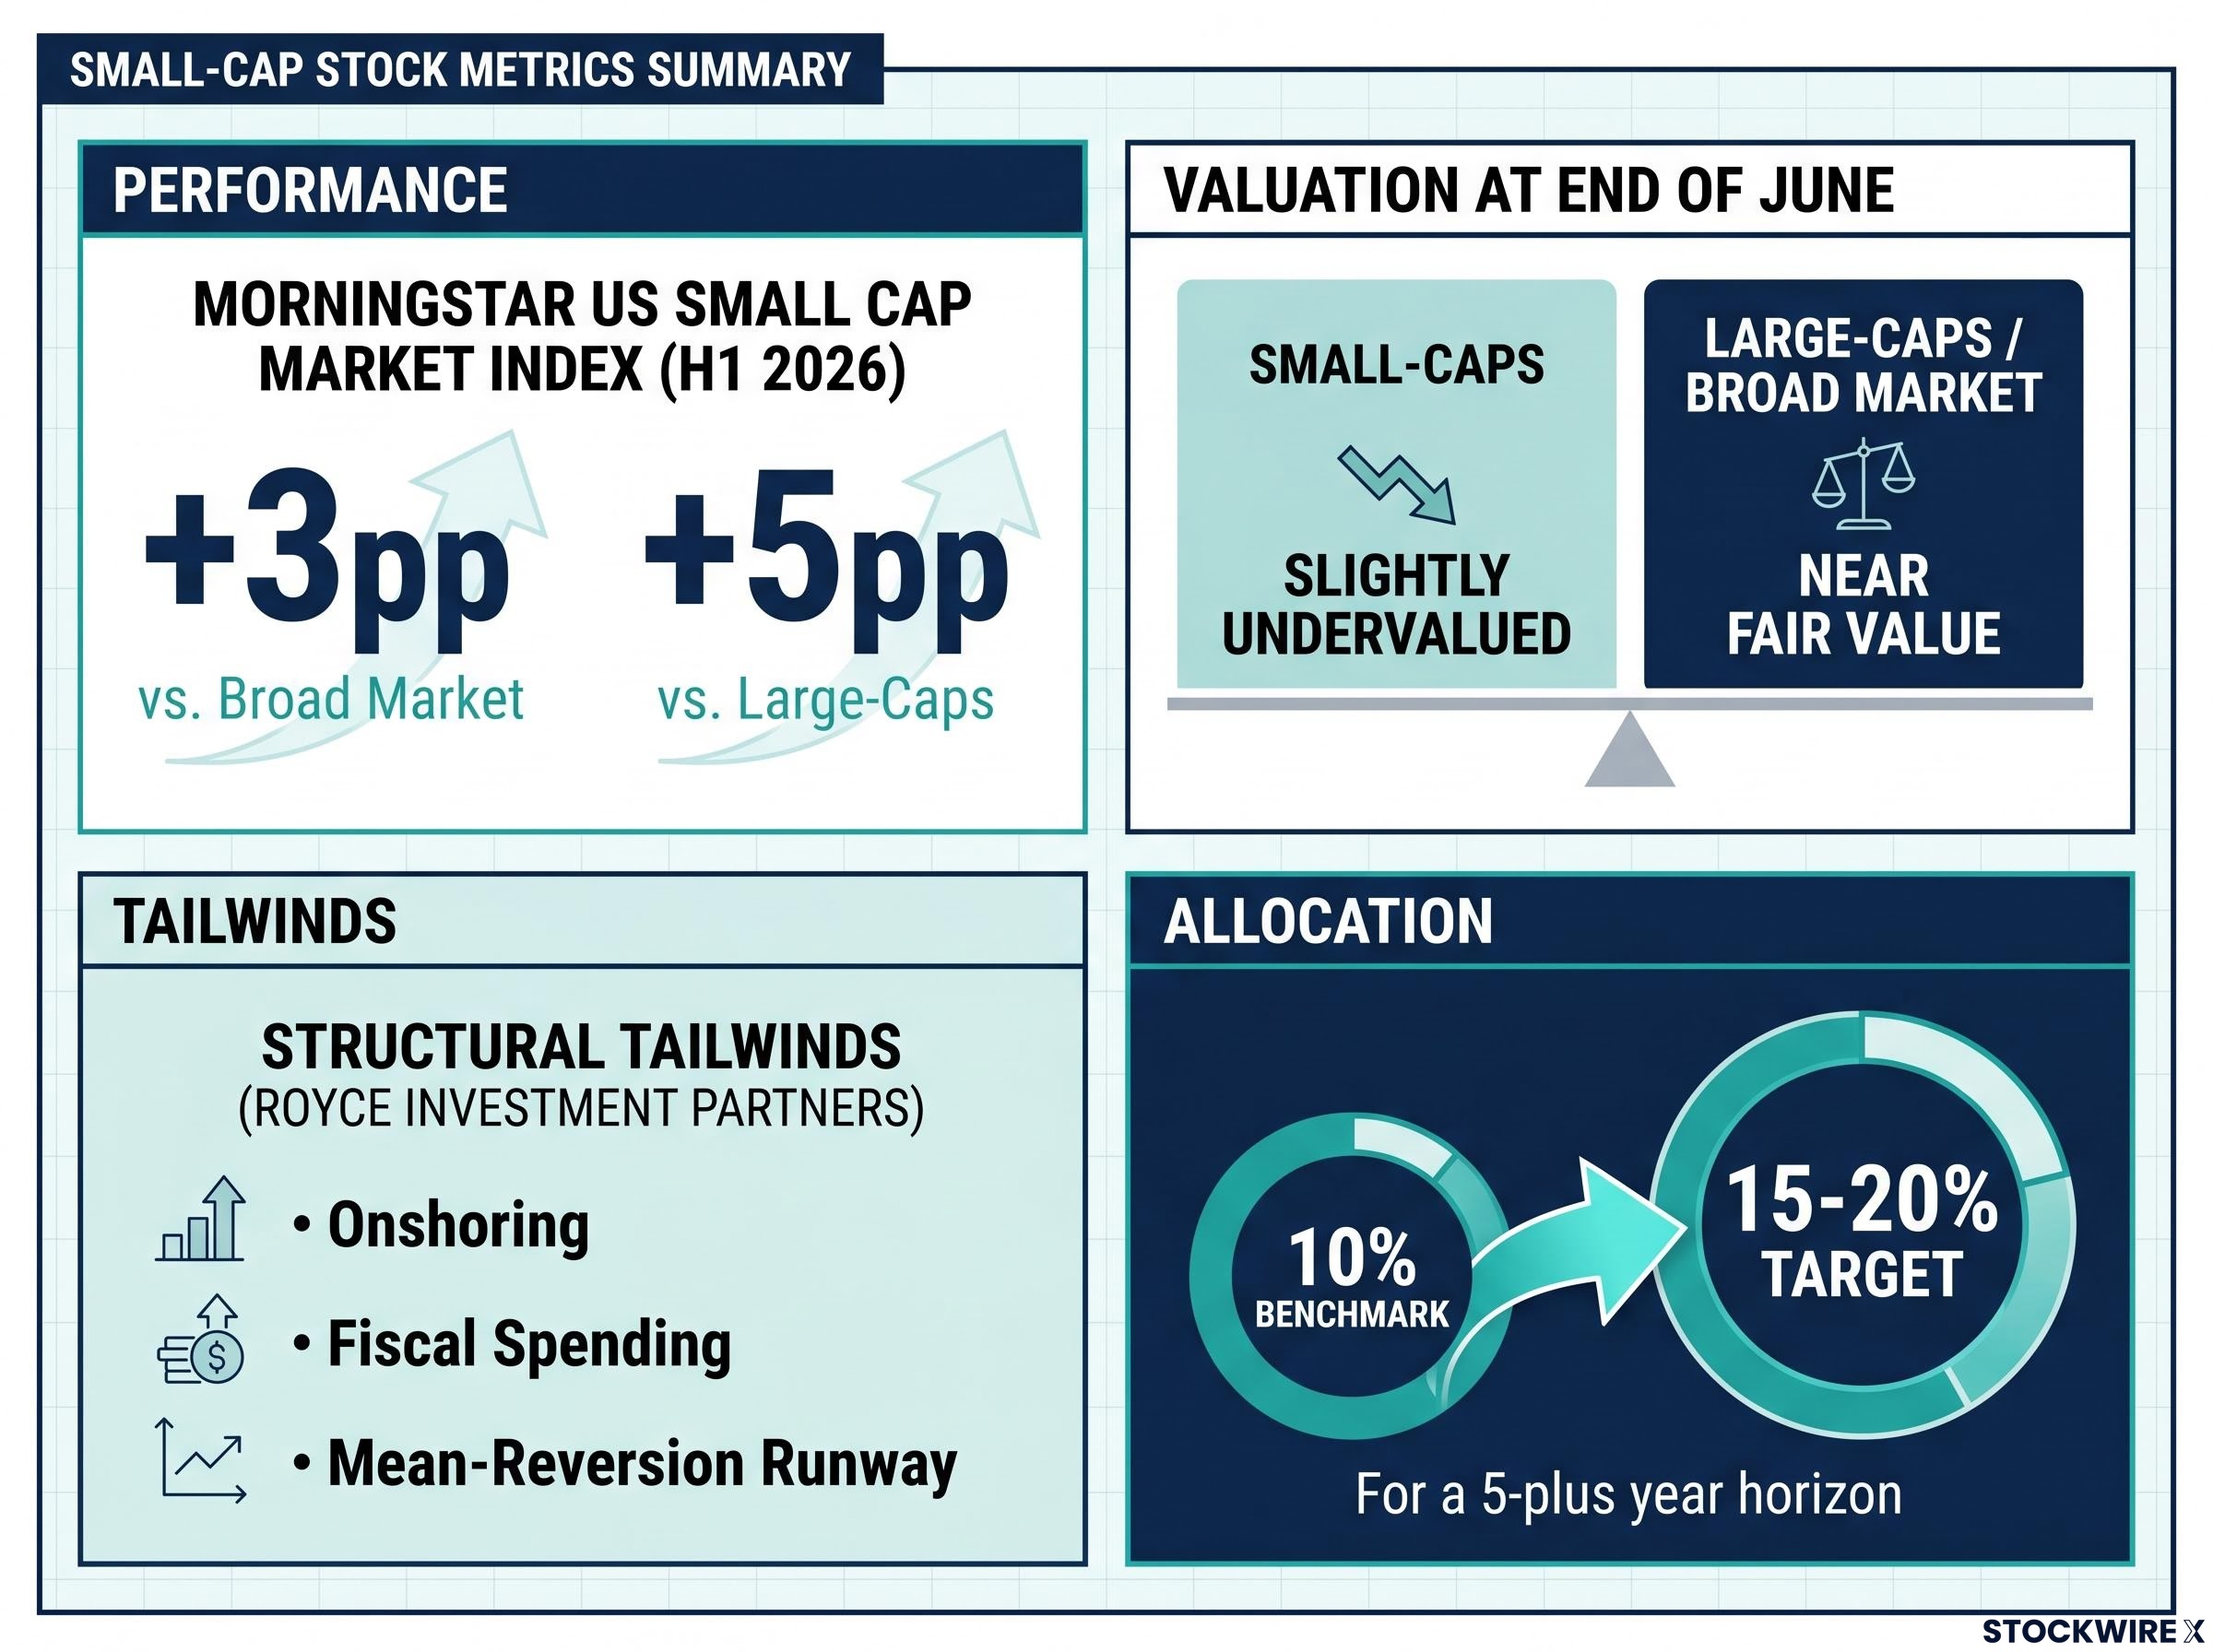
| Metric | Small-Caps (H1 2026) | Broad Market (H1 2026) | Large-Caps (H1 2026) |
|---|---|---|---|
| Relative Performance | +3pp vs. broad market; +5pp vs. large-caps | Benchmark | Lagged small-caps by 5pp |
| Current Valuation (End June) | Slightly undervalued | Near fair value | Near fair value |
| Structural Tailwinds | Onshoring, fiscal spending, mean-reversion runway | Moderate | AI capex concentration (two-directional) |
Two structural tailwinds strengthen the case beyond residual cheapness. Royce Investment Partners highlights that small-caps underperformed for an extended period going into 2026, leaving a long runway for mean reversion. They also identify onshoring and fiscal spending initiatives as an underappreciated multi-year demand driver for domestically focused businesses.
The persistence of the valuation discount after a historic rally tells you the market has not fully repriced small-caps. The overweight thesis is less obvious but still valid, rather than spent.
Sizing the overweight based on your time horizon
If you have a 5-plus year investment horizon, the combination of residual undervaluation, a long prior period of underperformance, and structural tailwinds supports a meaningful overweight. A practical range is 15-20% of your equity allocation, up from a benchmark weight of roughly 10%, with a preference for small-caps that carry identifiable economic moats (a measurable competitive advantage that protects long-term profitability) and solid balance sheets. Morningstar specifically recommends moat-screened names for downside resilience.
Russell 2000 profitability statistics make the quality-screening argument concrete: nearly half of the index’s constituents are currently unprofitable, up from roughly one in four before the Global Financial Crisis, which means a passive allocation captures a structurally deteriorating pool rather than a pure exposure to the valuation gap you are trying to exploit.
If you are closer to a major liquidity event, such as retirement or a large withdrawal, a smaller tactical overweight is more appropriate. Higher volatility and lower liquidity in the small-cap space make oversized positions riskier when your time horizon is short.
Reading the macro backdrop as a risk filter, not a market call
The instinct to “wait for macro clarity” before committing capital is understandable. It is also, in the current environment, counterproductive. The backdrop right now, soft but stable growth, sticky but moderating inflation, range-bound long rates, is precisely the type of environment where staying invested and using macro as a sizing tool outperforms rotating into defensives.
Here are the four conditions that define the macro picture, paired with what each one means for your portfolio:
- US growth holding in a narrow band around +2%: Output is running a touch beneath its long-run ceiling, yet the trajectory is steady enough to sustain equity performance, including domestically oriented small-caps. Nothing in this reading points toward recession.
- Inflation set to ease as energy costs retreat: A permanent heavy skew toward commodities is not warranted, but businesses with genuine pricing power remain worth holding alongside your core equity positions.
- One or two federal-funds rate increases still anticipated before year-end: Elevated borrowing costs keep small-cap volatility higher than usual, though for investors with a longer time horizon this does not undermine the case for holding an overweight.
- Long-term yields expected to stay within a contained range for the remainder of H2: A repeat of the sharp rate-driven valuation compression seen in 2022-23 is not the central scenario, which in turn lowers the opportunity cost of remaining in equities rather than retreating to cash or very short-duration instruments.
Standard Chartered’s H2 2026 Global Market Outlook frames this as requiring a “more deliberate approach” to portfolio construction, highlighting selective opportunities across US and Asia ex-Japan equities.
Use macro as a risk filter and sizing tool, not as a reason to abandon a fundamentally driven equity allocation.
Range-bound long rates mean the scenario that crushed valuations in 2022-23 is not the base case for H2 2026. That is a direct argument for staying invested in equities rather than defensively accumulating cash.
Key risks to monitor and manage across your portfolio
Navigating this environment calls for targeted risk awareness, not defensive retreat. Four distinct exposures deserve explicit attention: each operates through its own transmission channel and calls for its own portfolio response. Taken together, they are manageable through disciplined construction rather than wholesale selling.
| Risk | Mechanism | Affected Holdings | Portfolio Response |
|---|---|---|---|
| AI capex concentration | Spending is large and concentrated in hyperscalers and semiconductor leaders; slowdown or reversal hits multiple sectors simultaneously | Semiconductors, cloud platforms, data-centre REITs, AI-adjacent software | Map AI exposure explicitly; avoid unknowingly running a single concentrated bet across multiple holdings; favour quality firms with diverse revenue streams |
| Private credit stress | Stress surfaces quietly before public contagion; credit cycle dynamics can surprise equity investors | Financials with heavy private credit, direct lending, or structured product exposure | Maintain a liquidity buffer as optionality to buy dislocations; favour conservatively underwritten institutions |
| China/global growth | Key swing factor for global commodities, multinational earnings, and EM/Asia ex-Japan allocations | Commodity-linked holdings, multinationals with China revenue, EM equity positions | Ensure China or EM exposure is intentional, explicitly sized, and diversified across broad vehicles |
| Yen depreciation/carry-trade volatility | Persistent yen weakness can trigger sudden cross-asset sell-offs when leveraged positions unwind | Primarily a volatility and liquidity risk for US-centric portfolios | Avoid excessive leverage; maintain diversified funding sources; treat as a reminder to keep position sizes manageable |
AI capex concentration is particularly worth your attention because it can be invisible. A portfolio that looks diversified across sectors may still be running a single concentrated AI-spend bet if multiple holdings share the same primary revenue driver. Map it explicitly before assuming your diversification is real.
Index fund concentration compounds the AI capex mapping problem: five mega-cap stocks controlled approximately 23% of the broad US market index as of mid-April 2026, meaning a portfolio that holds both a US total market fund and an S&P 500 fund may be running near-identical AI and mega-cap exposure across both vehicles without realising it.
The unifying principle: none of these risks requires you to sell everything. All are addressable through explicit sizing, diversification, and a modest liquidity buffer.
Three portfolio moves to make before August
These are complementary moves, not competing priorities. The style rebalance and the small-cap overweight can coexist within the same portfolio because small-caps span value, core, and growth buckets. Here is what to do and what “done” looks like for each step.
- Align style weights with current valuations
- Reduce any lingering overweights to value or growth that remain from earlier barbell positioning, bringing allocations to a broadly even spread across value, core, and growth
- Restore core to a full weight if it was previously cut; in uncertain macro conditions, core holdings act as a stabilising force within the portfolio
- Let valuation and business quality drive individual security selection rather than defaulting to style-box labels
- Maintain or rebuild a small-cap overweight
- Target 15-20% of your equity allocation (illustrative, not prescriptive), up from a benchmark weight of roughly 10%
- Favour names with economic moats and solid balance sheets, as recommended by Morningstar, for greater downside resilience
- If you trimmed small-caps after the H1 rally, consider re-establishing the position; the valuation thesis has narrowed but not closed
- Map and manage concentration risks across AI, credit, and China exposure
- Identify how much of your portfolio’s earnings and valuation are tied directly or indirectly to AI infrastructure spend, private credit, and China demand
- Use that map to diversify across sectors and regions, and keep leverage low
- Retain a liquidity buffer for episodic volatility, not as a permanent defensive posture but as optionality to buy dislocations
The fact that these three moves can be made within an existing portfolio, without requiring a wholesale reallocation, is itself the point. The defensible H2 2026 stance is a refinement of a long-term equity allocation, not a tactical retreat from it.
Investors who want a systematic method to implement the risk-sizing discipline this article describes will find our full explainer on beta-weighted position sizing, which covers how to convert each holding into market-risk equivalent dollars and apply volatility targeting to keep your actual exposure aligned with your intended risk level.
What to watch in H2 that could change the calculus
Your positioning should not be static. Four signals would shift the current stance, and knowing them in advance protects you from both ignoring important information and overreacting to noise.
- A significant valuation gap reopening across styles: If one style becomes clearly cheap relative to others (as growth did during the H1 selloff), a strong tilt would be justified again. Monitor Morningstar or equivalent fair-value estimates monthly, not daily.
- A sustained move in long rates above the range-bound scenario: If long rates break meaningfully higher, the “duration shock” risk to growth stocks returns and the relative attractiveness of cash and short-duration instruments rises. This would change the stay-invested calculus.
- Clear evidence of AI capex deceleration: Watch semiconductor and cloud earnings reports for signs that hyperscaler spending is slowing. A confirmed deceleration would narrow the market’s leadership and potentially trigger a rotation away from the AI-adjacent sectors that have led since 2023.
- Signals of private credit stress migrating into public markets: Private credit stress tends to surface quietly before public contagion appears. Watch for widening spreads in publicly traded credit instruments, rising loan-loss provisions at banks with private credit exposure, or unusual redemption activity in listed credit vehicles.
These are update triggers, not predictions. You are not being asked to forecast whether any of these will happen. You are being asked to know, in advance, what would change your positioning.
Staying calibrated without getting whipsawed
The overarching principle is worth stating plainly: macro views inform sizing and risk awareness, not wholesale rotations. If you apply this framework, you will make smaller, more frequent calibrations rather than large reactive moves. That behavioural discipline, the willingness to adjust by degrees rather than lurch between conviction and panic, is itself a source of long-term return.
This article is for informational purposes only and should not be considered financial advice. Investors should conduct their own research and consult with financial professionals before making investment decisions. Past performance does not guarantee future results. Financial projections are subject to market conditions and various risk factors.