Most Americans believe they are financially behind. The uncomfortable truth is that they are comparing themselves to a number almost no one actually represents.
That number is a mean net worth inflated into meaninglessness by the ultra-wealthy, sitting alongside a social media feed algorithmically curated to show you the top fraction of a percent of trading outcomes.
This is not just an academic curiosity. When you measure your progress against distorted data, you make real decisions: taking on debt to signal status, chasing high-risk trades to catch up, or disengaging from investing altogether out of despair. Each response tends to deepen the gap rather than close it.
So here is a framework for reading your actual financial position accurately, identifying the financial progress benchmarks worth tracking, and recognising the behavioural traps that catch people who feel behind. Treat it as a diagnostic tool, not a lecture. By the time you finish, you will know which numbers are lying to you and which ones are worth watching.
Why the “average” net worth figure is almost useless as a benchmark
The average net worth of a U.S. family sounds aspirational: $1,063,700, according to the Federal Reserve’s 2022 Survey of Consumer Finances. If that is your yardstick, you probably feel a long way from the mark.
Now look at the median for the same year: $192,900. The median is the true midpoint, the household with exactly as many families richer as poorer.
The gap between those two figures is not a rounding issue. It exceeds a 5:1 ratio, and that ratio is a structural feature of extreme wealth concentration at the very top pulling the average skyward.
The median-to-mean ratio for U.S. household net worth exceeds 5:1. That single fact tells you the “average” is being dragged upward by a small number of very wealthy households.
The mean is the figure most headlines cite, because it is larger and more dramatic. But using it as a personal benchmark is like measuring your commute time against an average that includes people who took private jets. The number is mathematically accurate and practically useless.
Thomas Stanley’s research offers a self-referenced alternative to the Federal Reserve mean: wealth accumulator benchmarks derived from your own age and income, not a national average distorted by billionaire portfolios, so the comparison reflects your actual accumulation trajectory rather than an outlier-skewed statistic.
That distortion is widening, too. The 2019 SCF showed a median of $141,100 against a mean of $868,000 in 2022-adjusted dollars. The gap between typical and average has grown, not shrunk.
Here is what that means for you. If you have been running a race against the “average American” and feeling defeated, you have been chasing a finish line that was never where you thought it was.
What your net worth looks like by age, using the real midpoint
Wealth accumulates progressively, climbing through your working years before easing in retirement. Measured against the real midpoint for your age bracket, your position may look considerably healthier.
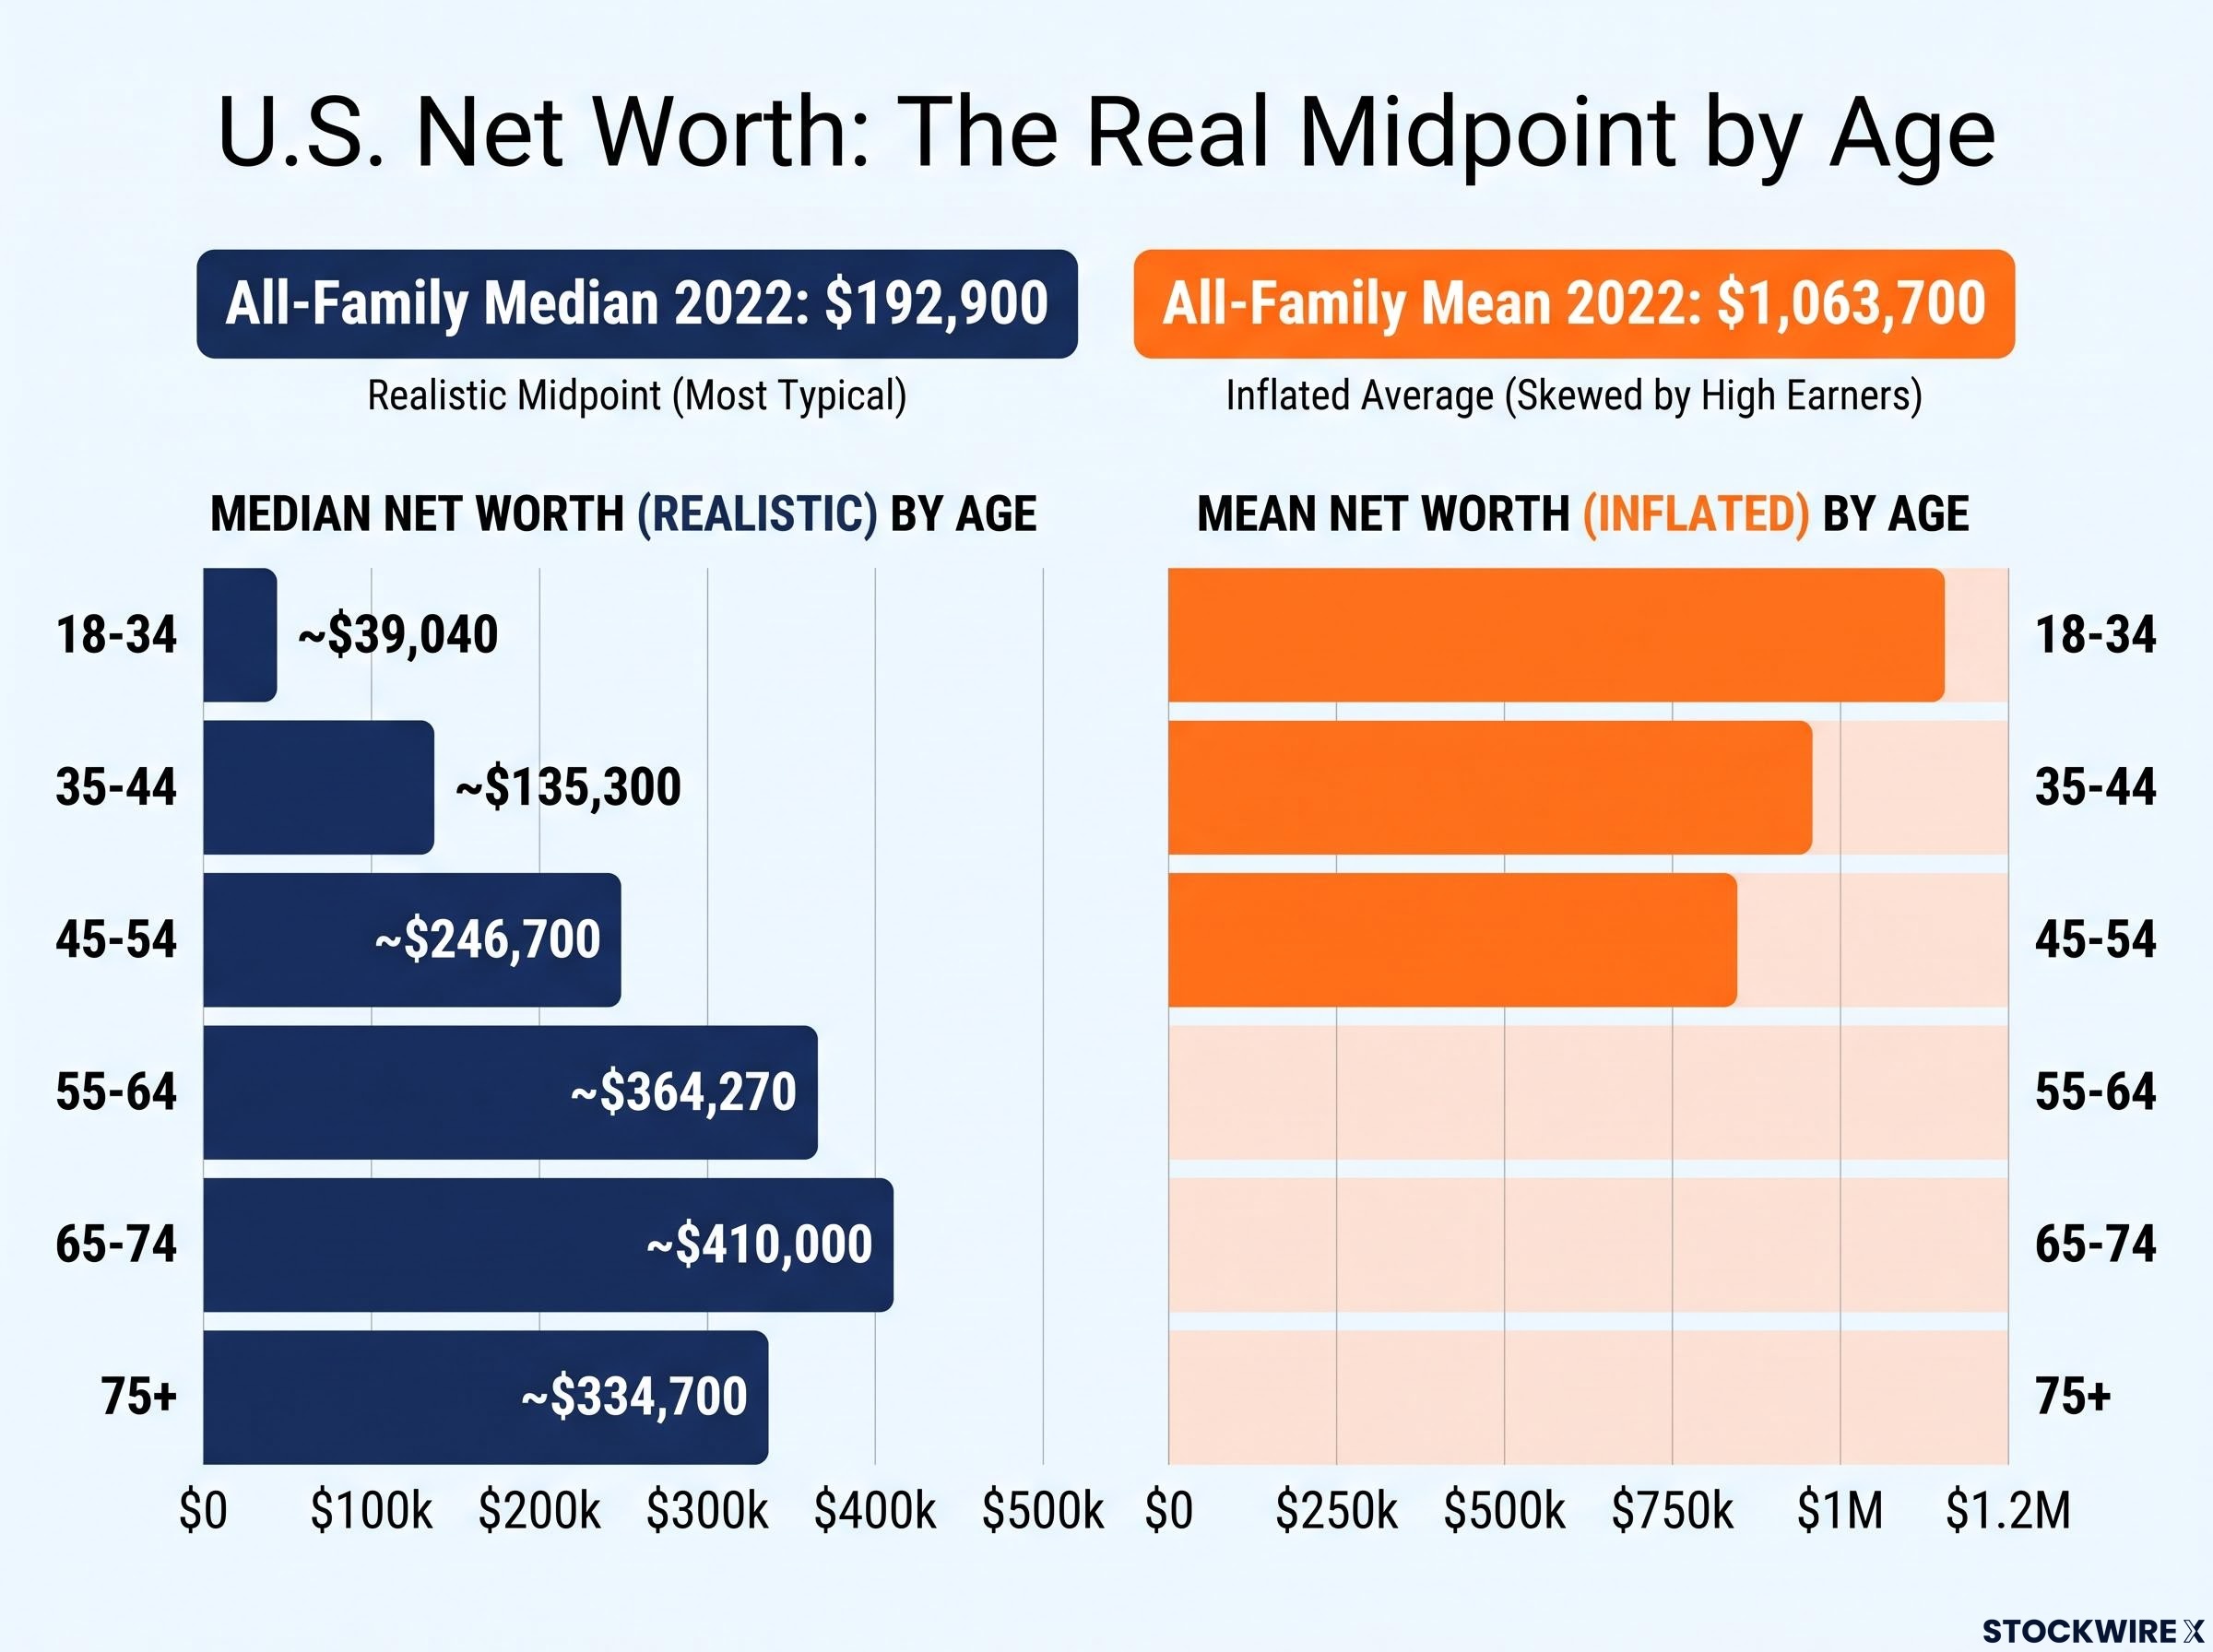
| Age Group | Median Net Worth | Mean Net Worth |
|---|---|---|
| 18-34 | ~$39,040 | All-family mean: $1,063,700 |
| 35-44 | ~$135,300 | All-family mean: $1,063,700 |
| 45-54 | ~$246,700 | All-family mean: $1,063,700 |
| 55-64 | ~$364,270 | All-family mean: $1,063,700 |
| 65-74 | ~$410,000 | All-family mean: $1,063,700 |
| 75+ | ~$334,700 | All-family mean: $1,063,700 |
Notice the shape of that progression. The 55-64 median of roughly $364,270 is nearly double the 35-44 median of about $135,300, which tells you time and compounding, not a sudden windfall, are doing the heavy lifting.
When big ASX news breaks, our subscribers know first
The math of millionaires versus the myth of early wealth
If your social media feed is to be believed, wealth is built by 35. The data describes something close to the opposite.
Most households that reach millionaire status get there in their late 50s or early 60s, after decades of saving and asset growth. A 2026 Investopedia review and historic Business Insider data place the average age of a millionaire household between 61 and 63, and that average has crept up over time, from roughly 57 in 1992 to about 61 by 2022.
The age distribution makes the timeline concrete:
- Only about 1.4% of households headed by someone under 30 have net worth above $1 million.
- Roughly 25% of households headed by someone 50 or older qualify as millionaires, rising to around 27% for those in their 60s.
- A Ramsey Solutions survey of 10,000 millionaires reported an average participant age of 63, with 63% reaching that status between ages 45 and 64. As a single survey, treat that figure as illustrative rather than definitive.
63% of millionaires reached that status between ages 45 and 64, according to Ramsey Solutions.
The viral “built wealth by 35” narrative, then, describes a statistically marginal group, not a repeatable path. It is the exception written up as the rule.
Reframe the timeline and the pressure eases. If the typical millionaire household arrives around age 61 to 63, a 40-year-old who is steadily saving is not behind. You are simply partway up a decades-long accumulation curve that has not finished yet.
What you see on someone else’s balance sheet versus what you think you see
Your neighbour pulls into the driveway in a new Mercedes. The instinctive read is that they are doing well. But net worth is entirely invisible, while debt-financed consumption is highly visible, and human pattern recognition is poorly calibrated to tell the two apart.
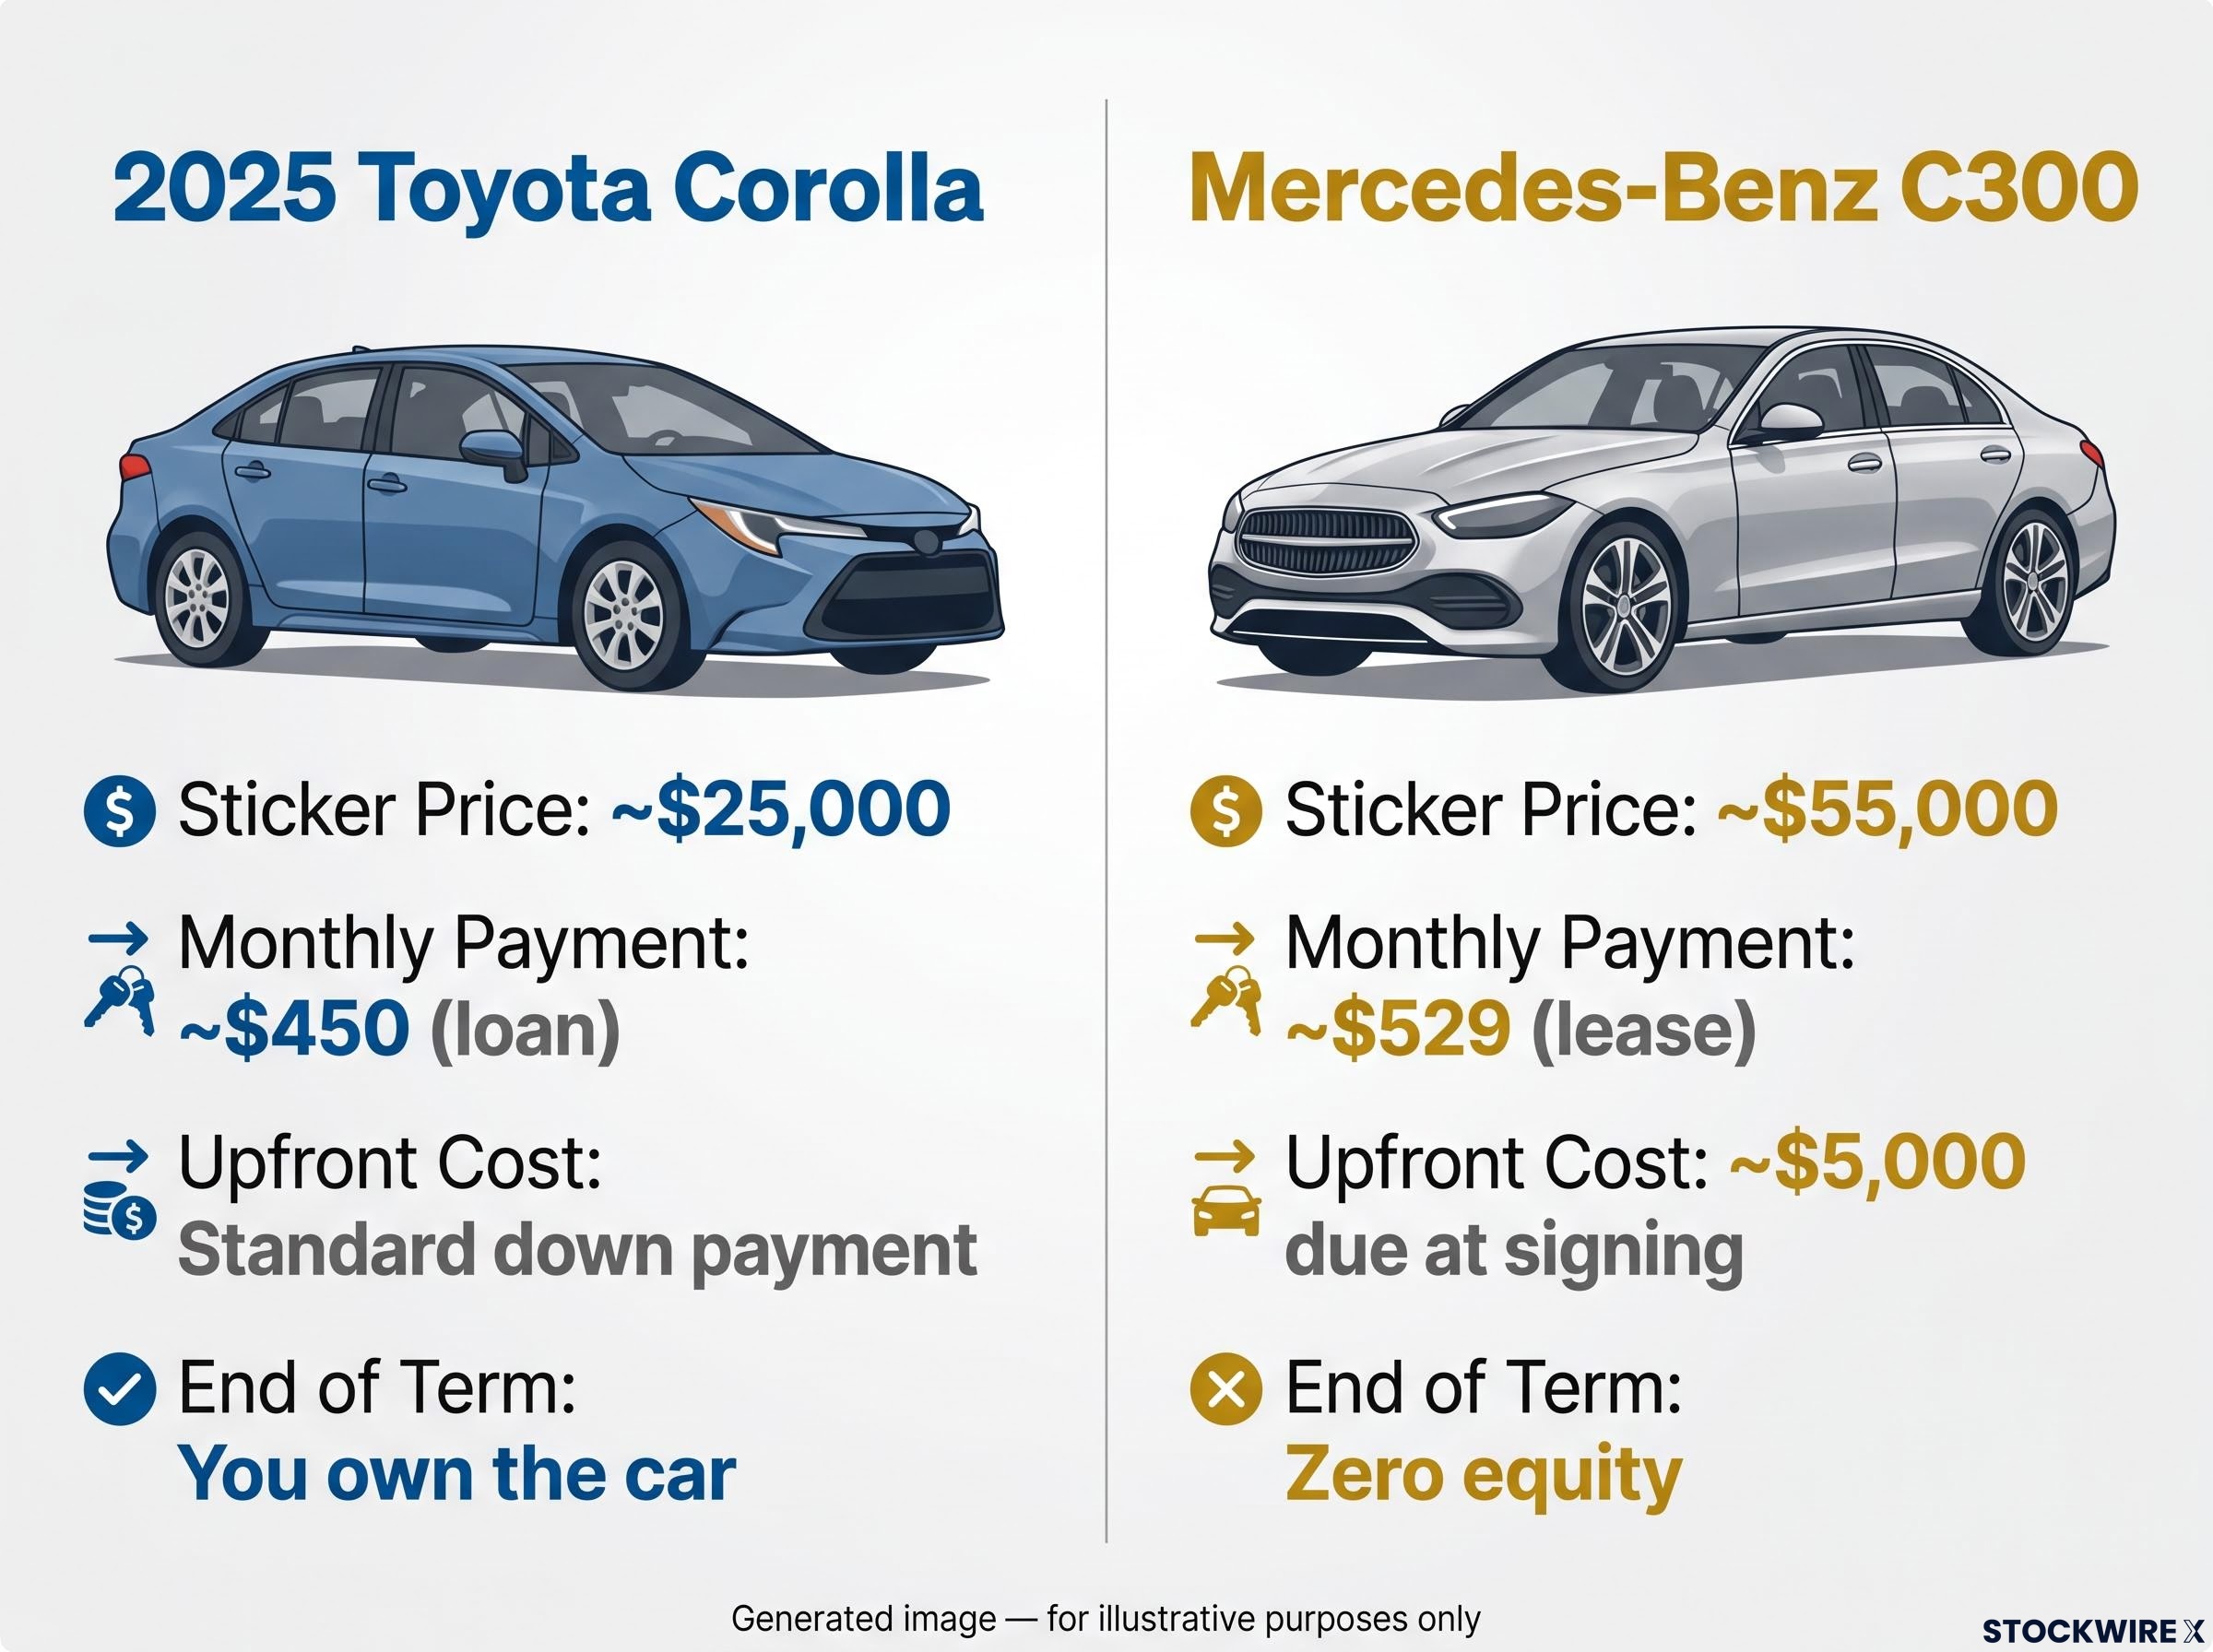
Consider two vehicles that look worlds apart on the forecourt but nearly identical on a monthly statement. A 2025 Toyota Corolla stickers at around $25,000 with a loan payment near $450 a month. A Mercedes-Benz C300 retails at about $55,000, yet a lease can carry a comparable payment of around $529 a month.
| Vehicle | Sticker Price | Monthly Payment | Upfront Cost | Equity at End of Term |
|---|---|---|---|---|
| 2025 Toyota Corolla | ~$25,000 | ~$450 (loan) | Standard down payment | You own the car |
| Mercedes-Benz C300 | ~$55,000 | ~$529 (lease) | ~$5,000 due at signing | Zero equity |
The lease structure makes a car worth more than twice as much appear comparable on a monthly basis, while delivering no ownership at the end and requiring a lump sum just to drive away. The monthly number flatters. The balance sheet tells the truth.
Debt-financed consumption creates a net worth gap that compounds silently: two households on identical incomes can diverge by more than $571,000 over a decade when one finances lifestyle through leases and credit while the other directs the same dollar amount into appreciating assets.
The numbers behind the lifestyle you are comparing yourself to
Zoom out from the driveway to the national ledger, and the scale of financing becomes hard to ignore.
Total U.S. household debt reached $18.04 trillion in Q4 2024, according to the Federal Reserve Bank of New York.
Credit card balances climbed from $1.14 trillion in Q2 2024 to $1.21 trillion by Q4 2024. Auto loan balances rose from roughly $1.63 trillion to $1.66 trillion over the same window.
Borrower-level data sharpens the picture. TransUnion reported 170.1 million consumers carrying a bankcard balance in Q2 2024, at an average of $6,329 each, alongside 80.2 million auto loan accounts averaging $24,199.
That average credit card balance, multiplied across 170 million borrowers, represents consumption largely financed rather than funded by accumulated wealth. Here is the takeaway. A meaningful share of the confidence and abundance you observe around you is borrowed, not earned, and adjusting your reference point accordingly changes how far behind you actually feel.
The behavioural traps that catch people who feel behind
Feeling behind is not a character flaw. It is a predictable response to a distorted information environment, and it tends to produce three failure modes that all trace back to the benchmarking problems above.
- Conspicuous consumption on credit: signalling status through financed purchases, which worsens your position while mimicking the very illusion that made you feel behind.
- Speculative catch-up trading: using zero-fee apps to chase concentrated bets aimed at rapid, restorative gains.
- Avoidance and disengagement: stepping away from saving and investing entirely, often the least visible response and the most damaging.
The catch-up trade deserves a closer look, because it is the one that feels most like a solution. The data says otherwise, and it says so in descending order of severity:
- Day traders: roughly 10-15% show a net profit in a single year, but only 1-3% stay profitable over three years or more once costs, taxes and slippage are counted. Around 80% lose money net of costs.
- Futures traders: approximately 97% of those who persist for at least 300 trading days are unprofitable.
- Options traders: between 70% and 85% lose money over a year, concentrated in short-term directional bets.
Only 1-3% of retail day traders remain profitable over three years or more.
Survivorship bias is what obscures those odds. Trading forums surface the extremes: in one referenced week on the WallStreetBets subreddit, top posts featured a trader turning a paycheck into $250,000, while a trader who lost $67,000 after being laid off drew far less attention. You see the winners loudly and the losers quietly, so the outcomes feel far more replicable than the numbers allow.
Survivorship bias distorts the apparent success rate of concentrated bets, leverage, and stock concentration strategies for the same structural reason it inflates trading win rates: the investors who lost money using those approaches rarely become the public voices promoting them, so the documented failure rates stay hidden behind a selection of visible winners.
Disengagement is the quietest trap and often the costliest. Stepping away forecloses the compounding that would have closed the perceived gap over time, guaranteeing you fall further behind rather than catching up.
Here is the clarifying point. If you have ever felt the pull to make back a gap through concentrated trading, the strategy that feels most tempting when you are behind is also the one with the highest documented failure rate.
The benchmarks that actually predict long-term financial health
Diagnosis is only useful if it leads somewhere. The corrective is to swap cross-sectional net worth comparisons for benchmarks that are self-referenced, trajectory-based and resilience-oriented, because those are what actually predict long-term outcomes.
- Savings and investment rate. The percentage of income you consistently direct into savings and investments each year is more predictive of future wealth than your current net worth rank.
- Resilience metrics. Emergency fund coverage and debt-to-income ratios, which measure your capacity to absorb a shock.
- Goal-based contribution tracking. Whether your retirement contributions are on schedule for your chosen retirement age, and whether high-interest debt is being retired on a plan.
| Benchmark | What It Measures | Why It Beats Net Worth Comparisons |
|---|---|---|
| Savings and investment rate | Direction and speed of wealth building | You can move it this year; net worth rank you cannot |
| Resilience metrics | Capacity to absorb a financial setback | Immune to outlier and survivorship distortion |
| Goal-based tracking | Progress toward your own targets | Referenced to your life, not society at large |
The median net worth figure of $192,900 tells you nothing about your own trajectory. A savings rate tells you your direction and speed, and that is the difference between measuring what you can change and measuring what you cannot.
Wealthy household asset allocation data from the Federal Reserve’s own Survey of Consumer Finances shows the divergence is not driven by exotic instruments: business equity climbs to roughly 41% of net worth at the top of the distribution while cash and primary housing shrink, revealing a proportional shift accessible to any accumulator who redirects spending toward productive assets.
Measuring resilience instead of rank
Resilience metrics are the stress tests of your balance sheet. Aim to hold several months of essential expenses in liquid cash as an emergency fund, which is the buffer that keeps a job loss or medical bill from becoming a financial spiral.
Then watch your debt. Consumer financial guidance generally flags a debt-to-income ratio above a certain threshold as requiring attention, and debt-service-to-income tells you how burdensome your current borrowing really is.
These figures tell you how much capacity you have to absorb a setback, which is a far more useful read on your financial security than your position on a percentile chart.
Measuring what moves, not what flatters
Distorted benchmarks produce distorted emotional responses. The corrective is not motivation, it is better measurement.
Systemic inequality is real, and some gaps genuinely are structural. But there is a difference between the structural reality you cannot control and the self-inflicted damage of chasing the wrong signals: the debt taken on to look wealthy, the concentrated bet placed to catch up, the retreat from investing altogether.
You now know the difference between a mean and a median, a winner and a survivor, an asset and a lease. The most useful thing to carry forward is not a number but a habit.
Every time you encounter a wealth figure, ask whether it is a mean or a median, a winner or a survivor, an asset or a lease.
Behavioural research consistently associates one thing with better long-term outcomes: keeping your attention on the factors you control and off the financial appearances of others. Progress measured by trajectory, resilience and your own goals is not a consolation prize. It is the framework the data actually supports.
This article is for informational purposes only and should not be considered financial advice. Investors should conduct their own research and consult with financial professionals before making investment decisions. Past performance does not guarantee future results, and financial projections are subject to market conditions and various risk factors.