
The Federal Reserve’s own data on how wealthy households invest does not show portfolios stuffed with hedge funds, private equity, or exotic instruments. The 2022 Survey of Consumer Finances (SCF), a triennial Federal Reserve study capturing the full balance sheet of U.S. households across every wealth level, reveals something far less glamorous and far more instructive: the gap between wealth-building and wealth-storing households is not about instrument sophistication. It is about asset category selection, and the proportions look strikingly different across the wealth distribution.
The SCF is a triennial survey conducted by the Federal Reserve, capturing the full balance sheet of U.S. households across every wealth level. Its findings reveal that what separates wealth-compounding households from wealth-storing ones is not instrument sophistication. It is asset category selection: whether capital sits in accounts that preserve purchasing power or flows into ownership stakes that grow it.
Here is the specific portfolio shift the data documents, what drives it, and what it tells you about the structural mechanics behind long-run wealth divergence.
What Federal Reserve data actually shows about how portfolios change with wealth
The surface pattern in the SCF data is straightforward: as household wealth rises, cash, vehicles, and the primary residence shrink as a share of net worth. Business equity and financial market assets expand to replace them.
The numbers make the shift concrete. Among middle-income households, business ownership represents a negligible slice of net worth, sitting at around 2%. That figure climbs to roughly 41% at the top of the distribution. Stock holdings follow a similar upward trajectory, moving from approximately 13% of net worth in the middle to more than 30% among the wealthiest households.
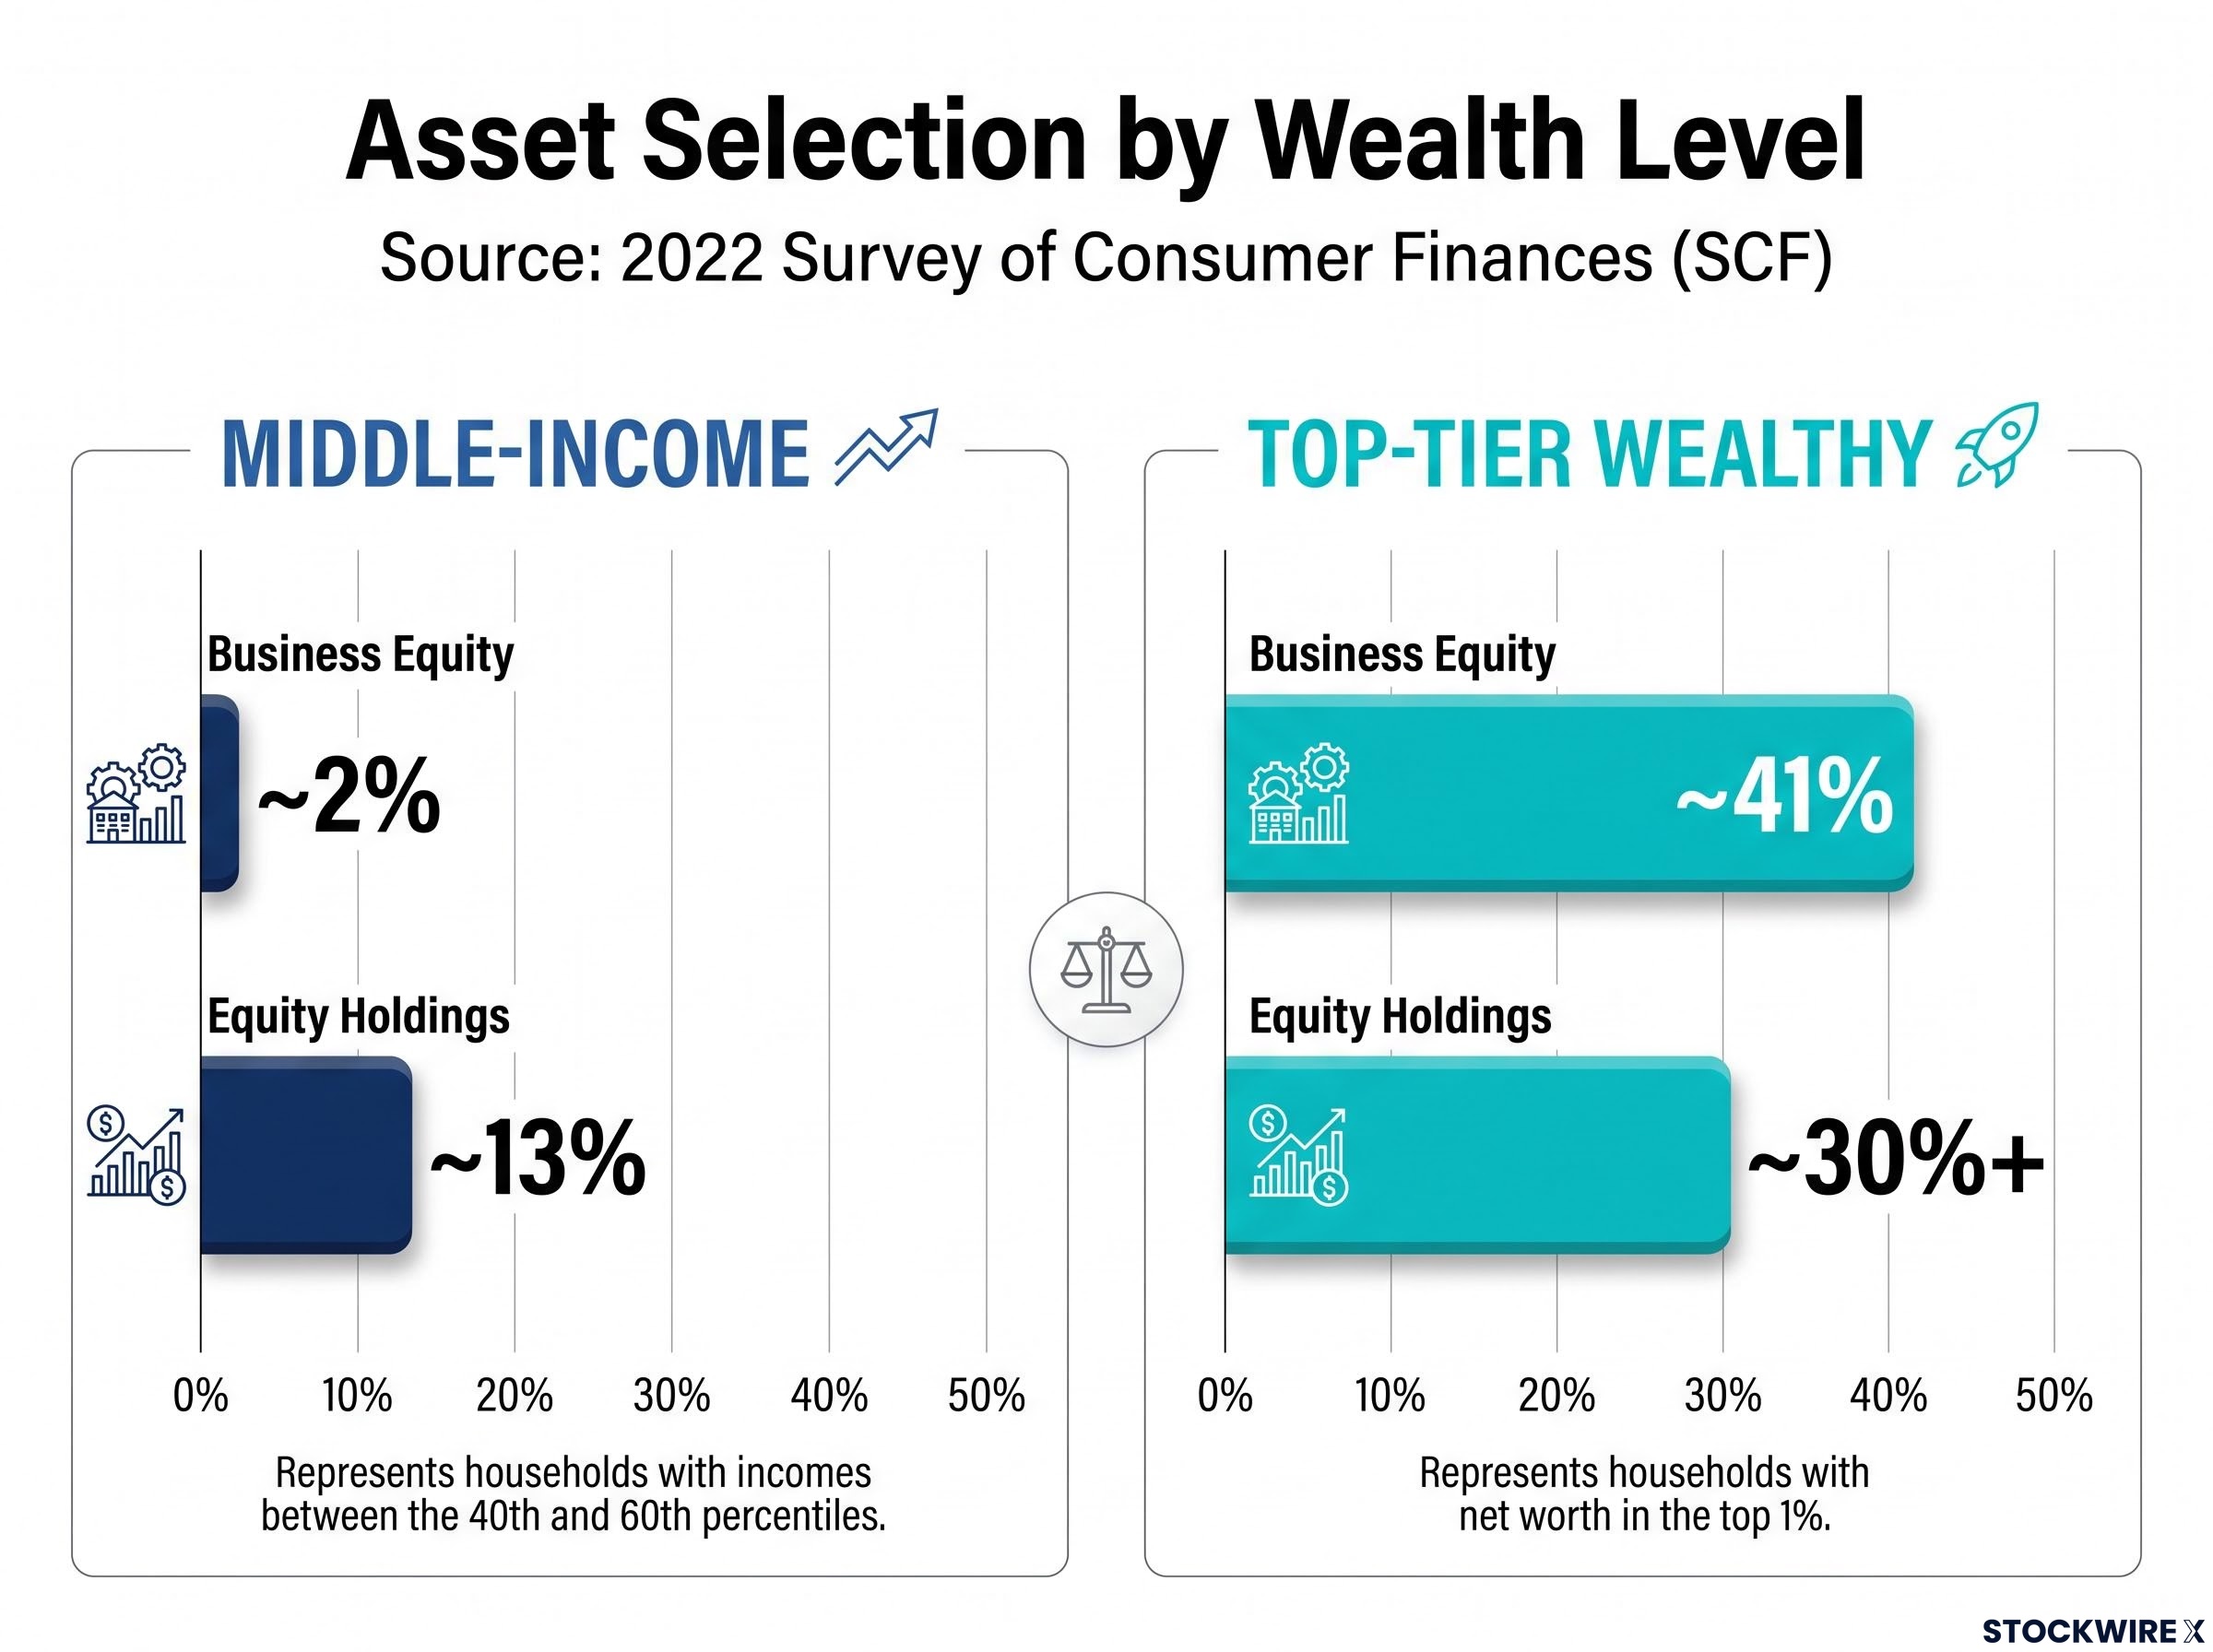
The business equity shift is the most pronounced pattern the SCF data captures. A move from 2% to 41% of net worth tells you the wealthiest households are not simply buying more of the same assets. They are holding a fundamentally different category of claim on economic output.
At the bottom of the distribution, the primary assets are vehicles, savings bonds, and cash-value life insurance. Housing and retirement assets represent roughly 10% of the portfolio. At the top, financial market assets and business equity become the dominant holdings, with housing representing a smaller relative share.
| Asset Class | Middle-Income (% of Net Worth) | Top-Tier Wealthy (% of Net Worth) | Source |
|---|---|---|---|
| Business equity | ~2% | ~41% | Federal Reserve SCF, 2022 |
| Equity holdings | ~13% | ~30%+ | Federal Reserve SCF, 2022 |
| Housing | Dominant single asset | Smaller relative share | Federal Reserve SCF, 2022 |
| Transaction accounts | Large fraction | Small fraction | Federal Reserve SCF, 2022 |
The data tells you that the wealthy are not using different instruments so much as different categories of ownership. Recognising that distinction reframes the question from “what products do they buy” to “what type of asset claim do they hold.”
When big ASX news breaks, our subscribers know first
Why cash and primary housing store value rather than compound it
If the wealthiest households hold proportionally less cash and less primary housing, you need to understand what those assets actually do over time to see why the shift matters.
Transaction accounts, your checking and savings balances, hold purchasing power. They do not generate returns that meaningfully grow over time. Applying the Rule of 72 (a formula that estimates how many years it takes for an investment to double by dividing 72 by the annual return rate) to a savings account rate of 0.01% produces a doubling period of well over 7,000 years for any capital held there.
The Rule of 72 makes the storage cost visible. At 0.01%, cash doubles in 7,000+ years. At a 7% real return in equities, it doubles in roughly 10.3 years. That gap is not a rounding error; it is the compounding mechanism that drives wealth divergence across generations.
That 7,000-year figure is not a misprint. It is the mathematical reality of capital stored rather than deployed. And it is the core reason the SCF data shows cash compressing as a share of net worth at every step up the wealth ladder.
For households still holding large cash balances, savings account alternatives such as high-yield savings accounts and Treasury bills can close part of the gap between storage and compounding without requiring any shift into equities, producing $1,800 to $2,500 annually on a $50,000 balance compared to roughly $50 at a standard big-bank rate.
The primary home as wealth anchor, not wealth engine
Owner-occupied housing provides real value: shelter, stability, and some long-run appreciation. For middle-wealth households, the primary home is often the single largest asset, sometimes constituting the bulk of net worth. That creates a specific problem: single-asset concentration in something that generates no income, carries significant costs (maintenance, property taxes, insurance), and cannot be easily diversified.
At the top of the wealth distribution, housing is still present. But it is dwarfed by business equity and financial market assets. The wealthy own homes without relying on them as the portfolio’s engine. Your primary residence is consumption and shelter. Recognising that distinction is where the compounding question begins.
How broad market equities produce compounding returns over time
Purchasing a broad market index fund means acquiring an ownership stake spread across thousands of companies in a single position. Rather than a speculative wager on one outcome, it is a diversified claim on the collective productive output of the economy, with participation in aggregate growth rather than any single company’s fate.
Historically, the broad U.S. stock market has delivered nominal returns of around 10% per year over the long run. Once long-run inflation of approximately 3% annually is subtracted, the residual real return settles near 7% per year in purchasing-power terms. These are long-run historical averages, not guaranteed figures, and the market experiences significant short-term volatility, including sharp annual declines.
The mechanics documented in the SCF align closely with the six principles behind long-term wealth accumulation that researchers have identified across the historical record: diversified equities have delivered approximately 7% real annual returns since 1802, outperforming bonds, gold, and cash across every sufficiently long measurement period.
At 7% real returns, the compounding timeline looks like this:
- 10 years: Your capital approximately doubles once
- 20 years: Your capital approximately doubles twice (four times your starting point)
- 30 years: Your capital undergoes nearly three full doublings, with each dollar growing to roughly $7 in inflation-adjusted purchasing power
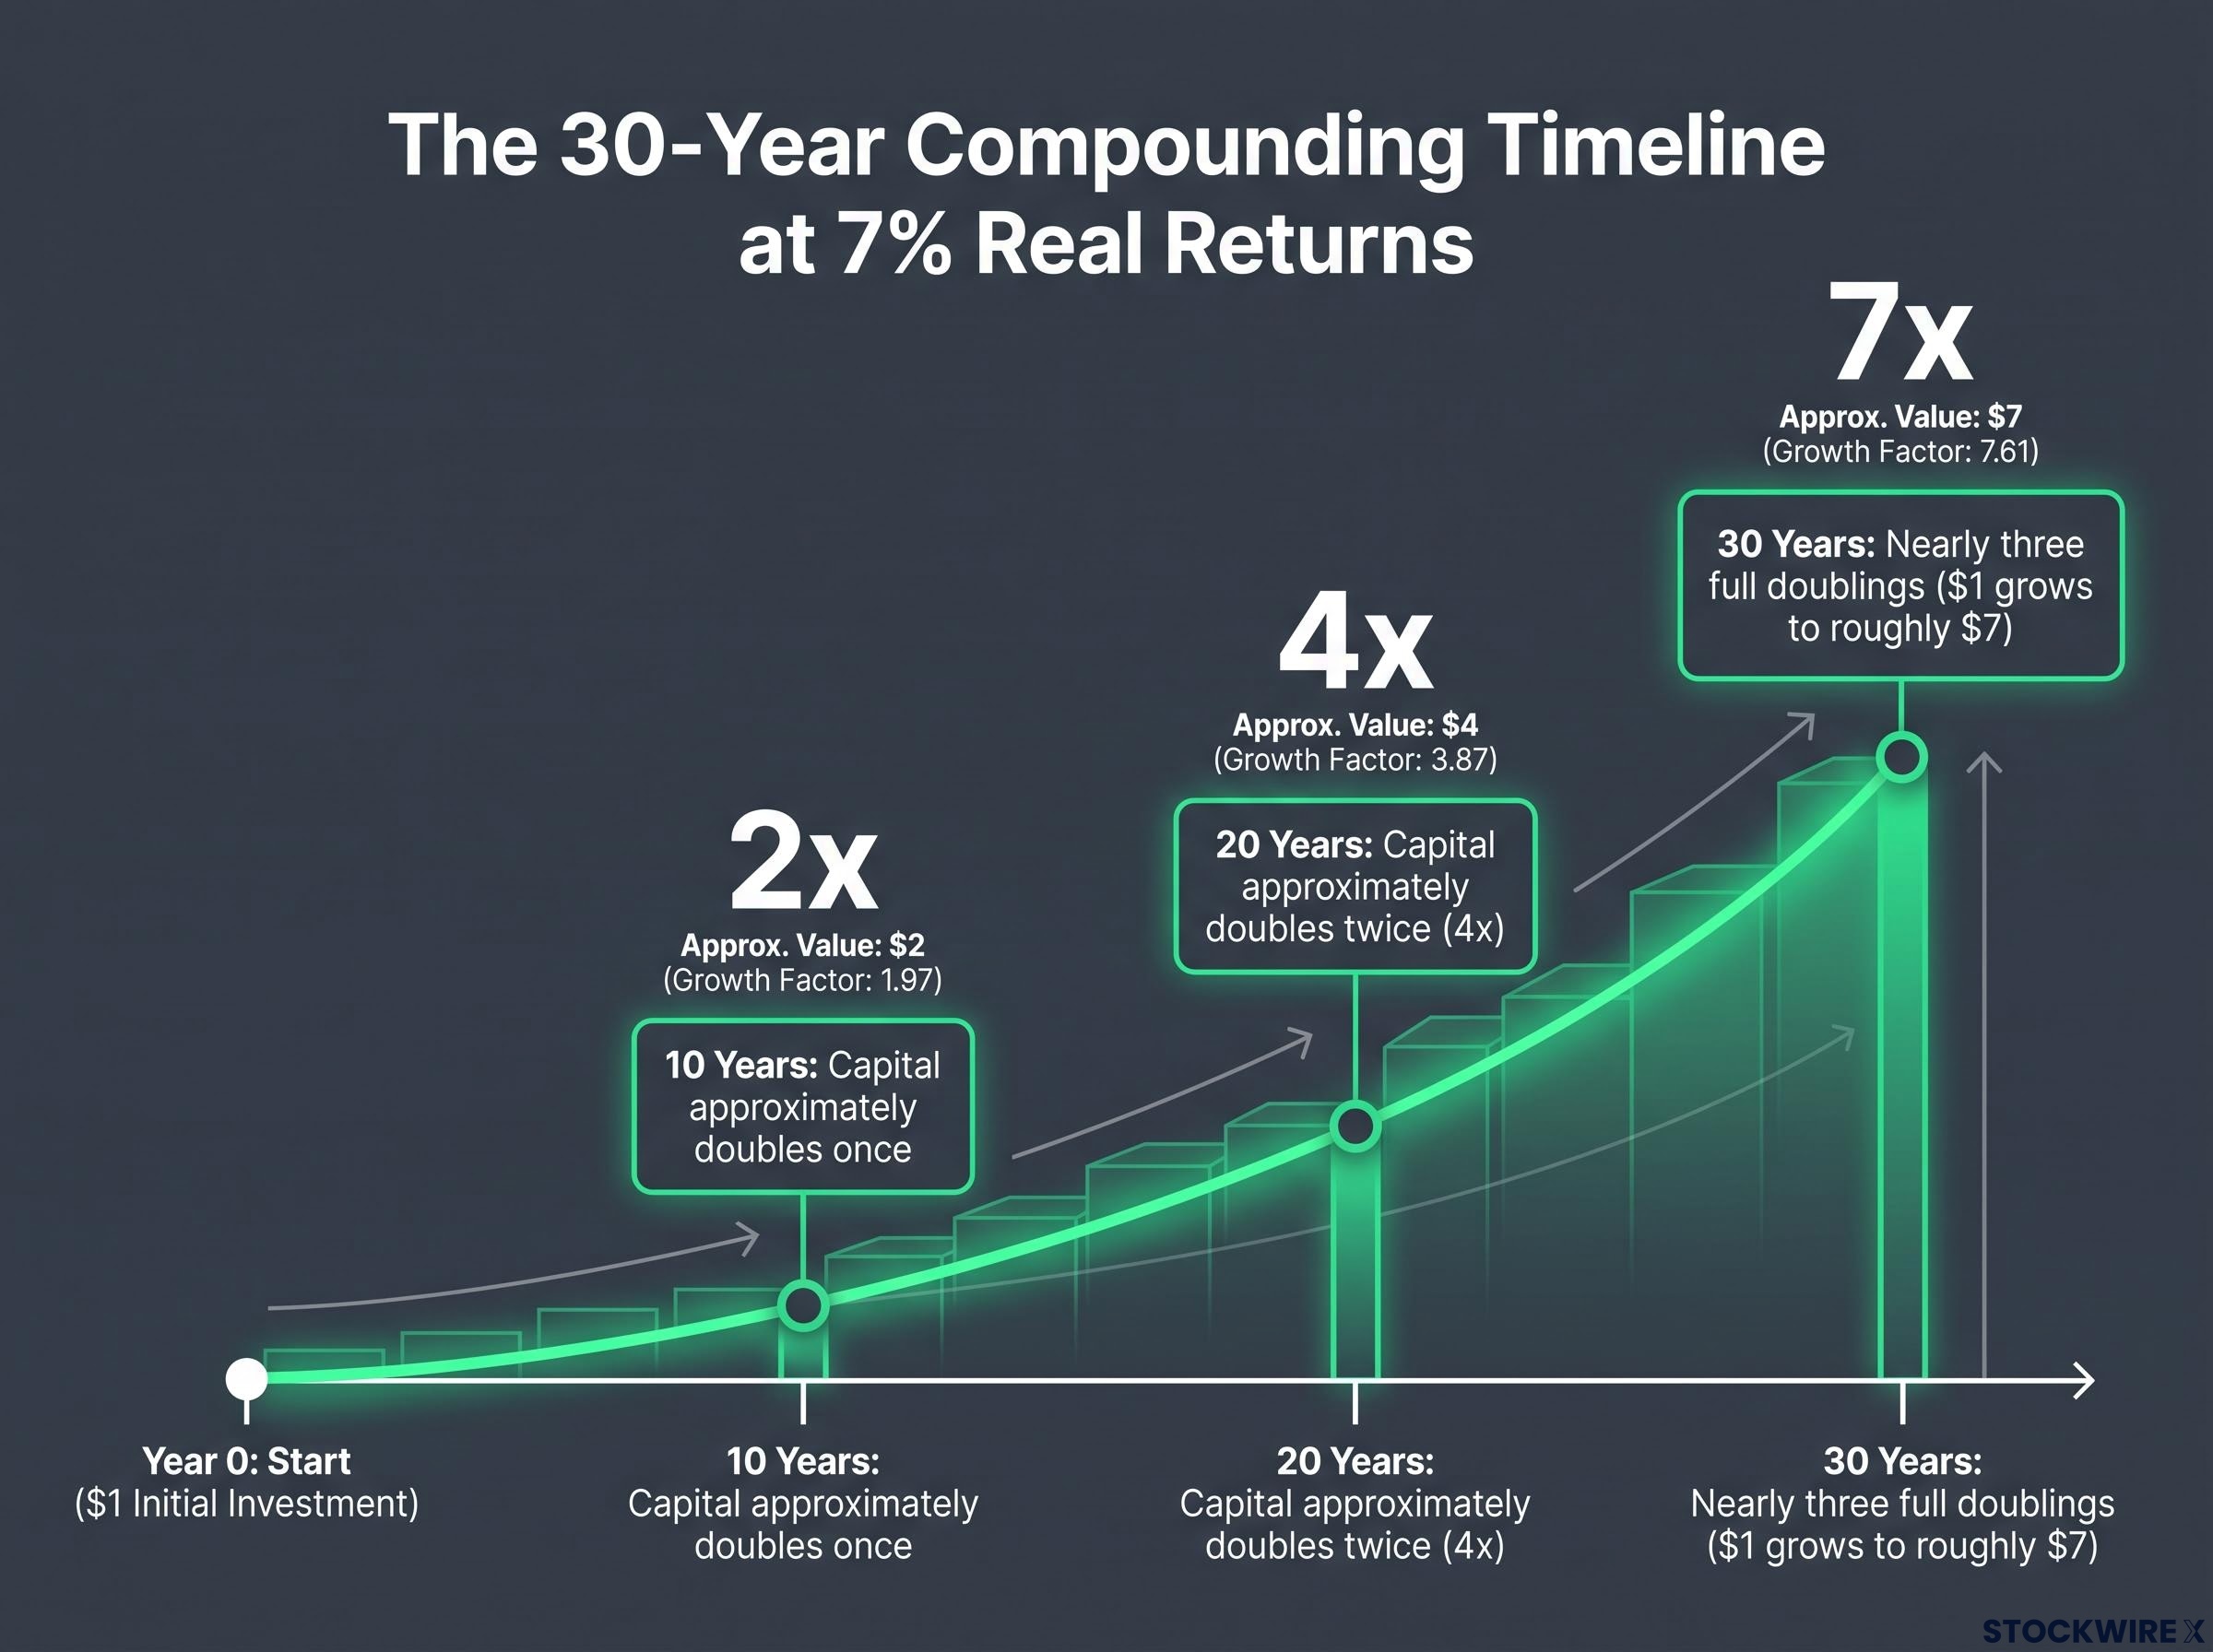
Held across a 30-year horizon at 7% real returns, each pound of capital grows to approximately $7 in purchasing power. The SCF data’s pattern of equity dominance in upper-wealth portfolios reflects this outcome: not from picking winners or timing markets, but from allowing compounding to run its full course through repeated doublings.
The variable most within your control is not the return rate. It is your time horizon. The decision to hold equities for 30 years rather than 20 has a larger effect than many investment decisions that feel more consequential. And for typical households, the SCF shows that tax-deferred retirement accounts are often the primary vehicle through which equities and mutual funds are held.
Past performance does not guarantee future results. Financial projections are subject to market conditions and various risk factors.
The tax-advantaged account layer that gives wealthy investors a structural edge
Tax-advantaged accounts are commonly framed as retirement savings vehicles. That description misses the more fundamental point. A 401(k), IRA, or HSA delivers a quantifiable return advantage purely through its tax treatment, an advantage that operates entirely independently of whatever investments sit inside it.
The mechanism is tax drag. In a taxable account, the annual levy on dividends and internal fund activity erodes returns year by year. That reduction amounts to roughly 0.5% per year. Over a short period, half a percentage point feels negligible.
Over a long period, it is not.
Applying a 0.5% annual tax drag to a $35,000 investment over 30 years leaves approximately $78,000 less in ending value compared to the same investments held inside a tax-sheltered account. The account structure itself is a return driver, meaning where you hold an investment matters independently of what investment you hold.
The three main account types each deliver the tax advantage differently:
- 401(k) / Traditional IRA: Pre-tax contributions reduce your current taxable income; gains grow tax-deferred; withdrawals are taxed as ordinary income in retirement
- Roth IRA: After-tax contributions; gains grow tax-free; qualified withdrawals are tax-free
- HSA (Health Savings Account): Pre-tax contributions, tax-free growth, and tax-free withdrawals for qualifying medical expenses, a triple tax benefit that makes it structurally superior to standard retirement accounts for eligible individuals
Wealthy investors characteristically prioritise these accounts ahead of all other capital deployment, funding them to their annual limits before directing money elsewhere. For typical households, tax-deferred retirement accounts are often the main vehicle through which they hold equities or mutual funds. For wealthier households, retirement accounts are part of a broader suite of financial assets, but they still offer structurally higher after-tax returns than identical investments in taxable accounts.
Building a tax-efficient portfolio goes beyond selecting the right account type: asset location decisions, the specific choice of which securities sit in taxable versus tax-sheltered accounts, can represent tens of thousands of dollars in compounding advantage over a 30-year horizon, independent of any investment selection decision.
This article is for informational purposes only and should not be considered financial advice. Investors should conduct their own research and consult with financial professionals before making investment decisions.
Business equity and investment real estate as the upper-wealth compounding amplifiers
Business equity and investment real estate are the two asset classes that dominate at the very top of the wealth distribution. Understanding why requires looking at the mechanism, not just the allocation data.
Business ownership generates claims on future earnings streams rather than simply wage income. A successful business can accumulate equity value far beyond what any single year’s salary could represent, because the owner captures the returns that flow through the enterprise rather than contributing labour to someone else’s. The top 1% of households hold over half of all non-corporate business assets in the economy, according to SCF-based research.
Business ownership can take several forms:
- Founding a new venture
- Acquiring an existing operation
- Holding meaningful equity in an employer through compensation arrangements
The important caveat is that most small businesses do not produce substantial wealth for their owners. The concentration visible at the top of the SCF distribution reflects a subset of favourable outcomes rather than a representative result, and building or buying a business requires sustained active involvement alongside genuine financial risk.
Why leverage in real estate works differently from leverage in other markets
Investment real estate introduces a distinct compounding mechanism: leverage.
With a $50,000 deposit on a $250,000 property, you gain exposure to an asset worth five times your initial outlay. At 3% annual appreciation on the full property value, your returns are calculated on $250,000, not on the $50,000 you put in. That is the leverage multiplier.
Any realistic assessment of this scenario must account for the costs it omits: mortgage interest accumulating over decades, maintenance expenditure, periods of vacancy, property taxes, and insurance, all of which can substantially reduce actual net returns. Leverage scales outcomes in both directions with equal force, and real-world results depend heavily on purchase timing and location.
What makes real estate leverage different from margin in securities markets is duration and structure. Residential and commercial real estate debt is typically long-duration, fixed-rate financing. Tenants service part of the debt through rental income, reducing the effective cost of carrying the leveraged position. That combination creates a structurally different risk profile from short-term margin borrowing.
These statements are speculative and subject to change based on market developments and company performance.
What the compounding gap means for households still holding mostly cash and housing
The SCF documents two distinct portfolio archetypes. Lower-and-middle-wealth households hold portfolios dominated by housing, vehicles, and cash. Upper-wealth households hold portfolios dominated by business equity, financial market assets, and investment real estate.
The K-shaped consumer economy visible in 2026 aggregate data mirrors the structural split the SCF documents at the household level: top earners holding productive assets and building net worth, while lower and middle-income households absorb rising credit card balances and depleting savings that erode the purchasing power the current article’s compounding analysis assumes can be deployed.
The Federal Reserve’s own characterisation of the average household portfolio is revealing:
The average household portfolio is “fairly simple and safe,” consisting mainly of a checking account, savings account, and tax-deferred retirement account. That framing, from Federal Reserve analysis, undercuts the common assumption that investing requires complexity. Most households already hold the building blocks. The gap is in the proportions.
Research suggests that financial assets have risen from approximately 30% to nearly 40% of household assets in aggregate over recent decades, though this figure has not been independently confirmed from SCF data directly. What the SCF does confirm is that the wealth divergence documented over time is driven less by access to secret strategies and more by who systematically allocates into productive assets and holds them through volatility.
The reallocation path that the data supports moves through a clear sequence of steps:
- Maximise tax-advantaged accounts (401(k), IRA, HSA), locking in the structural return benefit before committing capital anywhere else
- Build broad market equity exposure through diversified index funds, allowing the compounding mechanics the historical record documents to operate over time
- Add business equity and investment real estate once your capital base and knowledge allow, with a clear-eyed understanding of the active commitment and risk each asset class demands
That progression tells you that moving from a cash-and-housing portfolio toward a compounding portfolio is not a single decision. It is a sequence with a documented starting point, and the SCF data identifies tax-advantaged equity exposure as the accessible first step.
The allocation shift is the strategy, not the instruments
The SCF data does not reveal a secret instrument class used by the wealthy. It reveals a consistent pattern: capital allocated toward ownership stakes in productive enterprises rather than stored in non-compounding accounts. The shift is categorical, not exotic.
What the data cannot tell you is causation. The SCF captures portfolio snapshots, not investment decisions. Correlation between wealth and asset allocation does not resolve whether the allocation caused the wealth or the wealth enabled the allocation. Both directions are likely operating simultaneously.
The relevant question for your own portfolio is structural, not product-specific. It is not which fund to buy or which property to target. It is whether your overall portfolio is oriented toward compounding assets or storage assets, and whether the proportion is shifting in the direction the data says matters over time.
—