
Most developing traders treat their position size as a light switch: on or off, in or out. That single habit accounts for more blown accounts than any bad entry call ever will.
The 8 and 21-day moving average envelope, paired with a disciplined trim-and-trail approach to managing your position, gives you a rules-based framework that strips the gut-feel decisions out of trading. Those are exactly the decisions that quietly erode consistency over time.
Scott Redler, Chief Strategic Officer at T3 Trading Group, has built his professional methodology around this pairing. The logic behind it is grounded in market psychology rather than pattern-matching superstition.
This guide walks the framework from first principles to real-trade application. You will see what the indicators actually measure, how position sizing works in practice, where the system breaks down, and what Tesla and Micron look like when the rules are applied correctly. By the time you finish, you will have a concrete framework to hold your own trades up against, not just a description of how someone else trades.
Why the 8 and 21-day moving averages work as a decision framework
A moving average is not a crystal ball, and treating it like one is the fastest way to lose money with it. What makes the tool useful is that it plots the average price of a stock over a set number of days, which is really a snapshot of where the crowd has agreed value sits.
That is the point most traders miss. Moving averages are effective because they reflect aggregate market psychology, not because they predict the next tick with any precision.
The 8 and 21-day pair splits that psychology into two speeds. Together they act as an early-warning tripwire that trips long before institutional reference points like the 200-day moving average are ever in play.
The 8/21 pair operates at a much faster timescale than the more widely cited moving average crossovers like the golden cross and death cross, which use 50 and 200-day averages and arrive so late that a significant portion of the trend move has already occurred before the signal fires.
- The 8-day moving average tracks very short-term momentum. It tells you what the fastest-moving participants are doing right now.
- The 21-day moving average represents the broader short-term trend. It smooths out the noise and shows you the direction the crowd is leaning over several weeks.
Here is the practical payoff for you. Redler’s framework treats the market as favourable for holding risk positions when the major indices trade above both the 8 and 21-day moving averages, and a break below the 8-day is the first signal that conditions are shifting and your position deserves trimming.
That means you are never left staring at a chart asking “is this a good market to be long?” without a concrete, chart-based answer. The 8/21 pair hands you a defined regime signal you can read in seconds.
For a foundational grounding in how these indicators are constructed, John Murphy’s technical analysis textbook published through the New York Institute of Finance remains a standard reference, and it is the material many professionals cut their teeth on.
What envelope bands add to the picture
Envelope bands are plotted a fixed percentage above and below the moving averages, creating an upper and lower boundary around the price.
The logic behind them is mean reversion, which simply means price tends to snap back toward its average after stretching too far from it. When overzealous buyers push price up to the upper band, or panicked sellers slam it down to the lower band, those extremes rarely hold.
Price usually stabilises back toward the moving average cluster. That behaviour makes the bands useful for spotting entry zones on pullbacks, not just exit signals. A pullback into the lower band while the broader 8/21 structure stays intact is often a higher-probability place to buy than chasing a stock at its extreme.
When big ASX news breaks, our subscribers know first
How tiered position sizing and trim-and-trail actually work
The all-or-nothing trade is where most developing traders go wrong. Either they bag-hold a full position through a reversal, or they panic and dump everything at the first wobble, missing the bulk of a move.
Tiered entry and exit around key chart levels is what separates the professionals from that pattern. Instead of one big decision, you make a series of smaller ones, scaling in and out as price confirms or rejects your thesis.
The engine of this approach is the “trim and trail” method, and it works in three steps:
- Trim at your target. When price hits a pre-defined profit target, reduce your position size to lock in partial gains. You are taking real money off the table, not hoping.
- Trail your stop on the runner. Keep a smaller portion of the position, the “runner,” in case the move keeps going, and move your stop up behind it to protect what you have earned.
- Exit the runner on invalidation. If the original reason you took the trade stops being true, you exit the rest entirely and stand aside. You do not average down, and you do not re-enter on hope. You wait for a new, valid setup.
For you, that discipline means you will never again hold a full position through a reversal because you forgot to decide what winning was supposed to look like.
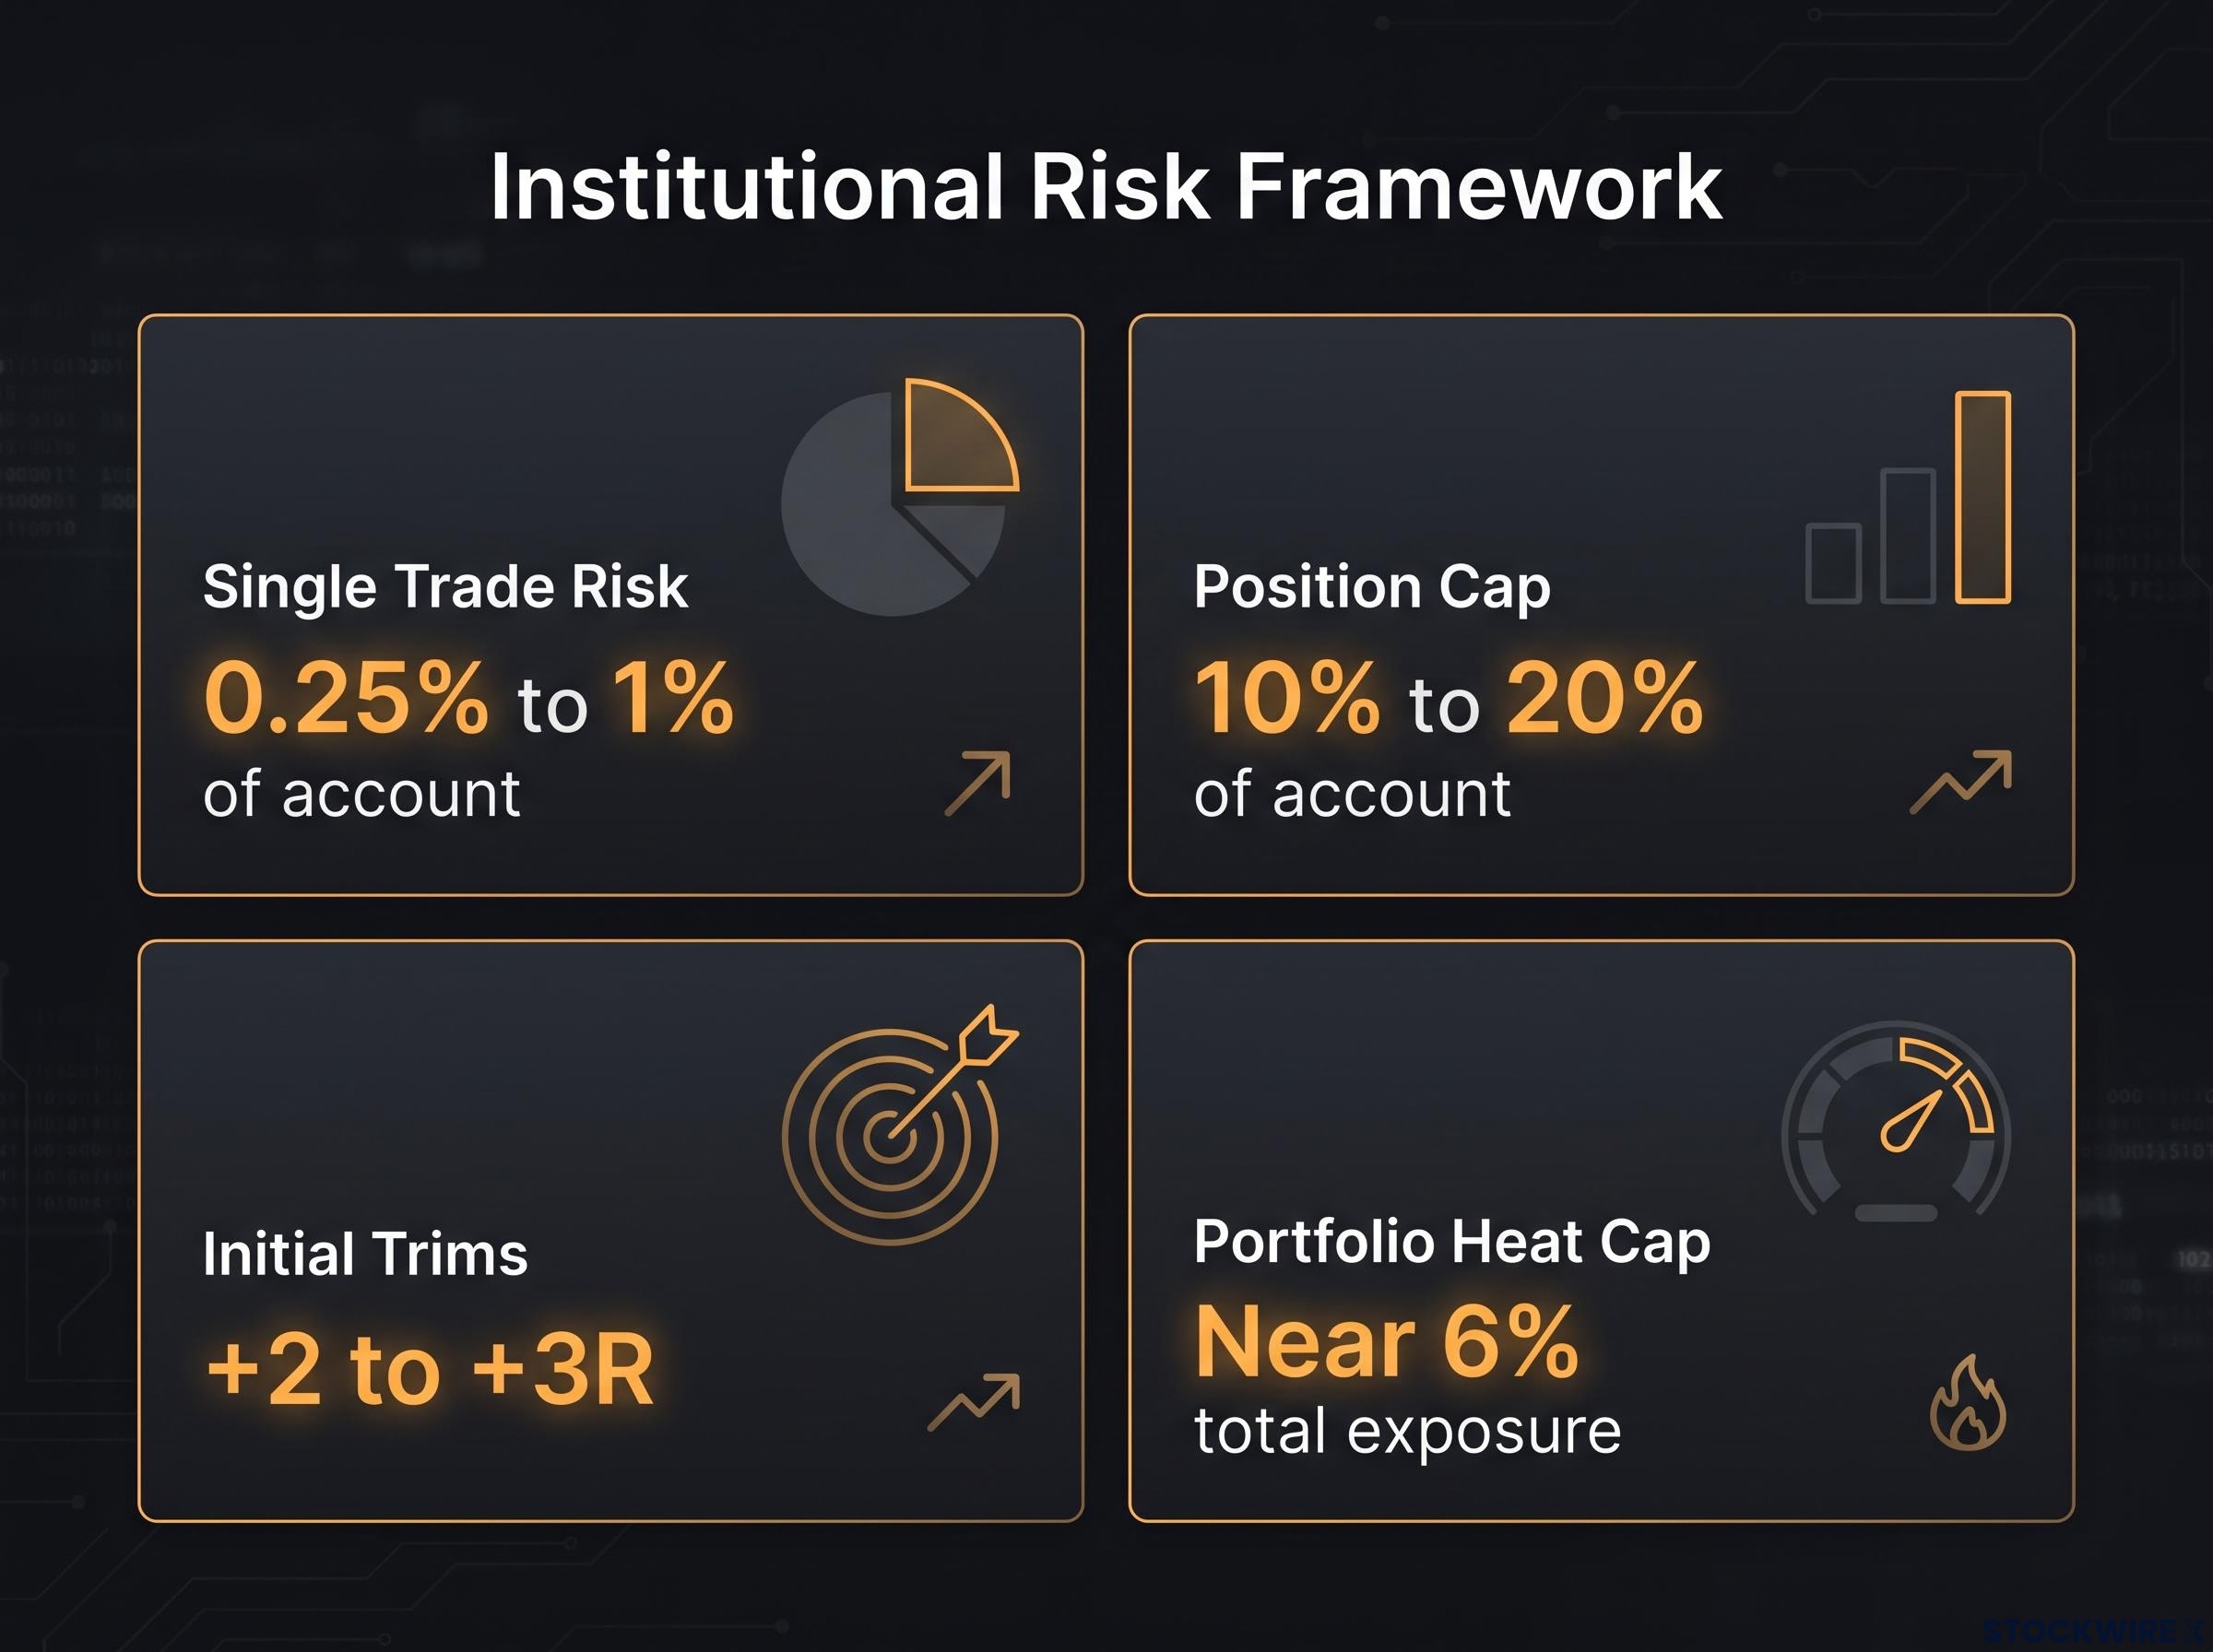
The sizing itself sits inside a broader risk structure. While the exact parameters vary by trader, common institutional risk frameworks are worth knowing as general industry reference points rather than confirmed Redler-specific rules: limiting risk to roughly 0.25% to 1% of the account per trade, capping any single position at 10% to 20% of the account, and taking initial trims around +2 to +3R (that is, two to three times the amount you risked).
Sitting above all of that is the portfolio heat cap, an absolute limit on total risk exposure across every open position at once, commonly cited near 6%. It exists to stop several losing trades from compounding into an account-ending drawdown.
Here is how a single trade might move through the system.
| Stage | Action | Position Size | Rationale |
|---|---|---|---|
| Entry | Buy at defined level | 100% | Setup confirmed above the 8/21 cluster |
| First trim | Sell a portion at first target | Reduced to around 66% | Lock in partial profit at the first risk multiple |
| Second trim | Sell another portion at second target | Reduced to around 33% | Bank more gains, keep a runner |
| Runner stop | Trail stop, exit on invalidation | 0% | Break below the 8-day invalidates the thesis |
Tiered sizing is not the timid option for cautious traders. It is how professionals stay in the game long enough to compound, because small managed losses are survivable and full-position reversals often are not.
Dollar-risk position sizing applies the same mechanical logic on the short side: once a stop is placed on the chart, the share count follows from the formula rather than from confidence level, which removes the single most common source of discretionary error in sizing decisions.
This maps directly onto how Redler manages regime. When indices sit above the 8/21 cluster he runs a “Portfolio Approach,” holding multiple longs. When the market breaks below it he switches to a “Tactical Approach,” taking profits, cutting weaker names, and deploying hedges.
The 8/21 framework in practice: Tesla and Micron as case studies
Rules on a page are one thing. Watching them make decisions on a live chart is where the framework earns its keep. Two names show both sides of the coin: Tesla when the trend holds, and Micron when it breaks.
Before working through the numbers, one caveat. Both stocks were extremely volatile during this period, and price data conflicts across providers depending on the exact date and platform. The figures below come from the original source levels, and the point is the decision logic, not the precision of any single price.
Tesla: using catalysts and chart levels together
Tesla (TSLA) illustrates how a chart level and a catalyst work together to define a trade plan. The original source identified a pivot high near $368, with the 200-day moving average serving as the upside reference for adding shares.
The catalyst was the highly anticipated Robotaxi, or Cybercab, unveiling, discussed around the 3 September 2026 timeframe. On that day the stock traded in a range of roughly $365.82 to $384.04, which gives you a sense of the volatility surrounding the event.
Here is the sequence that matters. The moving average structure told you whether it was a favourable environment to be long before the catalyst was ever a factor.
- Entry reference: pivot high near $368
- Add level: shares added toward the 200-day moving average as the upside target
- Regime check: long bias valid only while price held above the 8 and 21-day cluster
- Catalyst: the Robotaxi/Cybercab event framing the timing
The catalyst did not create the trade. The chart structure did. The event simply told you when the move might accelerate.
Micron: what invalidation looks like in real time
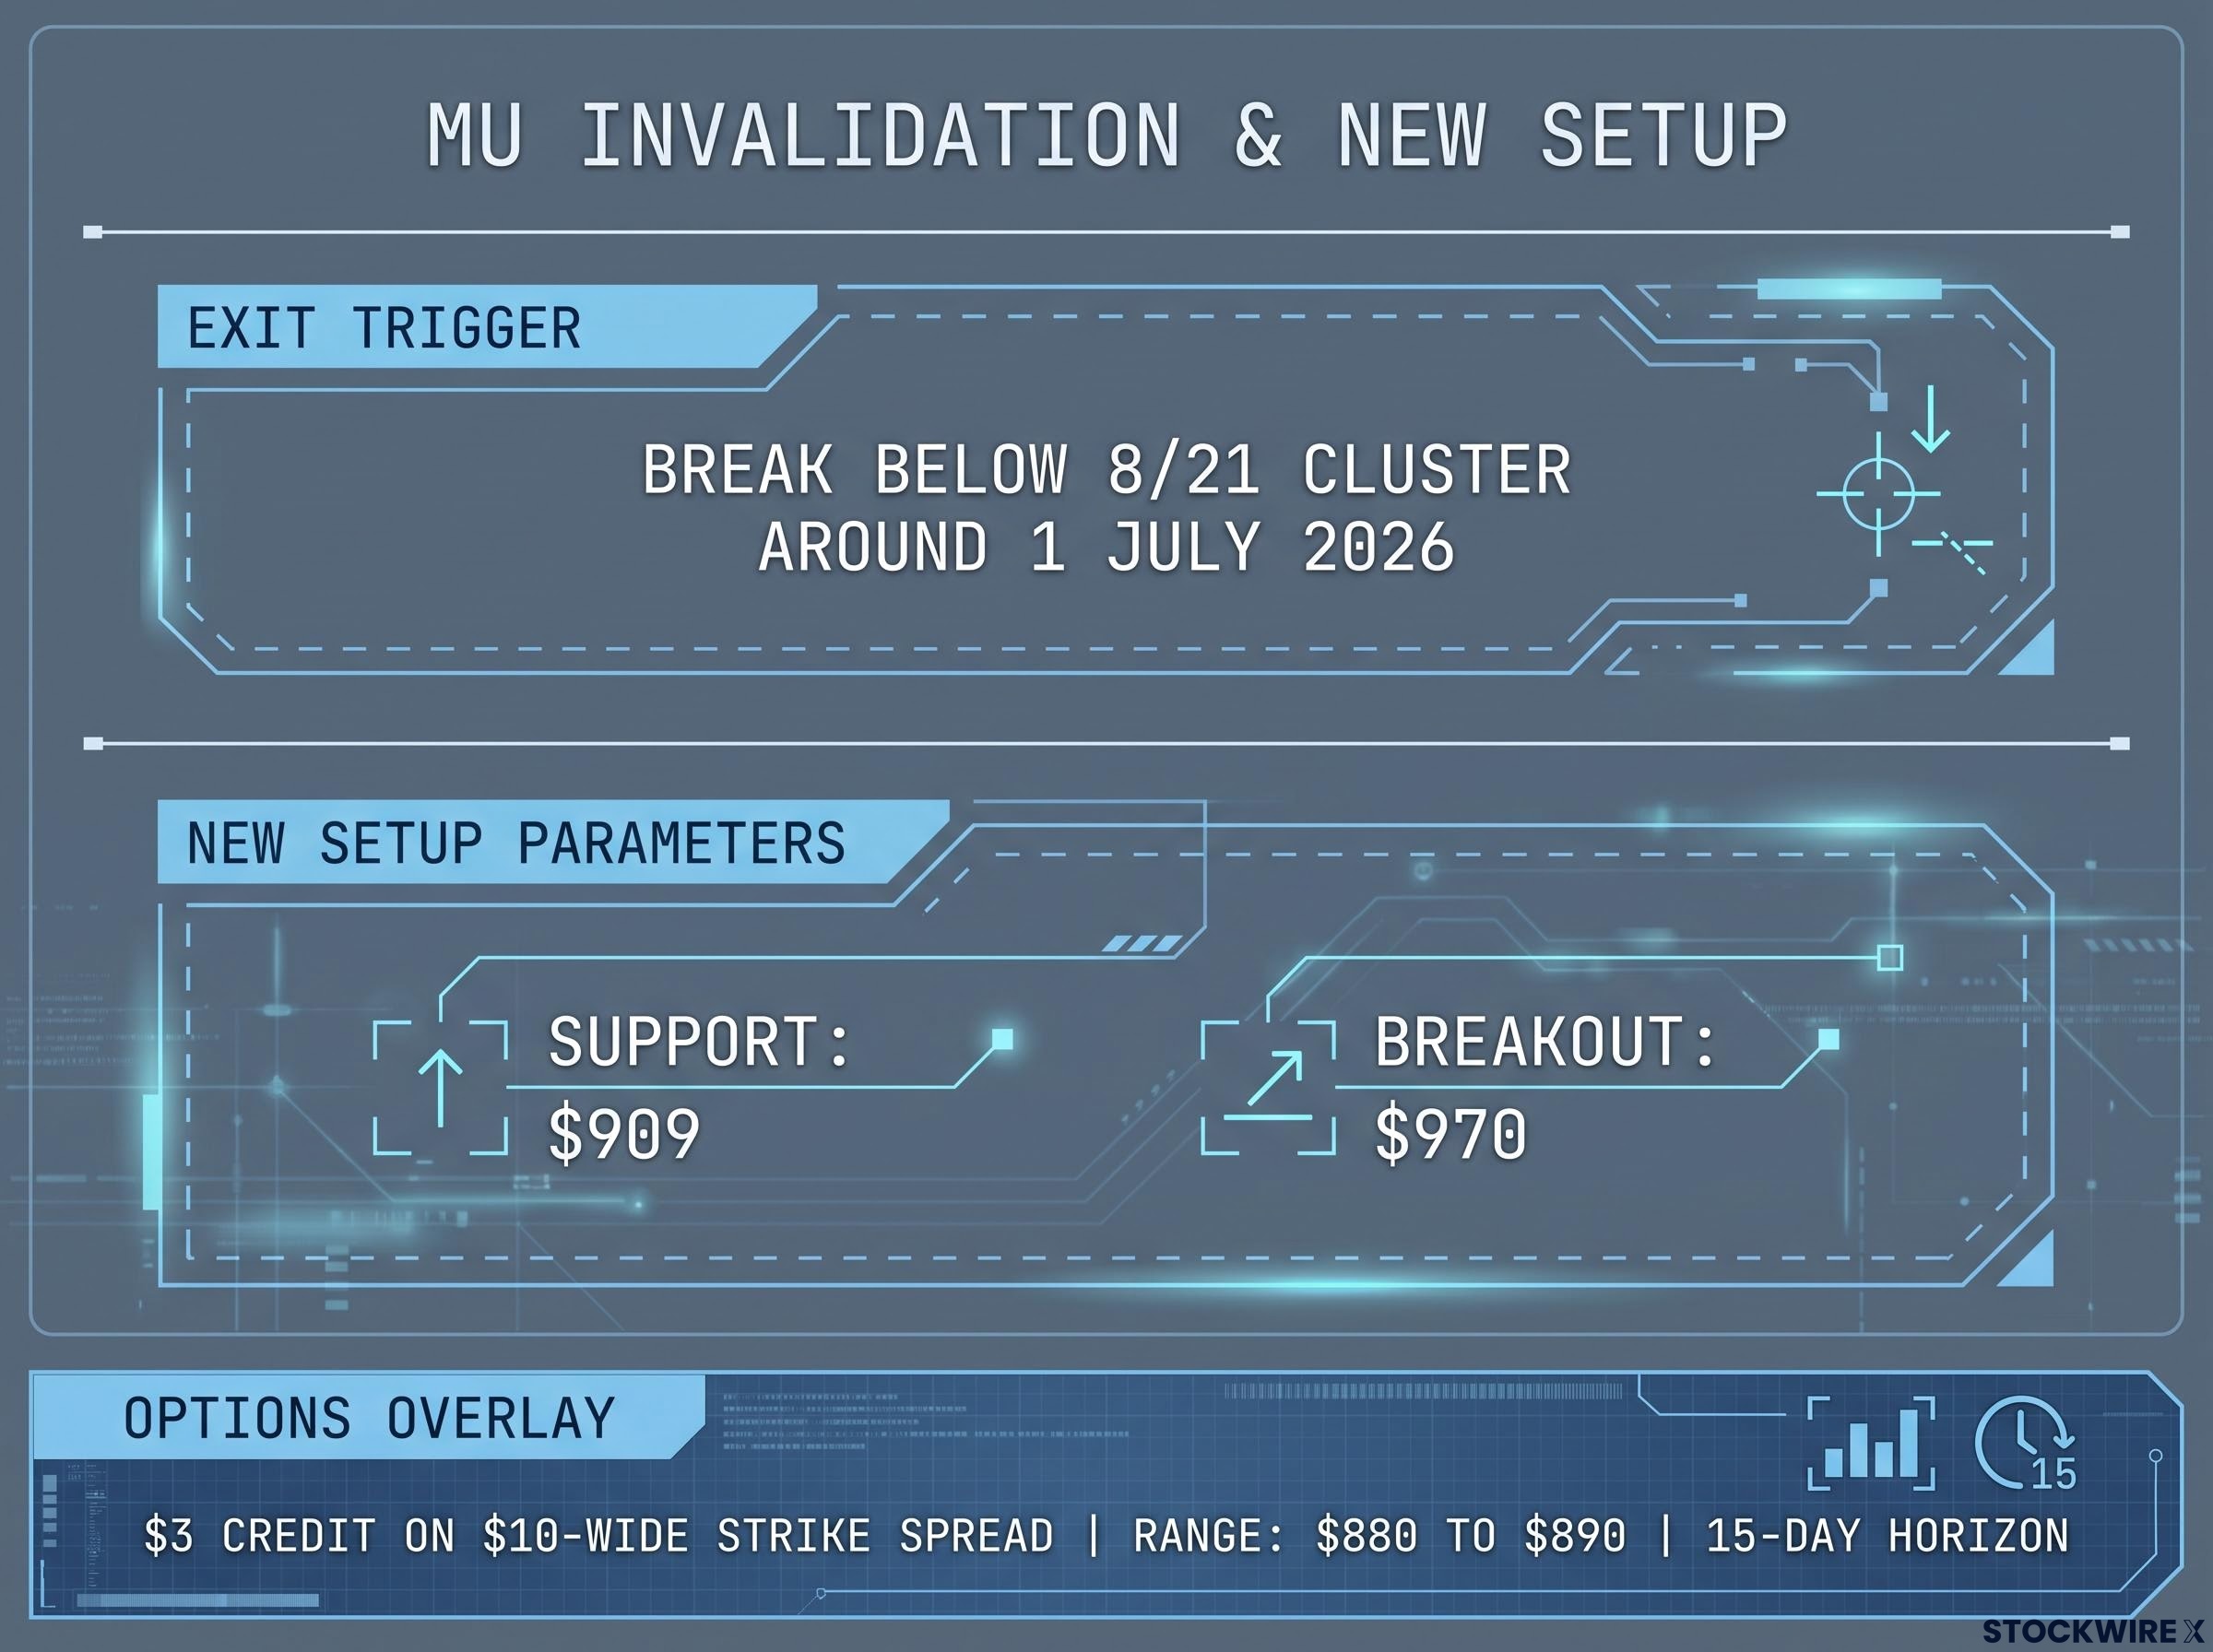
Micron Technology (MU) shows the other outcome: a trend that breaks and forces you out. MU held a strong uptrend through the second quarter until approximately 1 July 2026, when it broke below its 8 and 21-day moving averages.
Under the framework’s rules, that break was the exit signal. No debate, no averaging down. You stand aside and wait for the next valid setup to form.
A new setup did emerge, with defined parameters: $909 as a lower boundary and $970 as a potential breakout trigger. That is the discipline in action, the previous thesis dead, a fresh one built only when price gave a reason.
- Exit trigger: break below the 8/21 cluster around 1 July 2026
- New setup support: $909
- Breakout trigger: $970
- Correlated leveraged ETF trade: stop near $27.80, target zone near $31.60
MU also shows how you can express a view with defined risk using options rather than raw shares.
Defined-risk options overlay on MU Collecting a $3 credit on a $10-wide strike spread near the $880 to $890 expected move range, structured over an approximately 15-day horizon. Your maximum loss is capped by the width of the spread minus the credit, so the downside is known before the trade is placed.
What both examples show you is that the framework produces the same logic regardless of the stock. Define your levels before the trade, respond to what price actually does at those levels, and take the emotion out by having already decided what invalidation looks like.
When this framework fails, and how to know which market you are in
No system works in every condition, and this one has a clear weakness. In choppy, range-bound markets, the 8/21 framework will hurt you if you apply it blindly.
The problem is whipsaws: false signals where price crosses the moving averages repeatedly without ever committing to a sustained trend. Each cross triggers a trade, each trade takes a small loss, and those small losses compound into a real hole.
This is regime mismatch, and it is the core failure mode. Momentum-based trend tools produce their worst results when applied to sideways price action, because there is no trend for them to catch.
The numbers behind this are sobering. Quantitative research on short-term moving average crossovers points to high failure rates in non-trending conditions, though these are general findings rather than results verified for this specific 8/21 configuration.
The whipsaw problem in numbers Research on short-term moving average crossovers indicates false-signal rates frequently falling between 57% and 76% in non-trending markets. In a choppy environment, the majority of your signals can be noise.
So how do you know which market you are in? The professional answer is a regime filter, a second tool that confirms the trend is real before you trust the 8/21.
| Characteristic | Trending market | Range-bound market |
|---|---|---|
| ADX reading | Above 20, momentum present | Below 20, momentum weak |
| Price vs moving averages | Holds above or below the cluster | Crosses back and forth repeatedly |
| 8/21 framework reliability | Higher, signals tend to follow through | Lower, signals whipsaw |
| Recommended action | Apply the framework fully | Reduce activity, wait for clarity |
The Average Directional Index (ADX) measures how strong a trend is, and a reading above 20 suggests a trending environment. The Choppiness Index does the reverse, with readings below 50 suggesting directional movement rather than a sideways grind. Either one helps you confirm the framework is operating where it has an edge.
Stacking technical indicators from independent analytical families — trend, volume, momentum, and price structure — raises the estimated probability of a trade moving in the anticipated direction, which is the quantitative case for using the ADX regime filter alongside the 8/21 pair rather than relying on one signal alone.
Understanding this changes how you read a losing streak. If you are getting whipsawed repeatedly, the question is not whether the framework is broken. It is whether you are running a trend-following system in a market that simply is not trending.
Context matters here too. The historical average intra-year drawdown in the S&P 500 sits near 14%, and the roughly 18.9% to 19% tariff-related drawdown in April 2025 sat near the upper end of that normal range. Even sound frameworks face brutal periods, which is exactly why Redler’s own rule holds: never short a stock showing momentum above its 8 and 21-day moving averages. Directional context governs every decision.
Building rules-based habits before layering in discretion
There is a myth that skilled traders trade on feel. The reality is the opposite. The most experienced practitioners did not skip the rules-based stage. They mastered it first, and only then earned the right to bend it.
For a developing trader, a rules-based framework is not a cage. It is the thing that lowers your emotional burden, because your entries, stops, and profit targets are specified before you are in the trade and feeling the pressure. It limits overtrading, and it makes honest backtesting and journaling possible.
Discretionary trading has genuine strengths, and it is fair to name them. Discretion lets you adapt to evolving macroeconomic contexts, things like earnings events, index rebalancing periods, and rate-driven algorithmic selling that pure price action cannot anticipate.
But discretion carries behavioural risks that compound catastrophically before you have the emotional control to manage them.
- Rules-based: stops and targets are set in advance; discretion cannot override them mid-trade
- Discretionary: flexible to news and macro shifts, but tempts you to move stops away from structure
- Rules-based: makes journaling and backtesting meaningful because the process is repeatable
- Discretionary: invites failing to take partial profits and adding to losing positions on hope
The 8/21 and trim-and-trail system is the rules-based operating system that professionals like Redler run underneath everything else. Discretionary refinement gets layered on top only once core execution is consistent.
How to start applying the framework to your own trades
You can act on this today. Open a chart and do three concrete things.
- Plot the levels. Add the 8 and 21-day moving averages to every name on your current watchlist so you can see the regime at a glance.
- Define invalidation before you enter. For any new position, write down exactly what price action would prove you wrong, usually a clean break below the 8-day, before you click buy.
- Set your trim target upfront. Decide the risk multiple at which you will take your first partial profit, and commit to it before the trade is live.
Traders who skip this stage and jump straight to discretionary decisions tend to mistake confidence for competence. The market charges a measurable tuition for that error, and this framework is the curriculum that spares you the most expensive lessons.
What consistent application of this system actually produces over time
Pull the pieces together and the framework is a complete operating system. The 8/21 envelope defines your regime and your entry zones, tiered sizing manages the risk on each trade, trim-and-trail captures gains without demanding a perfect exit, and regime awareness tells you when to stop trading and wait.
None of that is built to win any single trade. It is built to keep you in the business long enough for the wins to compound.
Trading expectancy — calculated as win rate multiplied by average win size minus loss rate multiplied by average loss size — is what the trim-and-trail structure is implicitly optimising: partial profit locks reduce average loss size while the runner preserves the right tail of the win distribution, keeping the formula positive across a full sample of trades.
The core principle The goal is netting money consistently to sustain a trading career, not maximising any single trade.
That distinction is where the value actually sits for you. The framework pays off not in one great call but in the cumulative effect of never letting one losing position define your month, and never missing a sustained move because you bailed too early with no runner left to ride.
The honest professional standard makes room for pain. Even experienced traders using sound frameworks face severe drawdowns, with the roughly 19% S&P 500 decline in April 2025 a concrete example against a historical intra-year average near 14%. Redler’s segmentation of a Portfolio Approach in strong regimes and a Tactical Approach when the market breaks down is how that awareness becomes day-to-day practice.
The traders who last are rarely the sharpest analysts. They are the ones who built a system they could execute the same way hundreds of times, recognised when it was out of its environment, and kept position sizing disciplined enough that the losing stretches never ended their careers.
This article is for informational purposes only and should not be considered financial advice. Investors should conduct their own research and consult with financial professionals before making investment decisions. Past performance does not guarantee future results, and the risk parameters and case study figures referenced here reflect specific sources and market conditions that are subject to change.