Why a Rising AUD Is Quietly Eroding Your International ETF Returns
12 hrs ago

Warren Buffett once described his ideal investment as a castle surrounded by a wide moat, a fortress so well protected that no competitor could storm its walls. The image is deceptively simple. Behind it sits one of the most powerful filters available to long-term investors: the ability to distinguish between a business that is profitable today and one that can defend its profitability for a decade or more. In an environment where companies can appear and disappear within a single market cycle, the question of which businesses carry structural protection from competition has never been more pressing. Australian retail investors increasingly encounter moat language in fund documentation, broker research, and financial media, yet the framework for applying the concept independently often remains unclear. By the end of this piece, the reader will be able to identify the five sources of a structural competitive advantage, apply a practical checklist to any company under evaluation, and understand why a moat’s trajectory matters as much as its classification.
The moat metaphor traces back to Buffett’s shareholder letters and public commentary across several decades. It was never presented as academic theory. It was a practical heuristic: a way for an investor to ask the single most important question about any business generating above-average returns. That question is straightforward. If this company is earning more than its competitors, what stops those competitors from copying the formula and eroding those returns over time?
Buffett framed every business as a castle. The moat is what protects the castle from competitive attack. The drawbridge is management’s role in maintaining and widening that protection over time.
The logic is intuitive, which is partly why it has endured. A wide moat means competitors face high barriers. A narrow moat means some protection exists, but it could be breached. No moat means the business is exposed.
Morningstar formalised this intuition into a structured analytical framework, assigning companies one of three ratings: wide, narrow, or none. That formalisation gave the concept broader analytical utility beyond any single investor’s judgment, turning a metaphor into a repeatable evaluation process. The result is a framework that works as well for a retail investor reviewing an annual report as it does for a portfolio manager screening hundreds of companies.
Morningstar’s economic moat ratings assign each company one of three tiers, wide, narrow, or none, based on a structured assessment of the five moat sources, giving the framework a repeatable, consistent basis that extends well beyond any single analyst’s subjective judgment.
Morningstar’s framework identifies five distinct mechanisms that create a durable competitive advantage. Each operates differently, and recognising which source applies to a given business is what turns moat analysis from a vague endorsement into a specific, testable claim.
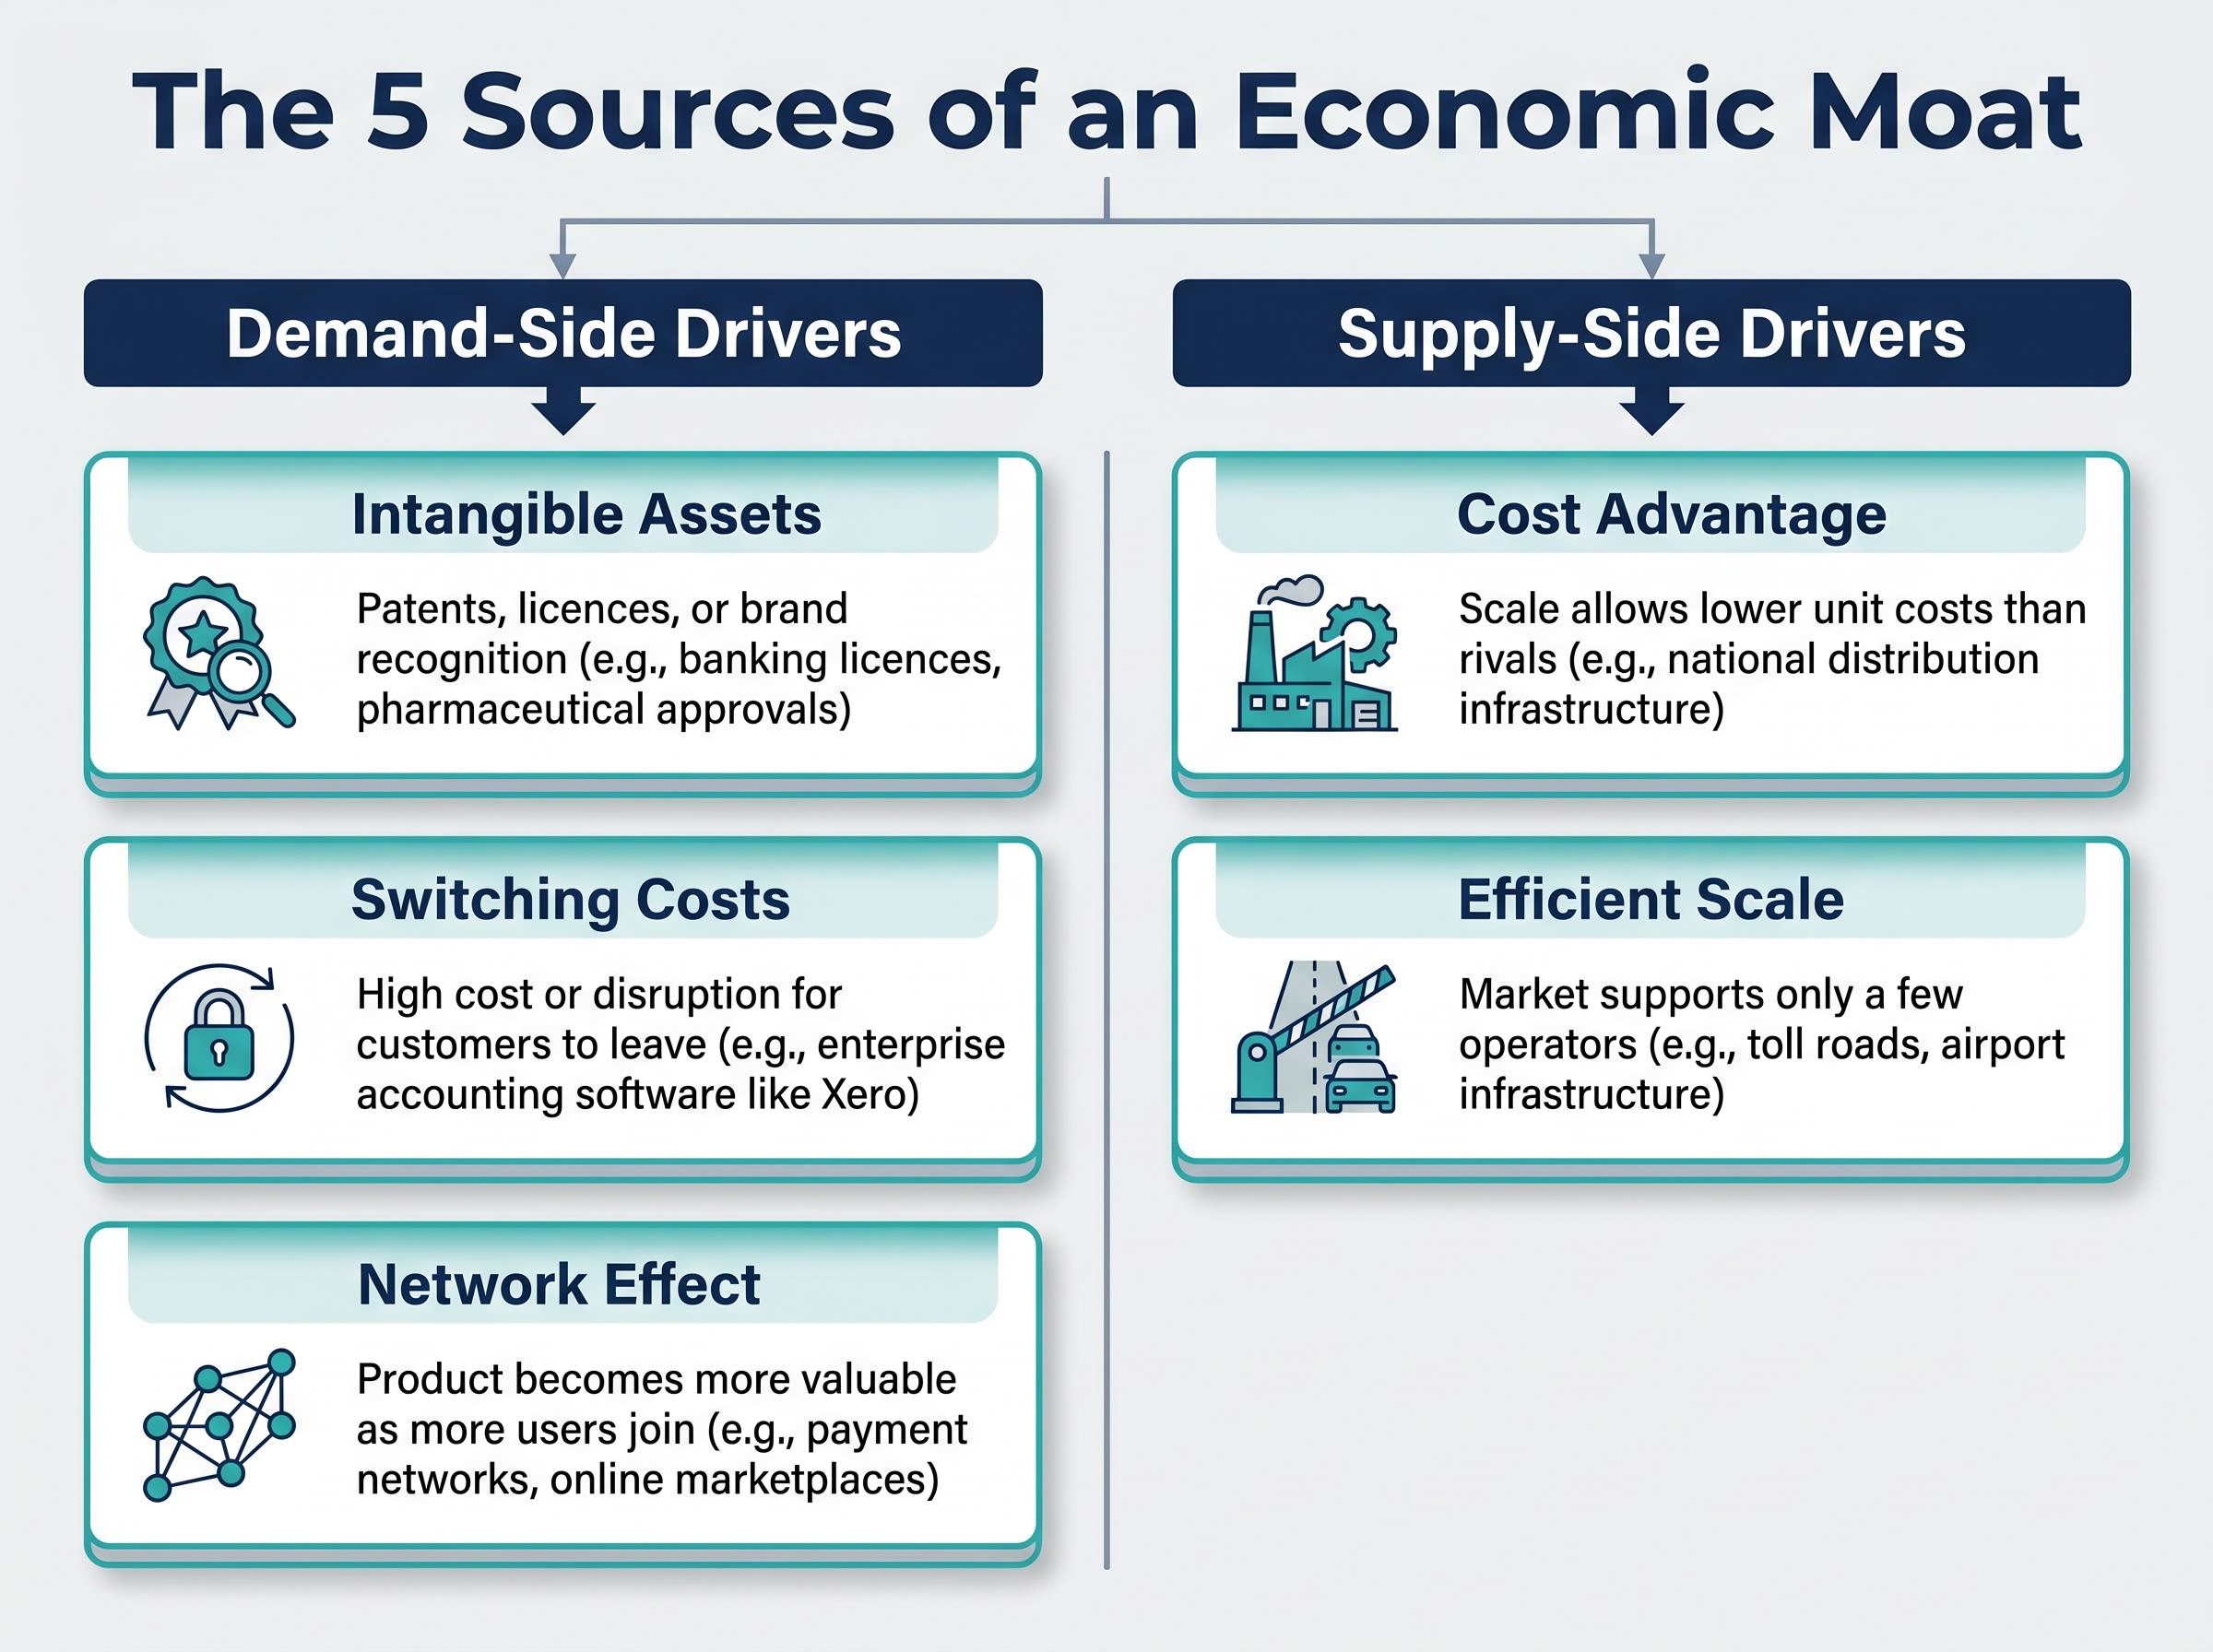
Intangible assets include patents, regulatory licences, and brand recognition. A pharmaceutical company holding decades of clinical approvals, or a bank operating under a limited banking licence, possesses an advantage that competitors cannot replicate quickly or cheaply.
Switching costs arise when customers are embedded in contracts, integrated workflows, or proprietary software environments. Enterprise accounting software is the standard example: once a firm’s operations run through a platform, the cost of migrating to a competitor exceeds the inconvenience of staying.
Network effects occur when a platform or service becomes more valuable with each additional user. Payment networks and online marketplaces exhibit this dynamic. A new entrant must reach critical mass before offering comparable value, and reaching that mass is the barrier.
Cost advantage describes scale-driven unit economics that rivals cannot match. A company with extensive distribution infrastructure can deliver goods at a per-unit cost that a smaller competitor simply cannot replicate without equivalent capital expenditure.
Efficient scale applies to natural oligopolies or limited-market businesses. Toll roads and airport infrastructure are clear examples: the market supports a limited number of operators, and a new entrant would depress returns for all participants, discouraging entry altogether.
Multiple reinforcing moat sources are generally more durable than any single source standing alone. A business combining switching costs with intangible assets, for instance, presents a far higher barrier to competition than one relying on brand alone.
| Moat Source | Plain Language Definition | Example |
|---|---|---|
| Intangible Assets | Patents, licences, or brand recognition that cannot be easily copied | Banking licences, pharmaceutical approvals |
| Cost Advantage | Scale allows lower unit costs than any rival can achieve | National distribution infrastructure |
| Switching Costs | Customers face high cost or disruption if they leave | Enterprise accounting software (e.g., Xero) |
| Network Effect | The product or platform becomes more valuable as more users join | Payments networks, online marketplaces |
| Efficient Scale | Market supports only a few operators; new entry would hurt everyone | Toll roads, airport infrastructure |
Knowing the five sources is the foundation. Applying them to a real company requires a two-stage process: start with the business model and industry structure, then cross-check with the numbers.
Australian financial education platforms consistently teach this sequence. The qualitative assessment comes first. The investor asks probing questions about the company before opening a spreadsheet:
These questions map directly to the five moat sources. Each one points the investor to a specific aspect of the business to examine, rather than asking the broad and often unhelpful question of whether the company is “good.”
Once the qualitative picture is formed, the second stage uses financial metrics as a cross-check:
Sustained return on invested capital above the cost of capital across a full business cycle is the single most diagnostic numerical signal of a genuine moat, because it measures whether a business is actually earning more than it costs to run, year after year; investors who want to build fluency with this and the four other metrics that anchor fundamental analysis will find that each one answers a different question about the same company.
Start from the business model. Let the numbers confirm what the analysis already suggests.
The temptation for many retail investors is to invert this order, beginning with financial metrics and working backward. The risk is clear: a temporarily profitable company can post strong ROIC for several years without possessing any structural protection. The business model analysis is what prevents that misidentification.
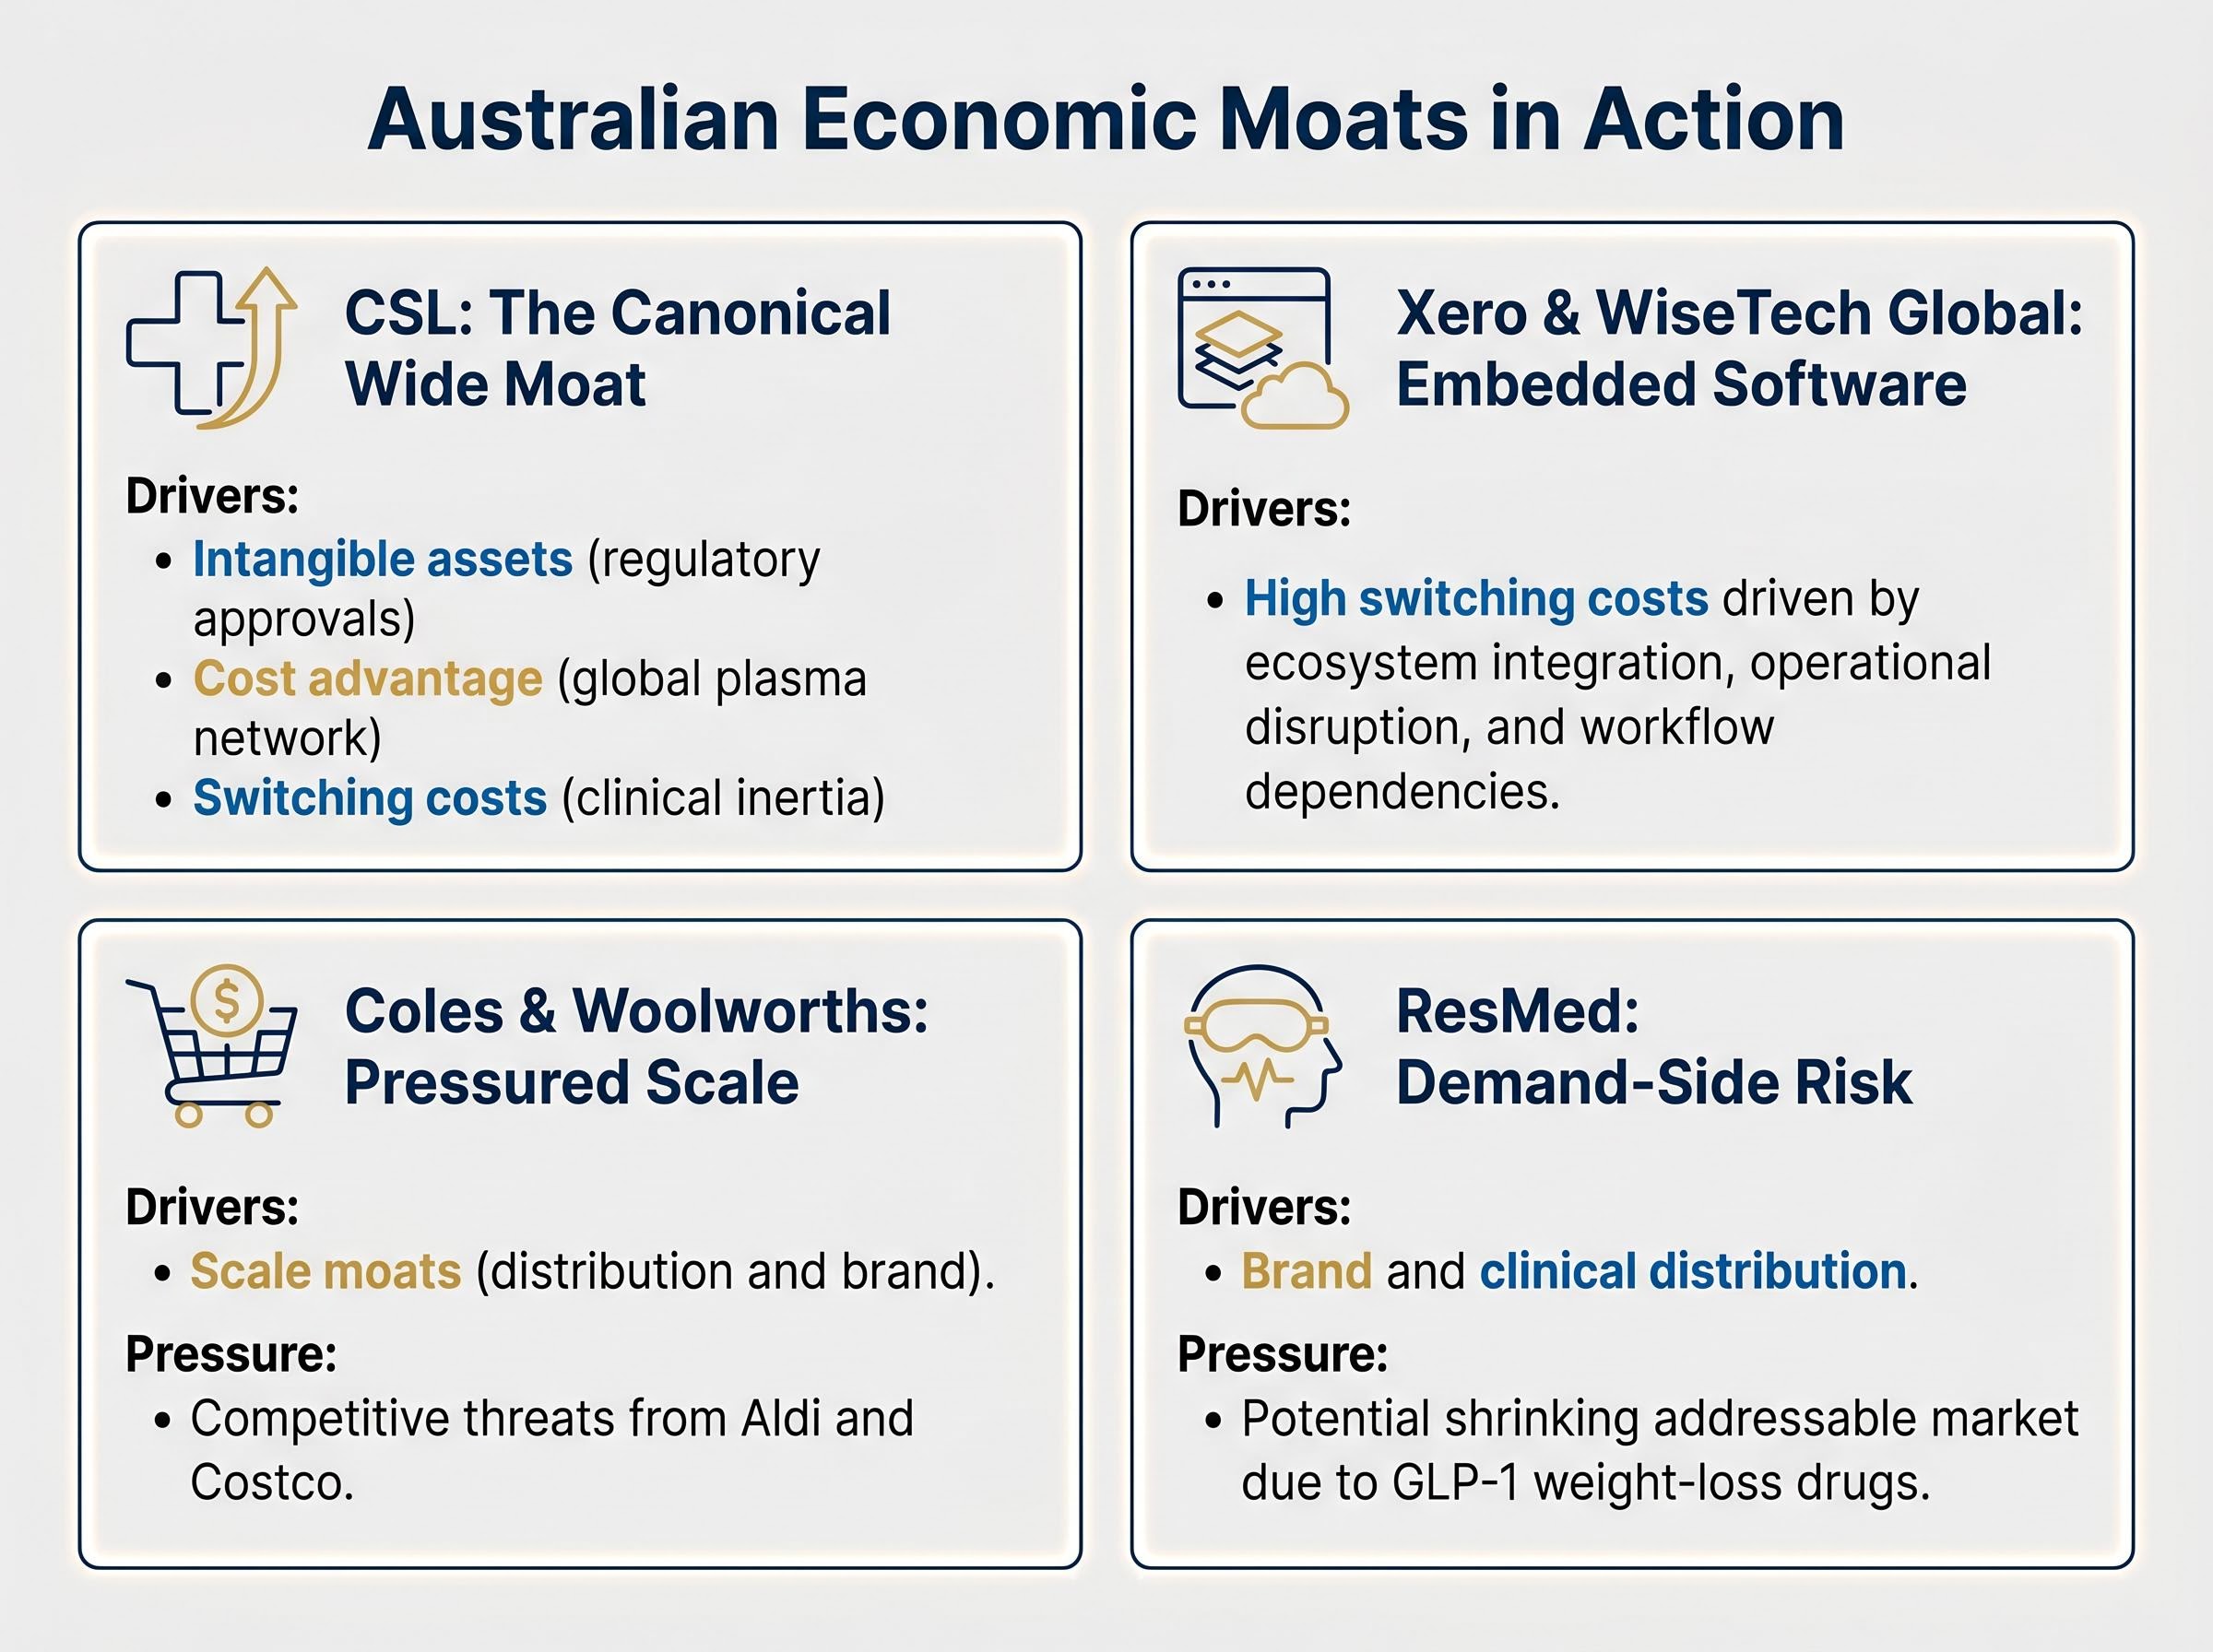
CSL is the most frequently cited wide-moat company on the ASX, and for good reason. Its advantages map across multiple drivers simultaneously:
The combination of reinforcing moat sources is precisely what makes CSL a teaching example. No single driver, taken alone, would be as durable. Together, they create a barrier that has held through multiple market cycles, supported by consistent return on equity.
Xero and WiseTech Global illustrate how switching costs operate in software businesses. Xero’s moat rests on ecosystem integration: once an accountant’s practice and their SME clients run through Xero’s platform, the workflow dependencies make migration costly and disruptive. Churn is structurally low, and 2024-2025 analyst commentary focused on pricing power and churn rates as the real-time tests of moat durability.
WiseTech operates in a similar dynamic within logistics. Its customs and freight management software is embedded in operational workflows across carriers and freight forwarders globally. Re-implementing that software is operationally disruptive and expensive, which keeps switching costs high and displacement unlikely over a normal investment horizon.
Coles and Woolworths both possess scale moats: distribution networks, brand recognition, and cost advantages built over decades. Yet these moats are not widening. Competitive pressure from Aldi and Costco, alongside regulatory scrutiny over pricing practices, illustrates that a moat’s value can be static or compressing even when the advantage itself is real.
ResMed adds a different lesson. Its moat in sleep-apnea devices, built on brand, clinical distribution, and device management switching costs, is genuine. But GLP-1 weight-loss drugs may reduce the incidence of obesity-related sleep apnea, potentially shrinking the addressable market. This teaches a principle the five-driver framework alone does not capture: moat analysis must include demand-side structural risk, not just competitive-entry risk.
Identifying a moat is the starting point. The more consequential question is whether that moat is widening, stable, or eroding over time. Static classification, assigning a company a wide or narrow label once and moving on, produces a buy-and-forget mentality that the analytical evidence consistently warns against.
A moat can be real today and still be on a trajectory that makes it less valuable over a five-year horizon.
The signals are concrete and trackable:
| Widening Signals | Narrowing Signals |
|---|---|
| Pricing power improving | Structural margin compression |
| Market share growing | Rising customer churn |
| Rising customer lifetime value | New entrants gaining traction |
| Increasing margins | Declining pricing power |
| Active reinvestment in competitive advantages | R&D underspend relative to the competitive environment |
AI has introduced a bifurcated dynamic to this trajectory analysis. For incumbents with proprietary data, distribution scale, and embedded workflows, AI integration can widen existing moats. Microsoft is the clearest example: its AI integrations across the enterprise stack deepen switching costs and raise the migration cost for organisations already embedded in the ecosystem.
Network-effect platforms on the ASX represent one of the clearest live tests of moat durability in an AI environment: Morningstar’s February 2026 review of 132 companies found that participation-based moats, where value compounds with each additional user on a platform, were the category least disrupted by AI advances.
For businesses whose edge rested on controlling access to information, AI moves in the opposite direction. Niche data providers and specialist information intermediaries face commoditisation as AI models make information broadly accessible. The moat dissolves when the underlying scarcity that created it, access to proprietary information, is no longer scarce.
Alphabet sits between these poles. Analysts widely assess its moat as intact near-term, given search scale and advertiser network effects. But the trajectory is actively debated, with AI-native search challengers such as OpenAI and Perplexity AI testing the durability of that advantage in ways that were not visible even two years ago.
Everything above distils into a sequential process that any retail investor can apply this week to a company they are evaluating:
That final step is worth emphasising. A wide moat does not justify any price. The combination of a genuine structural advantage and an attractive entry point is what drives the investment thesis. Morningstar’s own framework captures this explicitly, rating both moat quality and valuation independently.
Commentary from Australian wealth managers through 2024-2025 noted that moat-oriented portfolios showed relative resilience in the 2022-2023 rate-rising environment, consistent with the thesis that pricing power and durable earnings hold up when monetary conditions tighten. The strongest performance evidence for moat-based strategies, however, is long-run (spanning 10 or more years) rather than any given short window.
For Australian retail investors who prefer rules-based exposure without conducting individual company analysis, moat-focused ETFs such as the ASX-listed VanEck Morningstar Wide Moat ETF offer a structured alternative. The framework above, however, is designed for the investor who wants to conduct the analysis independently.
Moat-focused ETFs on the ASX, such as the VanEck Morningstar Wide Moat ETF, apply both a wide moat rating requirement and a valuation screen before inclusion, meaning the fund systematically avoids the trap of owning high-quality businesses at prices that have already extinguished the return advantage.
The economic moat concept gives investors a language for one of the most important distinctions in long-term equity analysis: whether a company’s competitive advantage is structural or temporary. That distinction shapes whether a holding compounds for a decade or erodes within a cycle.
The habit of mind to carry forward is not the initial classification. It is the ongoing question of trajectory. Is the moat widening, stable, or narrowing? The investor who tracks that signal over time holds a meaningful edge over the one who makes a single assessment and moves on.
As AI, regulation, and competitive fragmentation continue to reshape industries, the ability to recognise which businesses carry genuine structural protection becomes more valuable, not less.
For investors wanting to apply moat analysis under pressure, our dedicated guide to classifying market selloffs walks through a three-category framework that distinguishes irrational overreactions from structural disruption using the same moat indicators covered here, including customer retention signals, ROIC trajectories, and pricing power trends, with worked examples from Netflix in 2022 and Kodak.
This article is for informational purposes only and should not be considered financial advice. Investors should conduct their own research and consult with financial professionals before making investment decisions.
An economic moat is a structural competitive advantage that protects a company's profitability from rivals over the long term, just as a castle moat prevents attack. The concept was popularised by Warren Buffett and formalised by Morningstar into a three-tier rating system: wide, narrow, or none.
Morningstar identifies five moat sources: intangible assets (patents, licences, brand), switching costs (customer lock-in), network effects (value grows with more users), cost advantage (scale-driven lower unit costs), and efficient scale (natural oligopolies where new entry would hurt all participants).
Start by asking qualitative questions about the business model, such as whether the company can raise prices above inflation without losing customers or whether customers are locked into contracts, then cross-check with financial metrics including sustained return on invested capital above the cost of capital, stable margins, and low customer churn.
CSL is the most frequently cited wide-moat company on the ASX, benefiting from regulatory approvals, a global plasma collection network, and clinical switching costs. Xero and WiseTech Global are also cited for their high software switching costs driven by deep workflow integration.
A company can hold a genuine moat today while that moat is quietly eroding, meaning a static wide or narrow label can mislead investors into a buy-and-forget mentality. Tracking signals such as pricing power, customer churn, margin trends, and R&D reinvestment gives investors a forward-looking picture of whether the advantage is widening, stable, or narrowing.