A 5-Step Framework for Valuing Slowing Growth Stocks
10 hrs ago

Retail investors deposited $1.3 billion per day into global equity markets during the first half of 2025, a 32.6% jump from the same period a year earlier, according to RSM US research. That figure represents millions of new market participants making real capital decisions, yet most beginners still evaluate stocks using a single number pulled from a finance app. Fundamental analysis metrics offer a structured alternative: a way to judge whether a company is financially healthy, competitively positioned, and reasonably priced. The challenge is not finding the metrics. It is knowing which ones matter most, what each actually measures, and why none of them means anything in isolation. This guide explains the five core metrics every investor should learn first, how each is calculated, what it reveals, and how to read them together using sector peers as the benchmark that brings every number to life.
Those retail capital flows reflect millions of individual buy and sell decisions feeding into price discovery mechanics that operate continuously across order books, where competing bids and offers from all active participants determine the price a P/E ratio is ultimately calculated against.
A stock with a price-to-earnings ratio of 12 looks cheap. It is the kind of number that stops a beginner mid-scroll and triggers a buy impulse. But that same P/E could belong to a company whose earnings have been flat for three years, with no catalyst in sight. The “bargain” is actually a business the market has priced for stagnation.
Meanwhile, a stock trading at a P/E of 40 may look expensive by the same logic. Yet if that company is growing earnings at 30% a year, the premium is the market’s way of pricing in continued expansion. Same metric, opposite conclusions.
$1.3 billion per day. That is how much retail capital flowed into markets during H1 2025 (RSM US). Most of that money is being deployed by investors who have never read a balance sheet. The five metrics below are the starting point for changing that.
Metrics only produce insight when read as a system. Each one answers a different question about the same company:
No single number captures all five answers. The rest of this guide builds each metric into a framework that does.
These two metrics are where most beginners start, and for good reason. EPS measures the raw profitability; P/E translates that profitability into a market price. Understanding both, and how one feeds directly into the other, is the foundation for everything that follows.
The formulas are straightforward:
EPS answers a simple question: how much profit did this company generate for each share? If a company earned $500 million in net income and has 250 million shares outstanding, its EPS is $2.00. That single figure tells an investor more than a headline earnings number ever could, because it accounts for the number of shares diluting that profit.
A single quarter’s EPS, however, is a snapshot. Tracking EPS across several reporting periods reveals whether profitability is improving, deteriorating, or cycling with seasonal patterns. A company whose EPS has risen from $1.50 to $2.00 to $2.40 over three consecutive years is demonstrating a clear upward trajectory. One whose EPS is flat or declining may warrant closer scrutiny regardless of what its share price is doing.
Tracking EPS across consecutive periods is the start of earnings report analysis, but the number most investors see on a brokerage feed is often an adjusted figure that excludes items management has chosen to strip out, meaning the GAAP net income feeding into the EPS calculation warrants direct verification.
P/E takes EPS and asks: how much are investors willing to pay for each dollar of earnings? A share priced at $64 with an EPS of $2.00 has a P/E of 32. That number, on its own, means very little. It becomes useful only when measured against what other companies in the same sector are trading at.
The following table illustrates how widely “normal” P/E ranges vary across sectors:
| Sector | Approximate Trailing P/E Range |
|---|---|
| Application Software | ~32 |
| Banks | ~12-18 |
| Insurance | ~15 |
| Utilities | ~14-23 |
Sources: FullRatio; Siblis Research (January 2026). These are approximate historical averages; verify against live sources at the time of reading.
A P/E of 32 in application software sits near the sector average. The same figure in banking would be well above the peer range and would demand an explanation, such as unusually strong earnings growth or an upcoming catalyst the market is pricing in. Without this sector context, P/E is a number without a frame.
EPS and P/E reveal what the market thinks a company’s earnings are worth. Revenue growth and margins reveal whether the commercial engine producing those earnings is actually healthy. The two metrics trace the same dollar from the point of sale to the bottom line, and each step in that journey tells a different story.
Revenue growth, calculated as the percentage change in total revenue between comparable periods (year-over-year is the standard comparison), signals whether a company is expanding its commercial reach. A business growing revenue at 15% annually is attracting more customers, selling more product, or raising prices, or some combination of the three.
Revenue growth without margin improvement can signal hidden inefficiency. A company that grows sales by 20% but sees profits rise by only 5% may be spending aggressively to win market share at the expense of long-term profitability.
That is where margins enter the picture. They act as the efficiency filter, measuring how much of each revenue dollar survives the cost structure to become profit. The income statement presents this in three layers, each progressively more comprehensive:
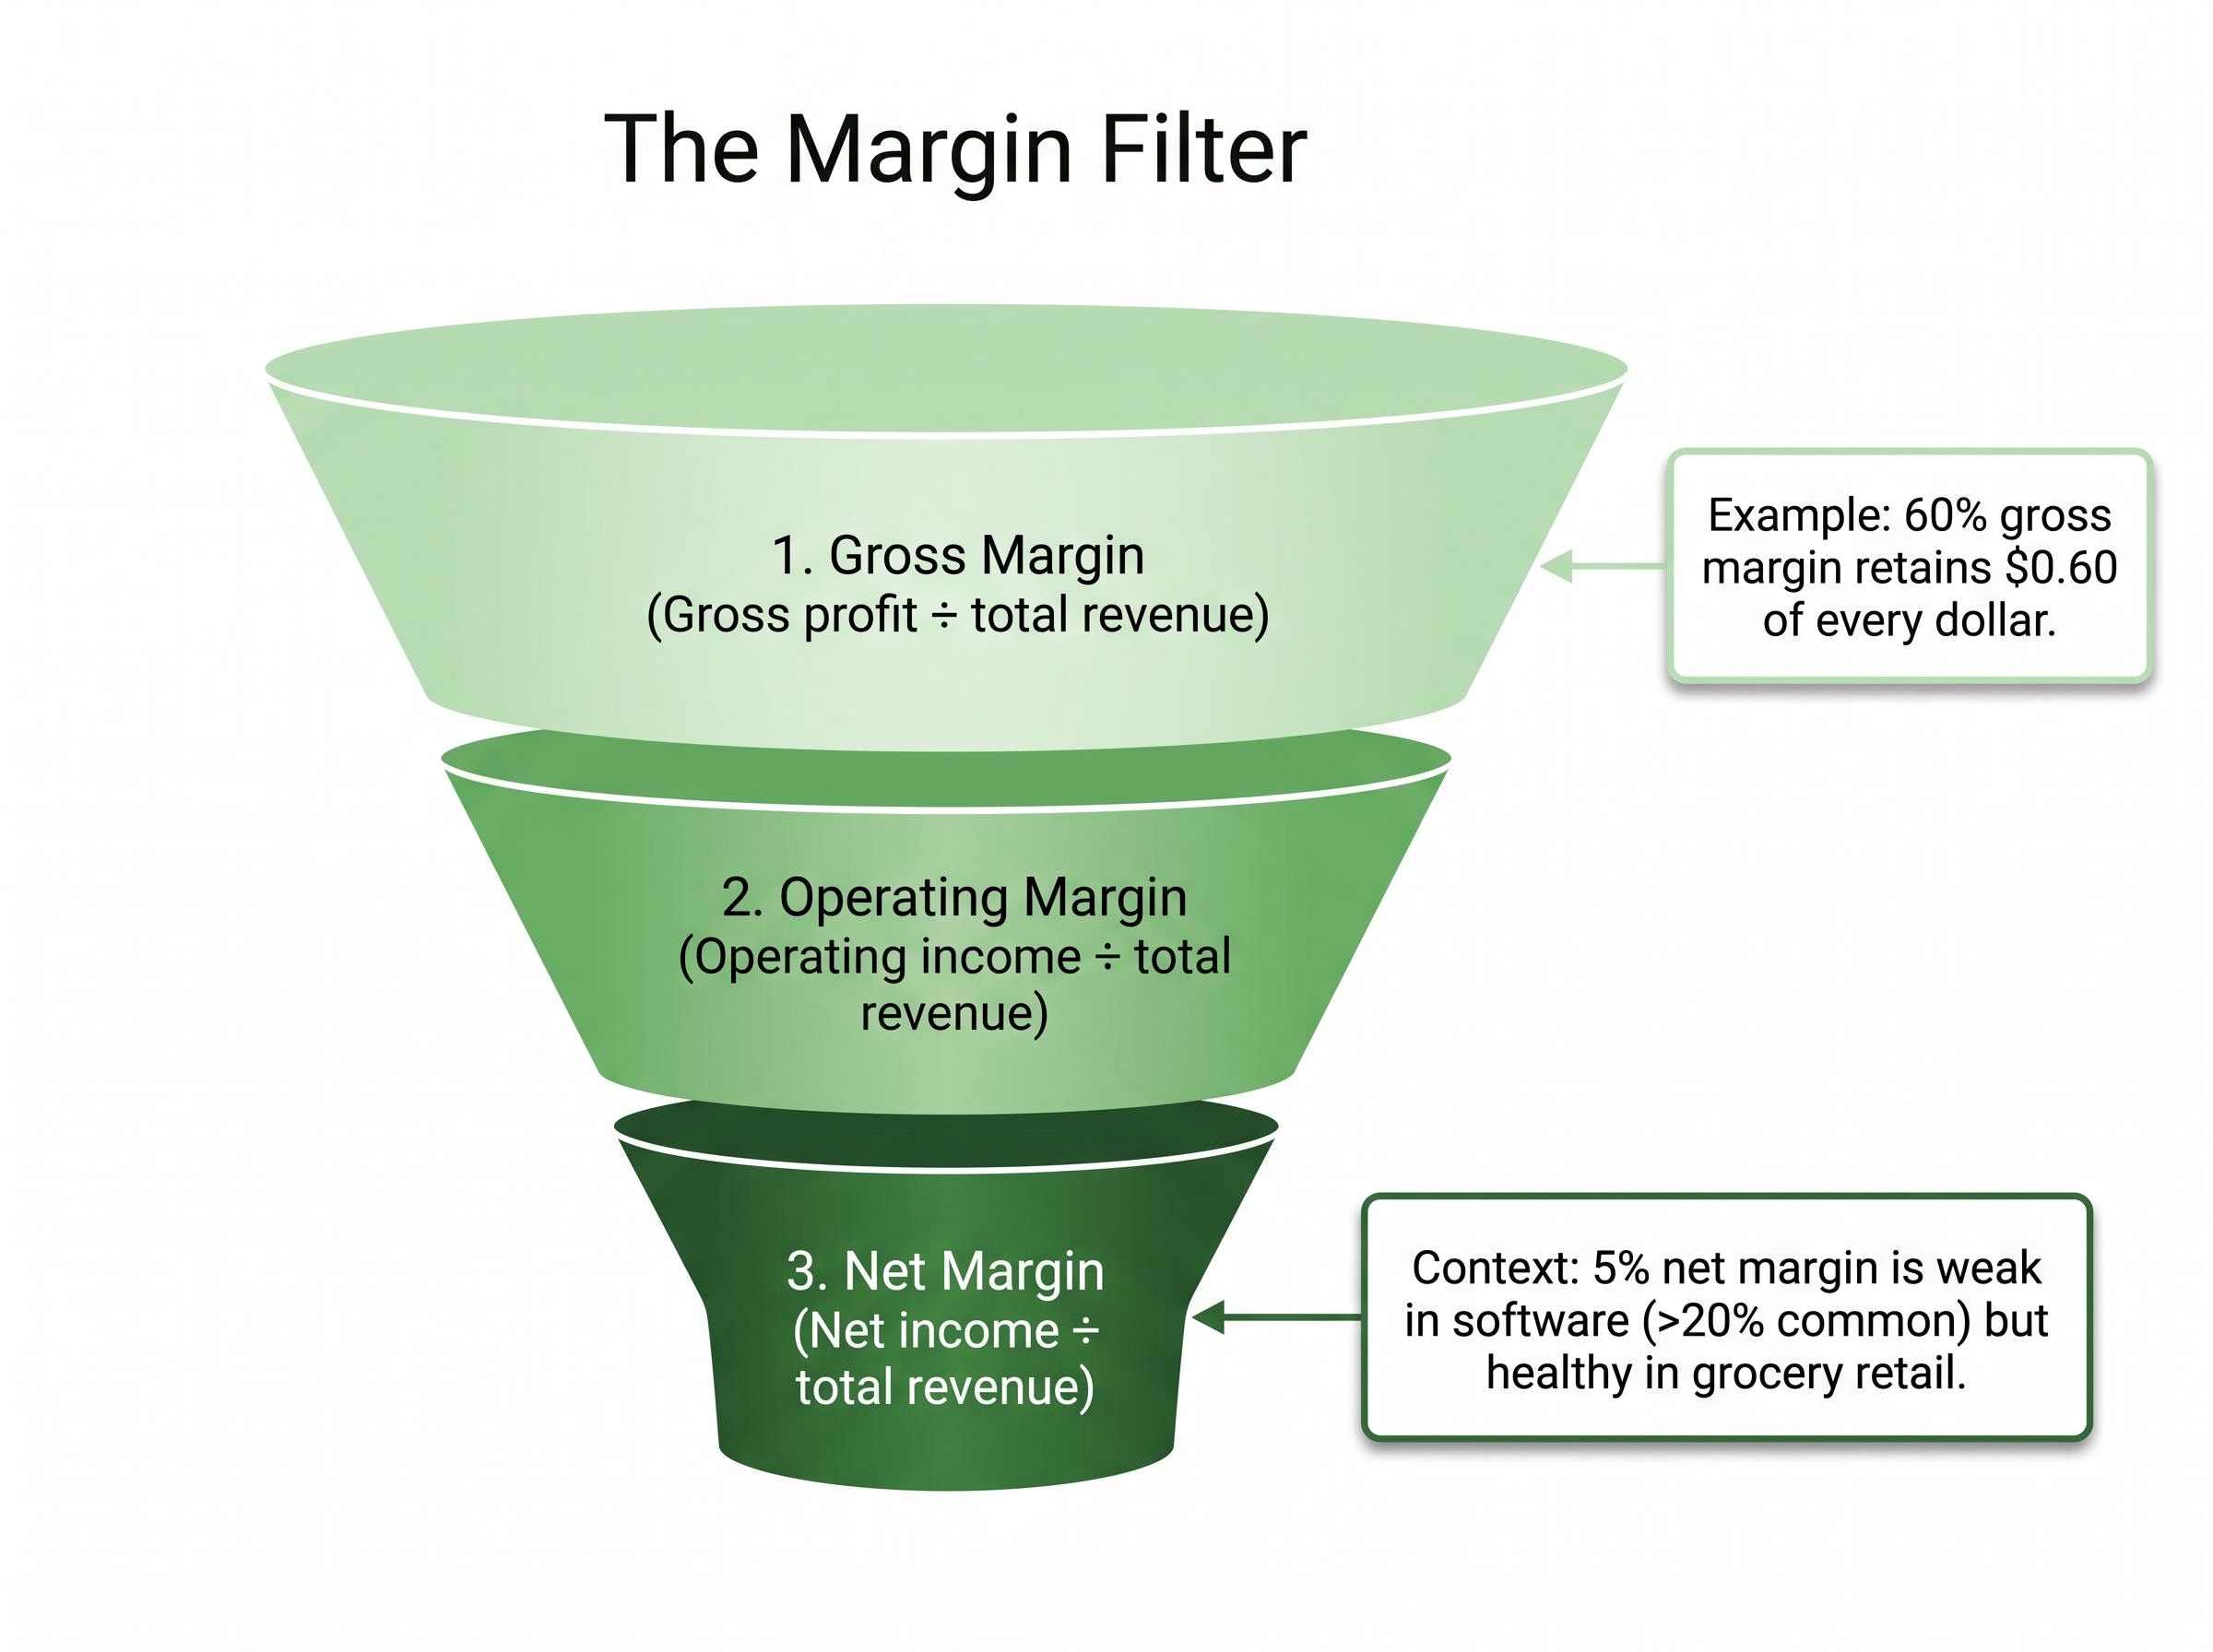
Margin benchmarks differ substantially by sector. A net margin of 5% is considered weak in software, where margins commonly exceed 20%, but may be healthy in grocery retail, where thin margins are an industry norm. Comparing a company’s margins to its direct sector peers, rather than to an arbitrary standard, is where the analysis becomes meaningful.
The combination of revenue growth and margin trends answers a question that EPS alone cannot: is this company growing in a way that creates real, sustainable profit?
Return on equity has an intuitive appeal. It answers a question every shareholder should ask: for every dollar of equity investors have put into this business, how much profit did management generate?
The formula is direct: ROE = Net income ÷ Total shareholders’ equity, expressed as a percentage. A company with $100 million in net income and $500 million in shareholders’ equity has an ROE of 20%. That figure, sustained over multiple years, signals a management team that consistently converts capital into returns.
The complication is debt.
A company can borrow heavily, use that borrowed capital to generate additional income, and produce an ROE that looks impressive on paper. The returns are real in an accounting sense, but the risk profile is fundamentally different from a company generating the same ROE without leverage. Borrowing amplifies both gains and losses; a leveraged 20% ROE is not the same signal as an unleveraged one.
The debt warning: A high ROE driven by high leverage is not a sign of operational strength. It is a sign that borrowed money is doing the heavy lifting, and that the return could reverse sharply if conditions tighten. Always check the debt-to-equity ratio alongside ROE.
According to analysis from TrueData and Winvesta, this is one of the most commonly misunderstood metric interactions among retail investors. The fix is a two-metric pairing:
ROE comparisons, like every other metric in this guide, are meaningful only within the same industry. Capital intensity varies dramatically across sectors: a bank’s balance sheet looks nothing like a software company’s. Comparing their ROE figures without that context produces misleading conclusions.
Every metric covered in this guide has a different “normal” range depending on the sector. A P/E of 32 is unremarkable in software but elevated in banking. A net margin of 5% is healthy in retail but a red flag in technology. Without peer-group benchmarking, every number floats without context.
The analytical step that brings the framework together is straightforward: identify two or three direct competitors in the same sector, pull their P/E, EPS growth rate, margins, and ROE from a free platform, and compare each metric within that peer group. A company that outperforms its peers across multiple metrics is demonstrating relative strength. One that lags on several dimensions warrants closer examination, even if one individual metric (such as a low P/E) appears attractive in isolation.
The five-metric evaluation, applied to any stock, follows this sequence:
Applying this framework does not require a professional terminal. Three widely accessible platforms provide the data beginners need:
| Tool | Primary Use | Cost |
|---|---|---|
| Yahoo Finance | Individual stock fundamentals (P/E, EPS, ROE, margins) | Free |
| Morningstar | Sector benchmarks and comparative analysis | Free (basic access) |
| Finviz | Stock screening by metric thresholds (P/E, D/E, margins) | Free |
For investors seeking deeper benchmarking, the Damodaran NYU Stern database provides academic-grade historical sector averages updated annually. It is a particularly useful resource for understanding how current sector valuations compare to long-term norms.
The Damodaran NYU Stern database provides academic-grade historical sector averages updated annually, making it a particularly useful reference for understanding how current sector valuations compare to long-term norms across industries ranging from software to banking to retail.
A stock that clears every metric individually but shows deteriorating margins alongside rising debt deserves more scrutiny than its P/E alone would suggest. The value of this framework is not in ticking five boxes; it is in listening to where the metrics agree and where they disagree. Conflicting signals are often more informative than confirming ones.
Three mistakes to avoid:
The framework in this guide is a starting point, not a buy or sell trigger. Qualitative factors, including competitive positioning, management quality, and industry dynamics, are not captured by any number. For investors ready to extend the toolkit, three additional metrics build naturally on what has been covered here:
The most useful next step is practical. Choose one stock already in a portfolio or on a watchlist, pull its five core metrics from Yahoo Finance, compare them to two sector peers, and read what the numbers say together. That single exercise will teach more than any definition ever could.
For investors ready to move beyond the five-metric foundation and apply these ratios at the level of professional practitioners, our full explainer on institutional earnings analysis covers how sector-specific metrics such as net revenue retention for SaaS companies and loan loss provisions for banks reveal trajectory signals that headline EPS and P/E figures cannot, using free filings from SEC EDGAR to close the information gap between retail and institutional investors.
This article is for informational purposes only and should not be considered financial advice. Investors should conduct their own research and consult with financial professionals before making investment decisions.
Fundamental analysis is a method of evaluating a stock by examining key financial metrics such as earnings per share, price-to-earnings ratio, revenue growth, profit margins, and return on equity to determine whether a company is financially healthy and reasonably priced.
The price-to-earnings (P/E) ratio is calculated by dividing a company's share price by its earnings per share, and it measures how much investors are paying for each dollar of earnings. It only becomes meaningful when compared to other companies in the same sector, since normal P/E ranges vary widely across industries.
A company can boost its return on equity by taking on heavy debt, making its capital efficiency appear stronger than it actually is. Pairing ROE with the debt-to-equity ratio reveals whether strong returns are driven by genuine operational performance or by borrowed money amplifying results.
You should identify two or three direct competitors in the same sector and compare each metric, such as P/E, EPS growth, margins, and ROE, within that peer group, since normal ranges differ significantly by industry. Free platforms like Yahoo Finance, Morningstar, and Finviz provide the data needed to run this comparison without a professional terminal.
No. Revenue growth without improving margins can signal hidden inefficiency, as a company that grows sales by 20% but sees profits rise by only 5% may be spending aggressively to win market share at the expense of long-term profitability. Margins must be examined alongside revenue growth to assess whether expansion is genuinely sustainable.