Why a Rising AUD Is Quietly Eroding Your International ETF Returns
10 hrs ago
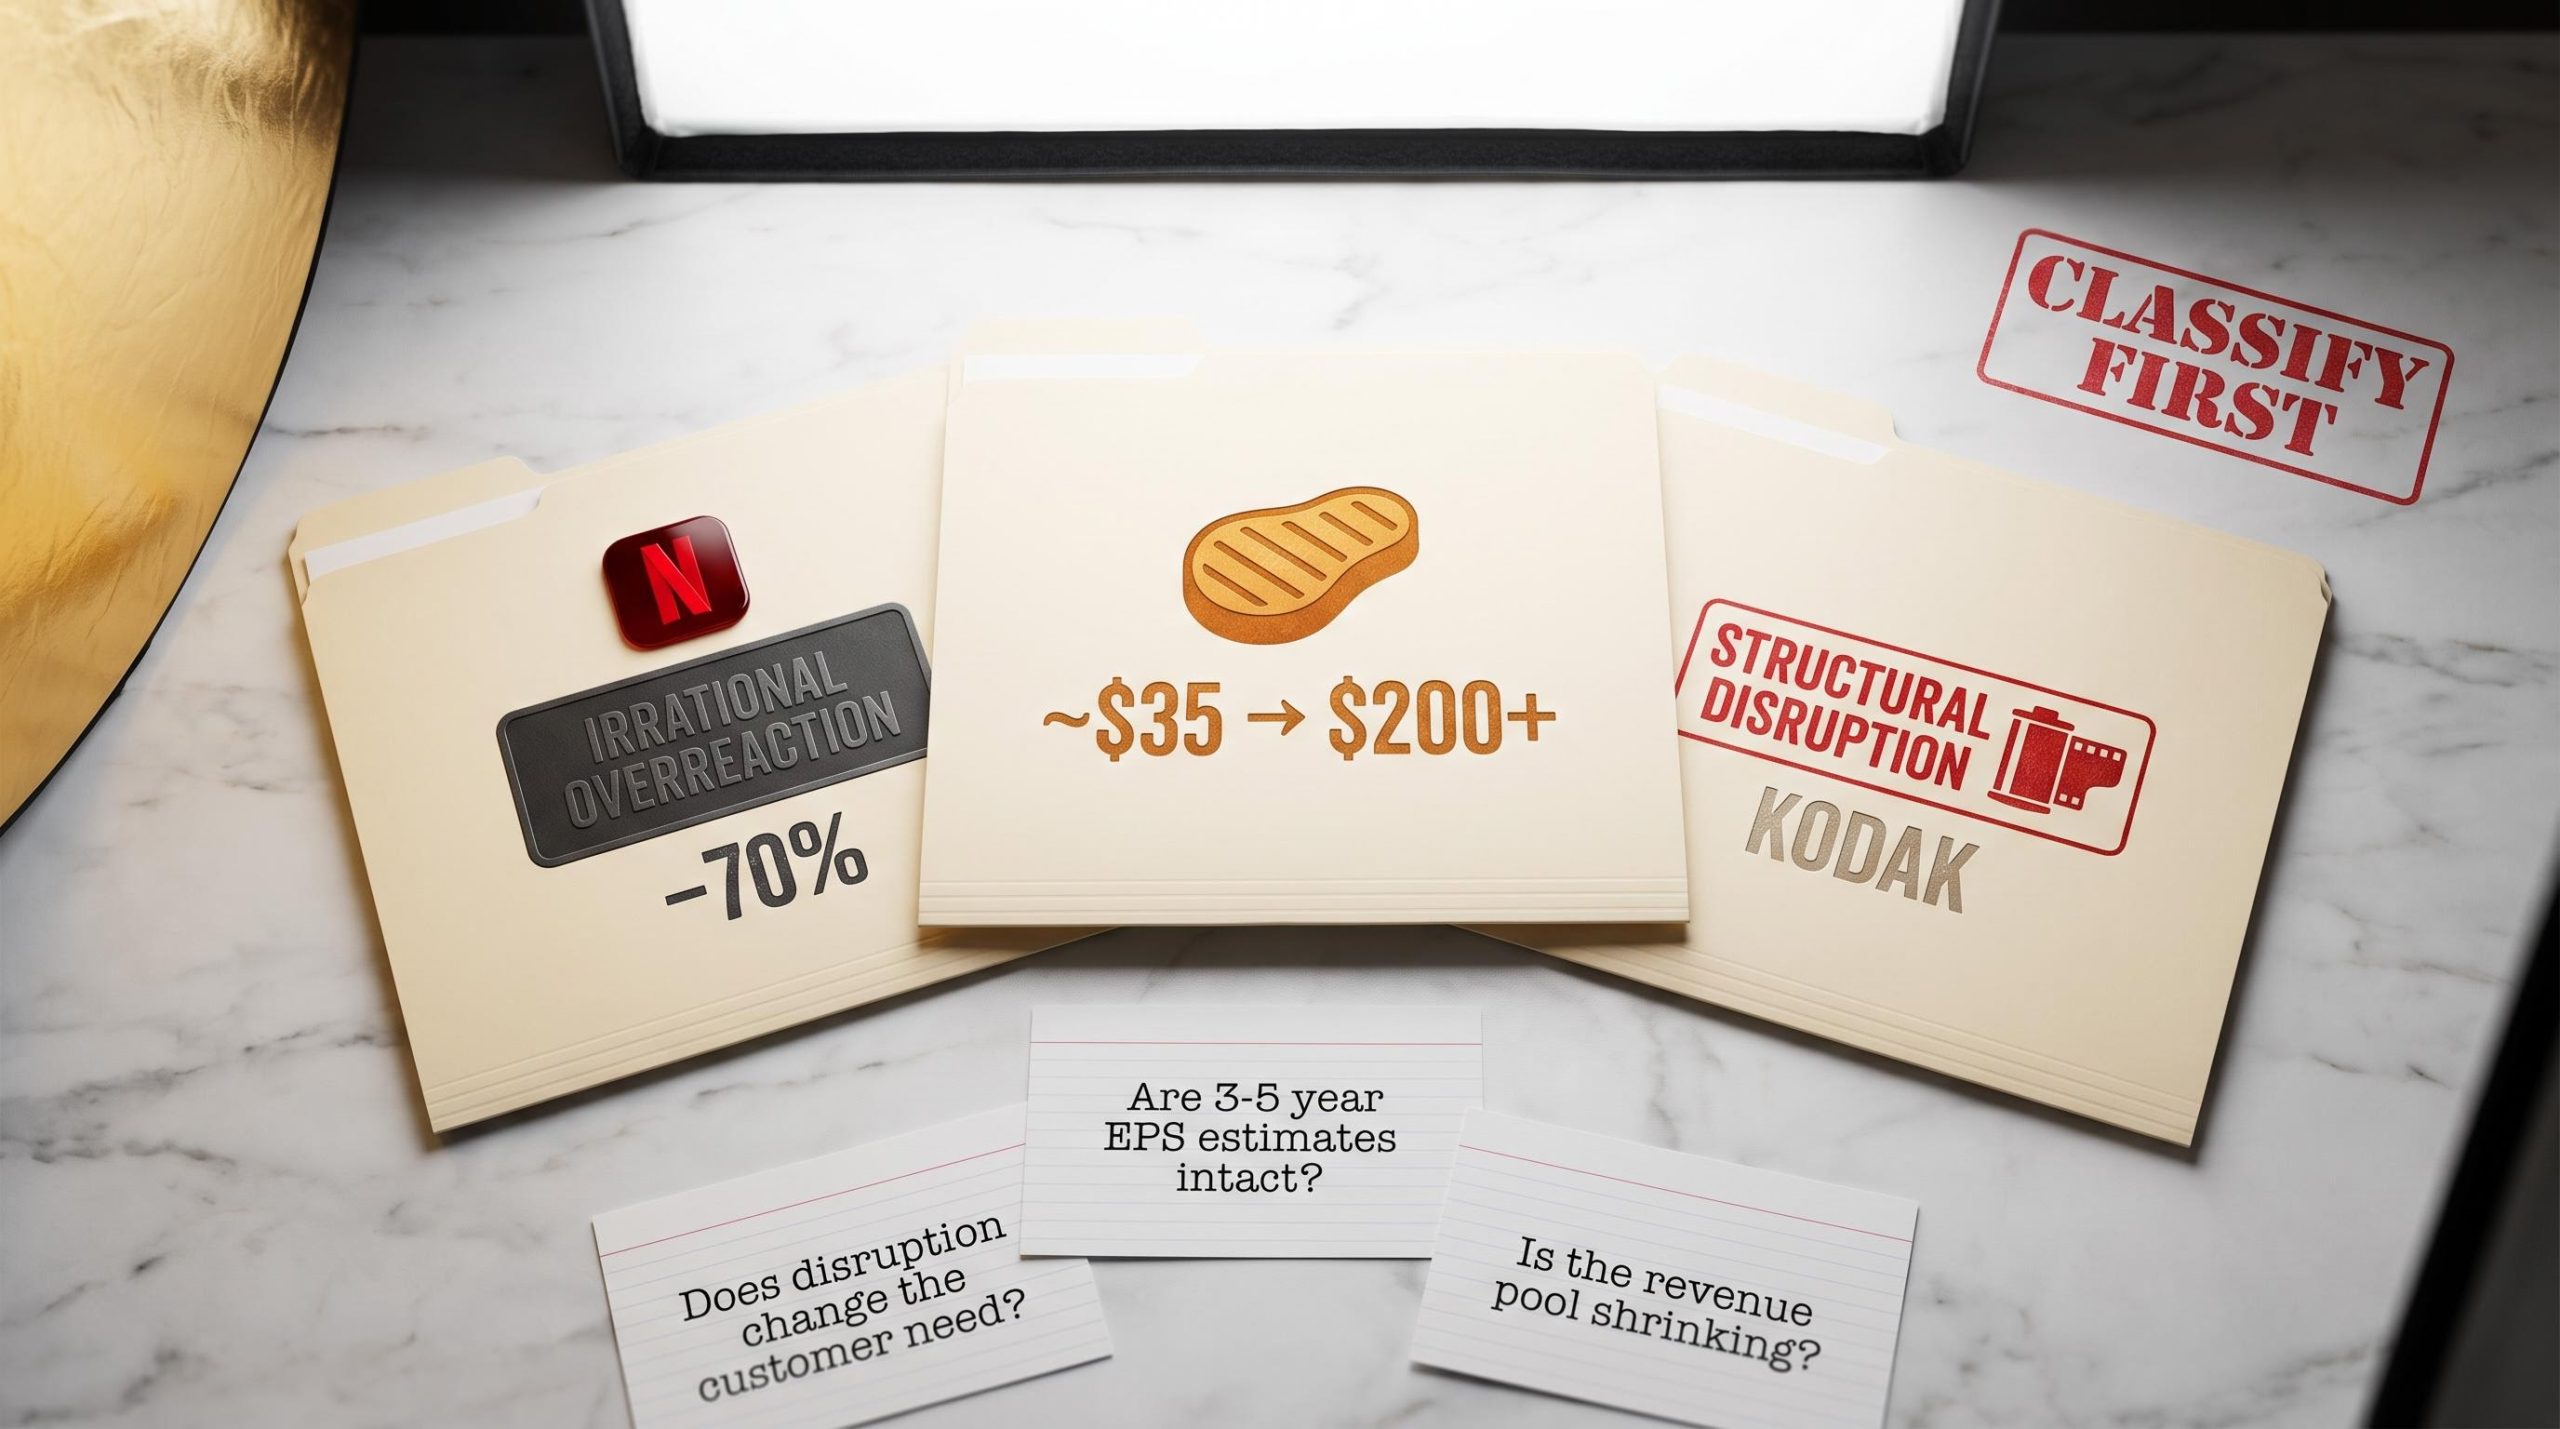
Most retail investors faced with a 30-40% sector decline ask the wrong first question. They ask “is this cheap?” when the more important question is “what kind of selloff is this?”
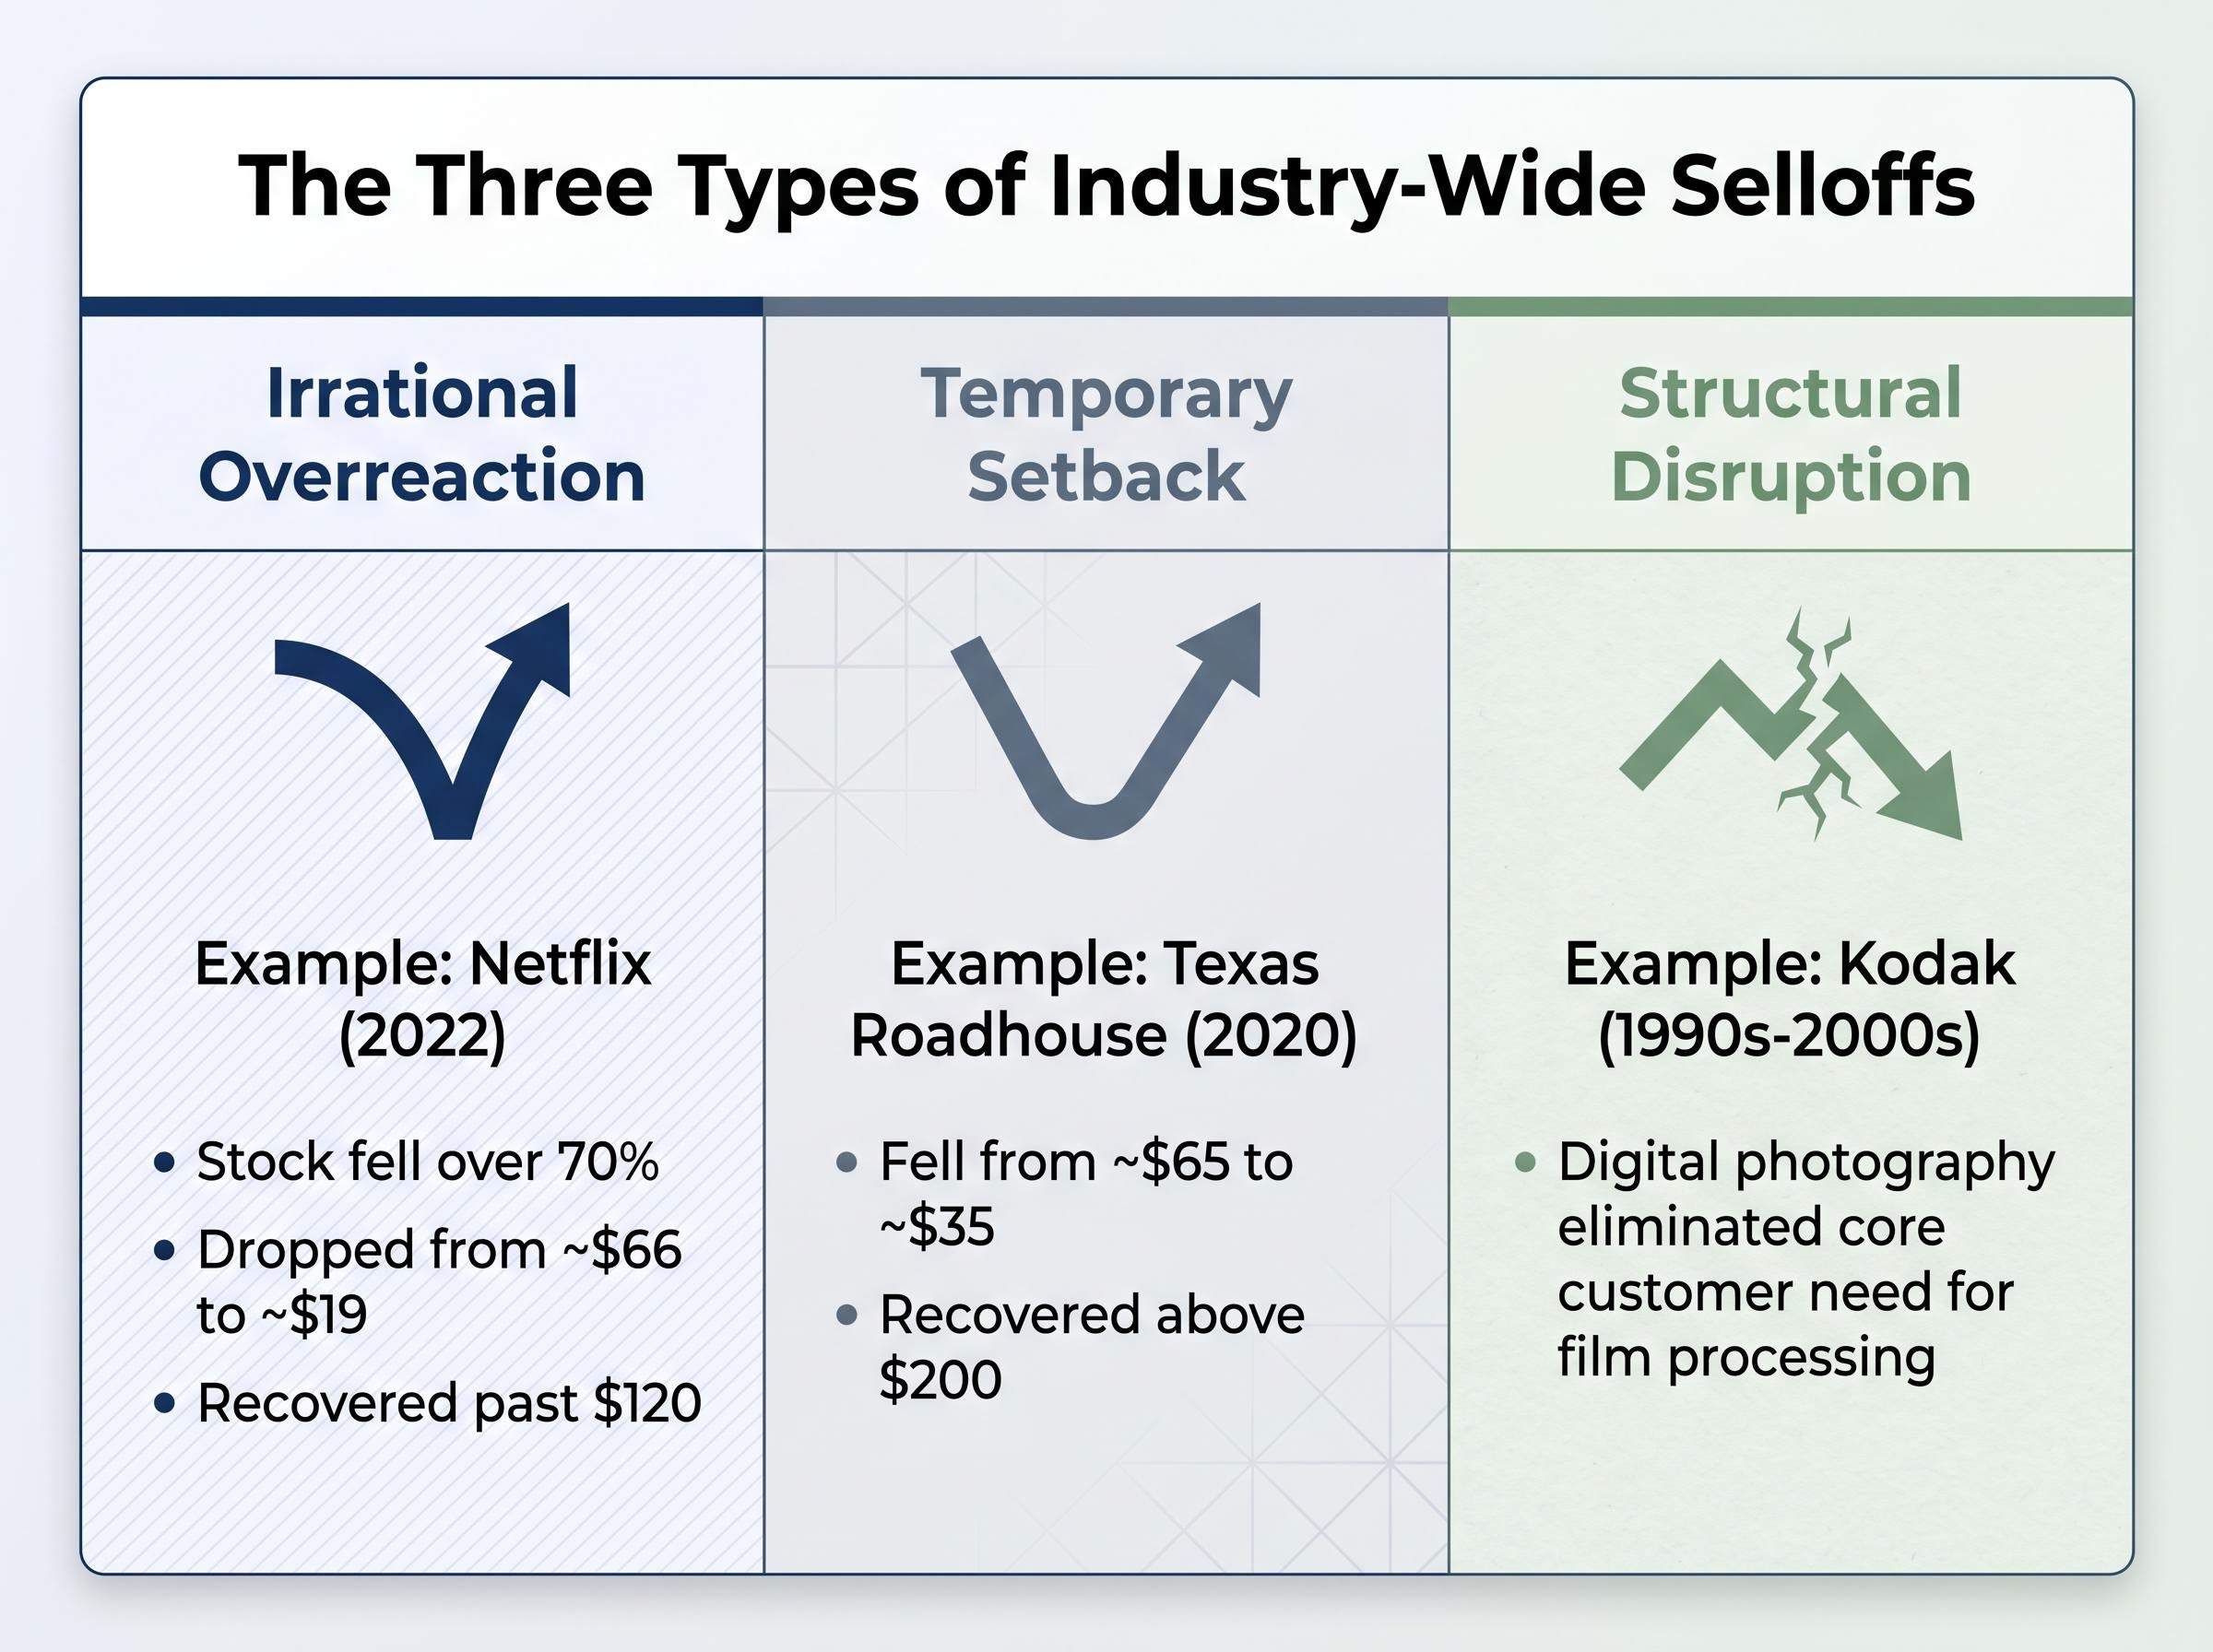
Consider three examples. In 2022, Netflix fell more than 70% from its peak as investors concluded that Disney Plus and Apple TV had permanently broken the streaming model. In 2020, Texas Roadhouse lost half its market value in weeks. In the 1990s, Kodak shareholders held through decades of structural collapse believing a recovery was coming. All three looked similar from the outside at the moment of maximum fear. Only one was actually a buying opportunity at any price. Another was a buying opportunity at the right price. The third was a trap at every price.
The framework that separates these outcomes is what this guide teaches. By the end, readers will have a repeatable three-category diagnostic process for classifying any industry-wide selloff, a set of concrete indicators for each category, and a decision framework for acting on that classification before committing capital.
Not all selloffs carry the same diagnostic challenge. Three types recur, each with a different information structure:
The difficulty is unique because industry-wide events combine elements of both other types while fitting neatly into neither.
When an entire industry sells off, markets abandon precision. Strong and weak companies get repriced together. Goldman Sachs research notes that markets frequently “overshoot fundamentals” during these events because long-term cash flow expectations often have not materially changed, even as narratives suggest otherwise. Morgan Stanley observed that many perceived AI “losers” in 2023-24 tech and media sold off on “narrative risk” before any structural markers appeared in the actual numbers.
This indiscriminate repricing is both the danger and the opportunity. Morningstar’s analysis found that intrinsic value estimates were largely unchanged for certain communication services and financials stocks despite double-digit price declines. The gap between price and business value tends to be widest during industry-level events, but that gap only matters if the business itself survives the disruption.
Investors who skip the diagnostic step and jump straight to valuation analysis are solving the wrong problem. Whether a stock is cheap depends entirely on what kind of selloff produced the low price, how much time remains before the thesis plays out, and how much uncertainty the position demands.
Netflix makes the pattern easy to see in hindsight. The stock declined from roughly $66 to $19 (split-adjusted, COVID-era figures) as streaming competition fears peaked, with investors pricing in a world where Disney Plus, Apple TV, and a half-dozen other entrants had permanently fragmented the subscriber base. The narrative was structural collapse.
The business told a different story. Revenues continued to grow. Customer retention remained stable. The moat, built on recommendation algorithms, global content scale, and switching costs embedded in user profiles, was never actually impaired. By Q1 2025, management described the business as “healthier than ever,” with continued revenue and subscriber growth. The stock had recovered well past $120, rewarding investors who recognised the mismatch between narrative and fundamentals.
The earnings-price divergence pattern that made Netflix’s 2022 decline identifiable as an overreaction, stable revenues and rising forward estimates alongside a collapsing share price, appeared with unusual clarity in ASX software stocks between October 2025 and April 2026, where consensus FY27 earnings estimates for companies like WiseTech Global rose approximately 29% while the share price fell more than 50%.
The harder challenge is identifying overreaction in real time, before the recovery confirms it. Several indicators, drawn from institutional research and recent sector case studies, help separate sentiment-driven selloffs from genuine structural damage:
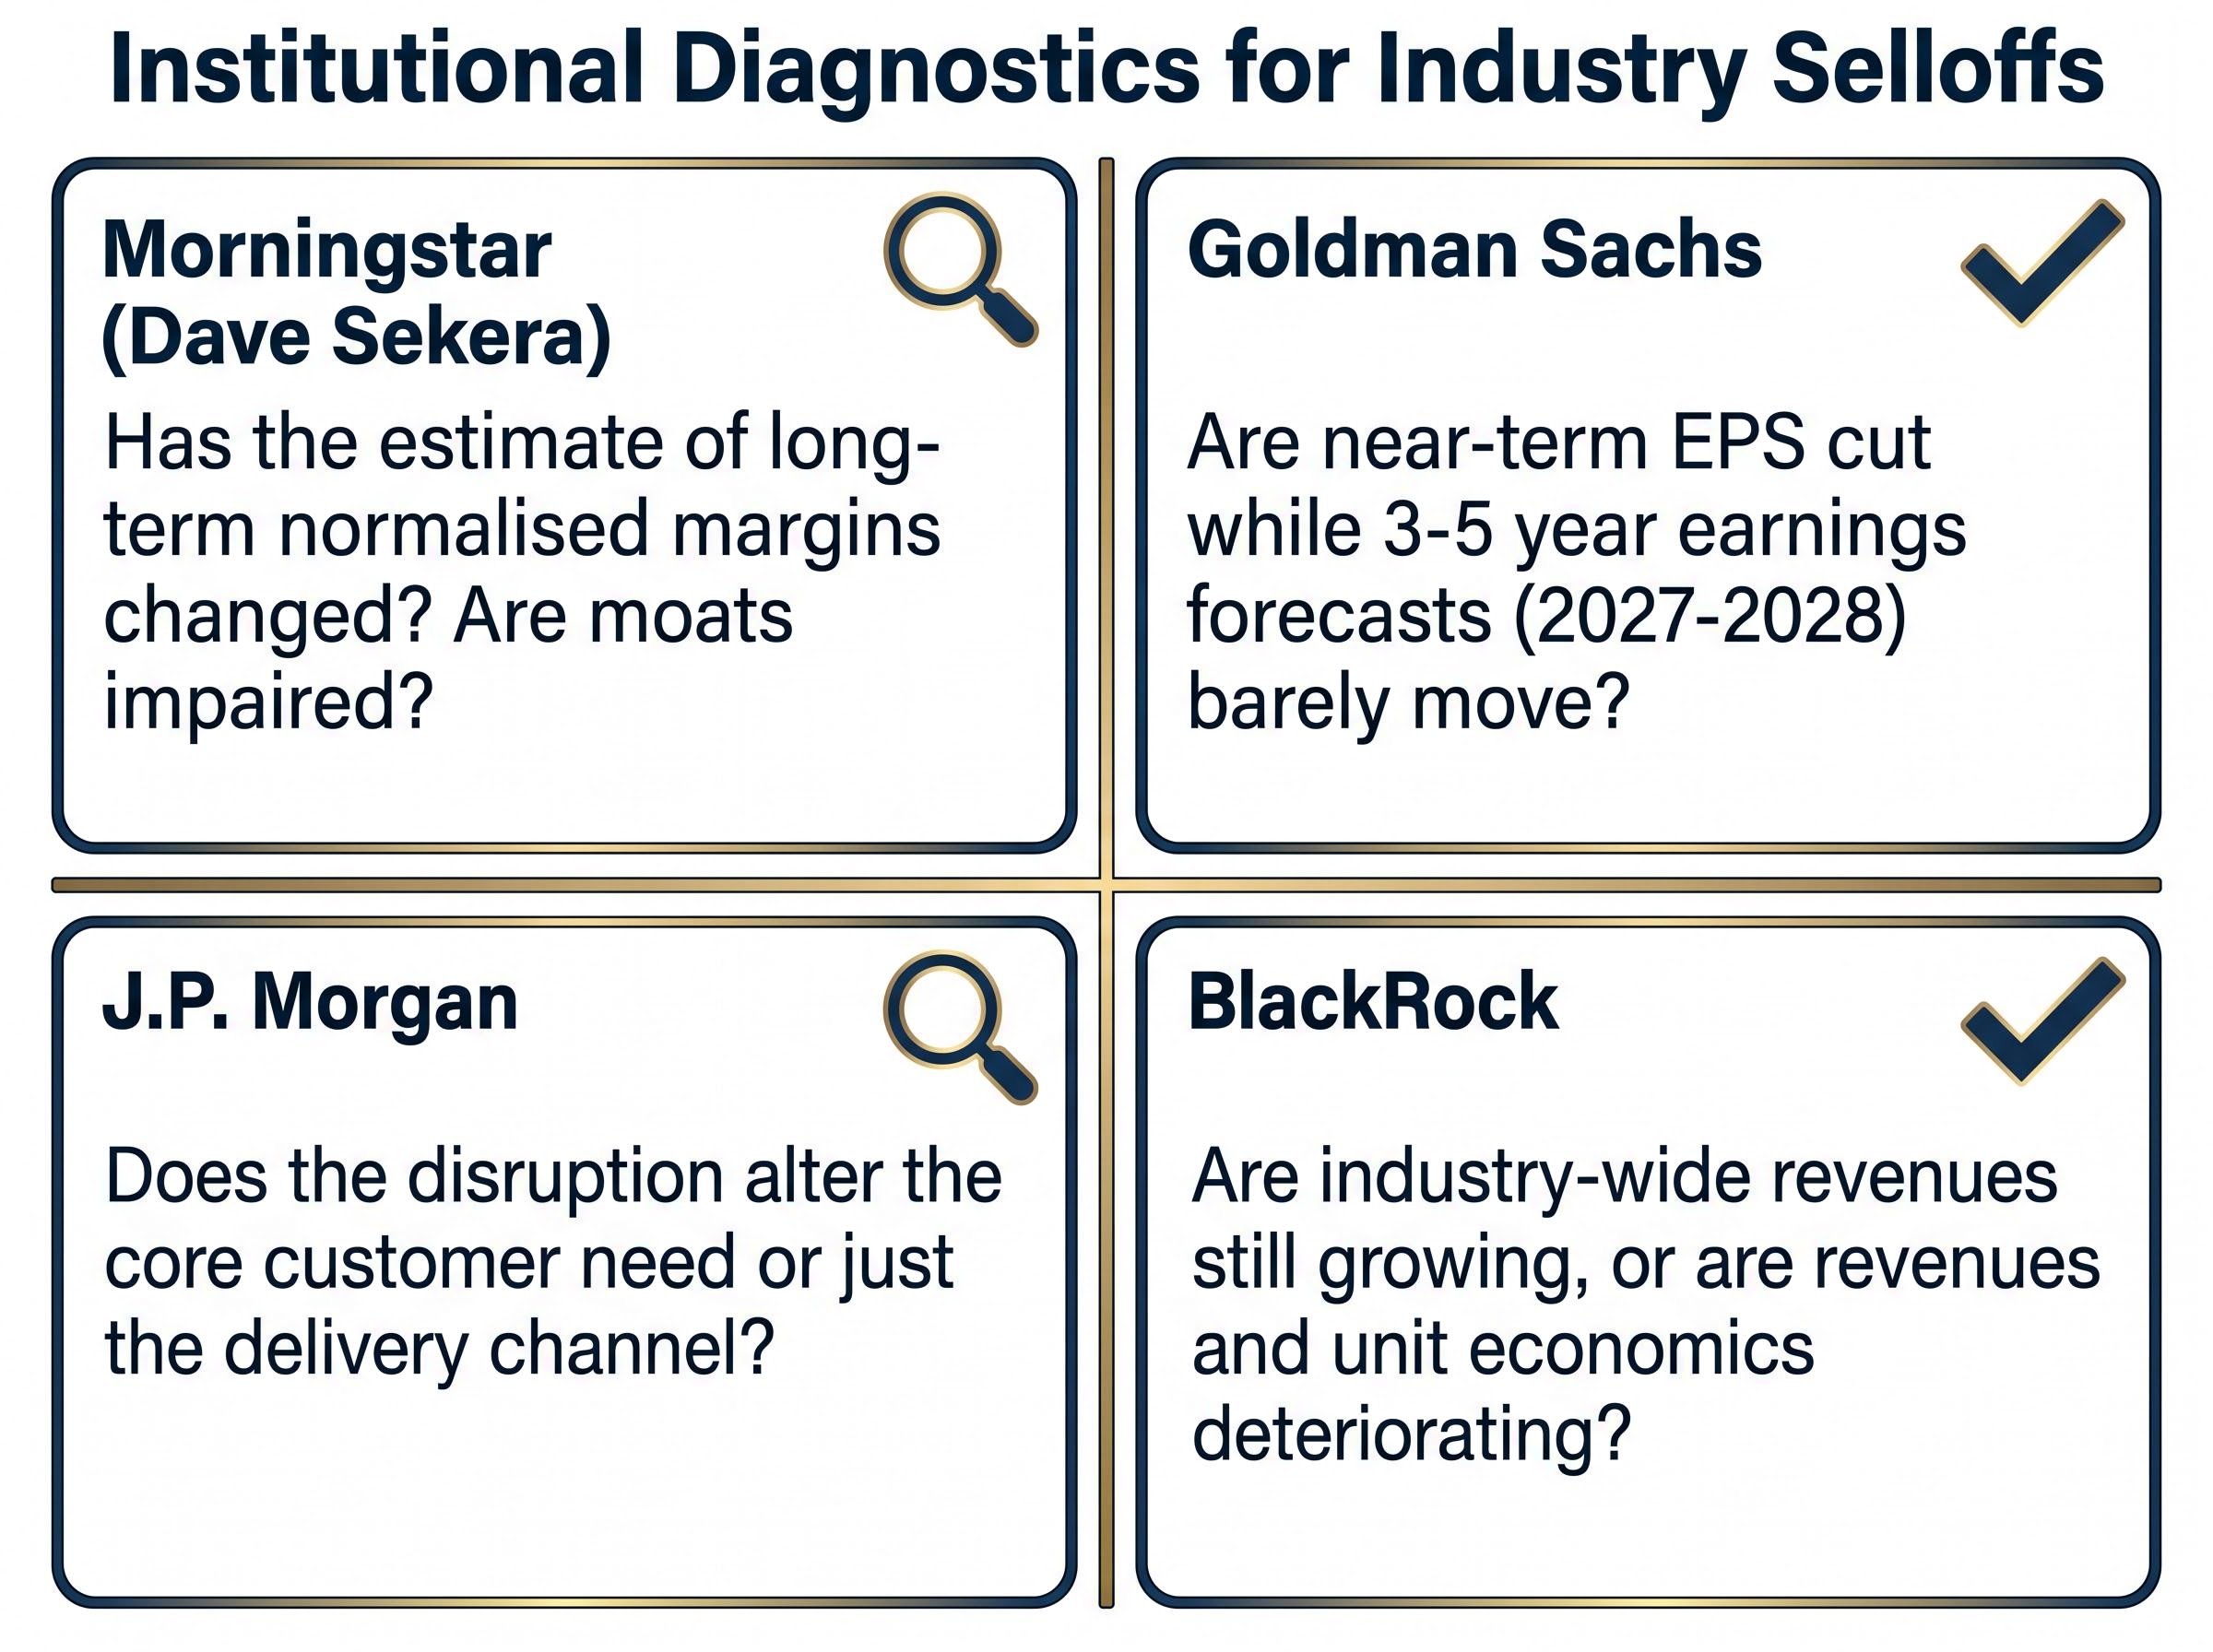
Morningstar’s Two-Question Diagnostic: Has the estimate of long-term normalised margins actually changed? Are moats (switching costs, network effects) impaired, or is the selloff sentiment-driven? According to Morningstar’s Dave Sekera, if the answer to both is no, the selloff is more likely an overreaction than a structural repricing.
Irrational overreactions represent the highest-conviction buying windows because the business thesis is unchanged while the price has moved sharply. Netflix’s recovery from near $19 to well above $100 illustrates the magnitude available when narrative fear is successfully distinguished from fundamental damage.
Structural disruption is not a bad quarter. It is a permanent reduction in an industry’s profit pool: fewer customers, lower willingness to pay, or a technology that eliminates the core need the industry served. The distinction matters because structurally disrupted industries can look statistically cheap for years while the business underneath continues to erode.
The signals, however, are observable well before the outcome becomes obvious. Institutional research converges on a consistent set of diagnostic markers, each visible in public filings and sell-side coverage.
| Signal | Where to find it | What it looks like | Why it matters |
|---|---|---|---|
| ROIC trend | Annual reports, sell-side models | Multi-year decline in incremental return on invested capital versus historical norms | Signals the industry is generating less value per dollar reinvested, a hallmark of structural erosion (Morgan Stanley) |
| Revenue pool trajectory | Industry-level revenue data, company filings | Total industry revenues and unit economics deteriorating, not just margins compressing | Separates structural decline (shrinking demand) from temporary margin pressure (BlackRock) |
| Pricing power | Earnings calls, pricing indices | Persistent inability to raise prices or defend margins against new entrants | Loss of pricing power over multiple years indicates the competitive structure has permanently shifted (Morgan Stanley) |
| Management posture | Earnings calls, investor presentations | Management focused on cost-cutting and efficiency rather than growth reinvention | McKinsey identifies this as one of three common value trap traits; defensive cost management suggests leadership sees no path to restoring growth |
| Moat erosion | Customer churn data, R&D productivity, competitive analysis | Shrinking R&D productivity, worsening customer churn, multi-year decline in competitive advantage | When the mechanisms that protected margins (switching costs, network effects, scale) degrade over years, recovery becomes structurally unlikely (WSJ, CFA Institute) |
Kodak is the anchoring example. Digital photography did not just change the delivery channel; it eliminated the core customer need for film processing entirely. That distinction, drawn from J.P. Morgan’s first diagnostic question, was visible years before the stock reached zero. Revenues were not compressing temporarily. The entire profit pool was disappearing as consumers stopped buying film. Management responded with cost-cutting rather than reinvention. Each of the five signals in the table above was present and observable in public data.
BlackRock’s definitional distinction: Structural disruption equals a declining industry profit pool, where revenues and unit economics deteriorate. A temporary setback equals earnings compression during an investment phase or cyclical downturn, where industry-wide revenues are still growing while only margins compress.
Investors who recognise structural disruption early avoid the value trap that destroys capital over years or decades. The indicators listed here are observable in public filings and sell-side research, making this a practical screening tool rather than a theoretical exercise.
The diagnostic signals described above, ROIC trends, revenue pool trajectory, earnings-per-share revisions, and return on equity, are the same fundamental analysis metrics that underpin any credible equity screening process, and investors who can read them fluently gain a significant edge when narrative fear is driving prices rather than actual business deterioration.
Morningstar’s equity research methodology anchors moat assessment in whether a company earns returns on invested capital above its cost of capital across a full business cycle, a standard that makes the ROIC trend table above a practical screening tool rather than a theoretical one.
Most scary-looking selloffs are not structural. They are temporary setbacks: genuine near-term damage that leaves the underlying competitive moat intact, with the expectation that the business recovers and weaker rivals exit. The diagnostic criteria here are distinct from both the overreaction category (where nothing is actually damaged) and the structural category (where everything is).
Institutional research points to several indicators that help identify temporary setbacks in real time:
Goldman Sachs’ EPS framework: Monitor revisions to 3-5 year earnings forecasts, not just next-quarter estimates. If 2027-2028 EPS estimates barely move while near-term EPS is cut, the event is more likely cyclical repricing than structural damage.
Texas Roadhouse illustrates the framework in action. When the stock fell from approximately $65 to roughly $35 during the 2020 pandemic selloff, the fear was real: restaurants were closed by government mandate, revenues dropped to near zero overnight, and the entire casual dining industry appeared at risk.
The diagnostic indicators, however, pointed clearly to temporary setback rather than structural collapse. The core customer need, dining out for an affordable, high-quality experience, was unchanged. The moat, built on value positioning, a loyal customer base, and strong unit economics, was intact. The damage was entirely delivery-channel related: government-mandated closures, not a permanent shift in consumer behaviour.
The recovery confirmed the diagnosis. Full-year 2024 results showed revenues and earnings well above pre-COVID levels, with positive comparable-store sales growth and continued unit expansion. The stock recovered from approximately $35 to above $200. That trajectory, from temporary damage to full recovery and beyond, is available to investors who correctly classify the selloff before acting on it.
Frameworks are only useful if they translate into a repeatable process. The three-category diagnostic works as a sequential decision tree, where each step must be completed before moving to the next.
The classification step must come first because every subsequent decision depends on it. Position sizing, time horizon, and risk tolerance all change depending on whether the selloff is an overreaction, a temporary setback, or structural disruption.
One advantage individual investors hold over institutions: long-term retail investors can hold through temporary setbacks and irrational overreactions without the quarterly performance pressure that forces institutional hands. As Warren Buffett has emphasised, evaluating businesses over decades rather than years and ignoring most market rotations driven by narrative shifts is a structural edge available to patient capital.
The structural edge available to retail investors, the ability to hold through temporary setbacks without institutional performance pressure, only materialises in practice when long-term investing is treated as a deliberate strategy rather than a passive default, with position sizing, holding horizon, and tax efficiency planned in advance rather than decided under stress.
| Category | Core definition | Key diagnostic signals | Historical example | Suggested investor response |
|---|---|---|---|---|
| Irrational overreaction | Sector reprices on narrative fear while fundamentals remain intact | Revenues and retention stable; intrinsic value estimates unchanged; moats unimpaired | Netflix (2022): stock fell over 70%, recovered past $120 as streaming fears proved overdone | Highest-conviction buying window; size position according to confidence in moat durability |
| Temporary setback | Genuine near-term damage with underlying moat intact | 3-5 year EPS estimates stable; core customer need unchanged; margins compress but revenues grow | Texas Roadhouse (2020): fell to ~$35, recovered above $200 as dining demand returned | Accumulate on weakness with a multi-year holding horizon; monitor moat indicators quarterly |
| Structural disruption | Permanent reduction in industry profit pool | Multi-year ROIC decline; revenue pool shrinking; pricing power lost; management cutting costs rather than reinventing | Kodak (1990s-2000s): digital photography eliminated core customer need for film processing | Avoid or exit; apparent cheapness on near-term earnings is a value trap |
The quality of an investment outcome during a sector selloff depends almost entirely on the quality of the diagnostic question asked first. “Is this cheap?” follows from “what kind of selloff is this?”, not the other way around.
Kodak was cheap on near-term earnings for years; the industry was dying. Texas Roadhouse looked terrifying in March 2020; the moat was intact and the damage was temporary. Netflix appeared structurally broken in 2022; the narrative never matched the financials. The same framework separates all three outcomes, across different industries and different decades.
Classification is never certain in real time. No diagnostic process eliminates uncertainty. The framework’s value lies in raising the quality of the analysis and the deliberateness of the decision, not in guaranteeing outcomes.
Any sector currently facing a disruptive technology narrative, whether AI, electrification, or automation, will generate all three types of selloff simultaneously within the same industry. That makes the three-category diagnostic more valuable as disruption accelerates, not less. The next time a sector makes headlines for the wrong reasons, keep a written version of the three-category checklist close at hand. The first question it asks may be the most important investment decision of the cycle.
AI disruption in software markets is generating all three selloff categories simultaneously within the same sector: legacy per-user licensing models facing genuine structural erosion as enterprise value migrates to consumption-based AI infrastructure, while vertically embedded platforms with proprietary data and switching-cost lock-in are more plausibly in the temporary setback or overreaction categories despite falling alongside structurally impaired peers.
This article is for informational purposes only and should not be considered financial advice. Investors should conduct their own research and consult with financial professionals before making investment decisions. Past performance does not guarantee future results. Financial projections are subject to market conditions and various risk factors.
A stock market selloff strategy is a structured approach to evaluating sector-wide price declines before investing, helping investors distinguish between temporary panic, recoverable damage, and permanent business deterioration. Without a clear strategy, investors risk buying into value traps or selling quality businesses at the worst possible time.
Key indicators of a temporary setback include stable 3-5 year EPS estimates, an unchanged core customer need, and growing industry revenues despite margin compression, while structural disruption shows multi-year ROIC decline, a shrinking total revenue pool, and persistent loss of pricing power. Checking public filings and sell-side research for these signals before investing can help separate recoverable situations from permanent capital destruction.
Investors should ask whether the disruption alters the core customer need or only the delivery channel, whether the new competing technology is economically superior or just hyped, and whether incumbents are credibly investing in the new technology. These three questions, drawn from J.P. Morgan's framework, help classify any selloff into one of three categories: irrational overreaction, temporary setback, or structural disruption.
Industry-wide selloffs cause indiscriminate repricing where strong and weak companies fall together, creating a gap between price and intrinsic value that can be the widest of any market event. However, that gap only represents an opportunity if the underlying business survives the disruption, which is why classification must come before valuation.
Netflix fell from around $66 to approximately $19 (split-adjusted) as streaming competition fears peaked, yet revenues kept growing and the core moat of recommendation algorithms, global content scale, and user switching costs remained intact. The stock recovered well past $120 by Q1 2025, illustrating that when narrative fear outpaces actual fundamental damage, the resulting price decline can become a high-conviction buying window for patient investors.