
How to Read a Small-Cap Order Book Using a Live ASX Example
2 hrs ago

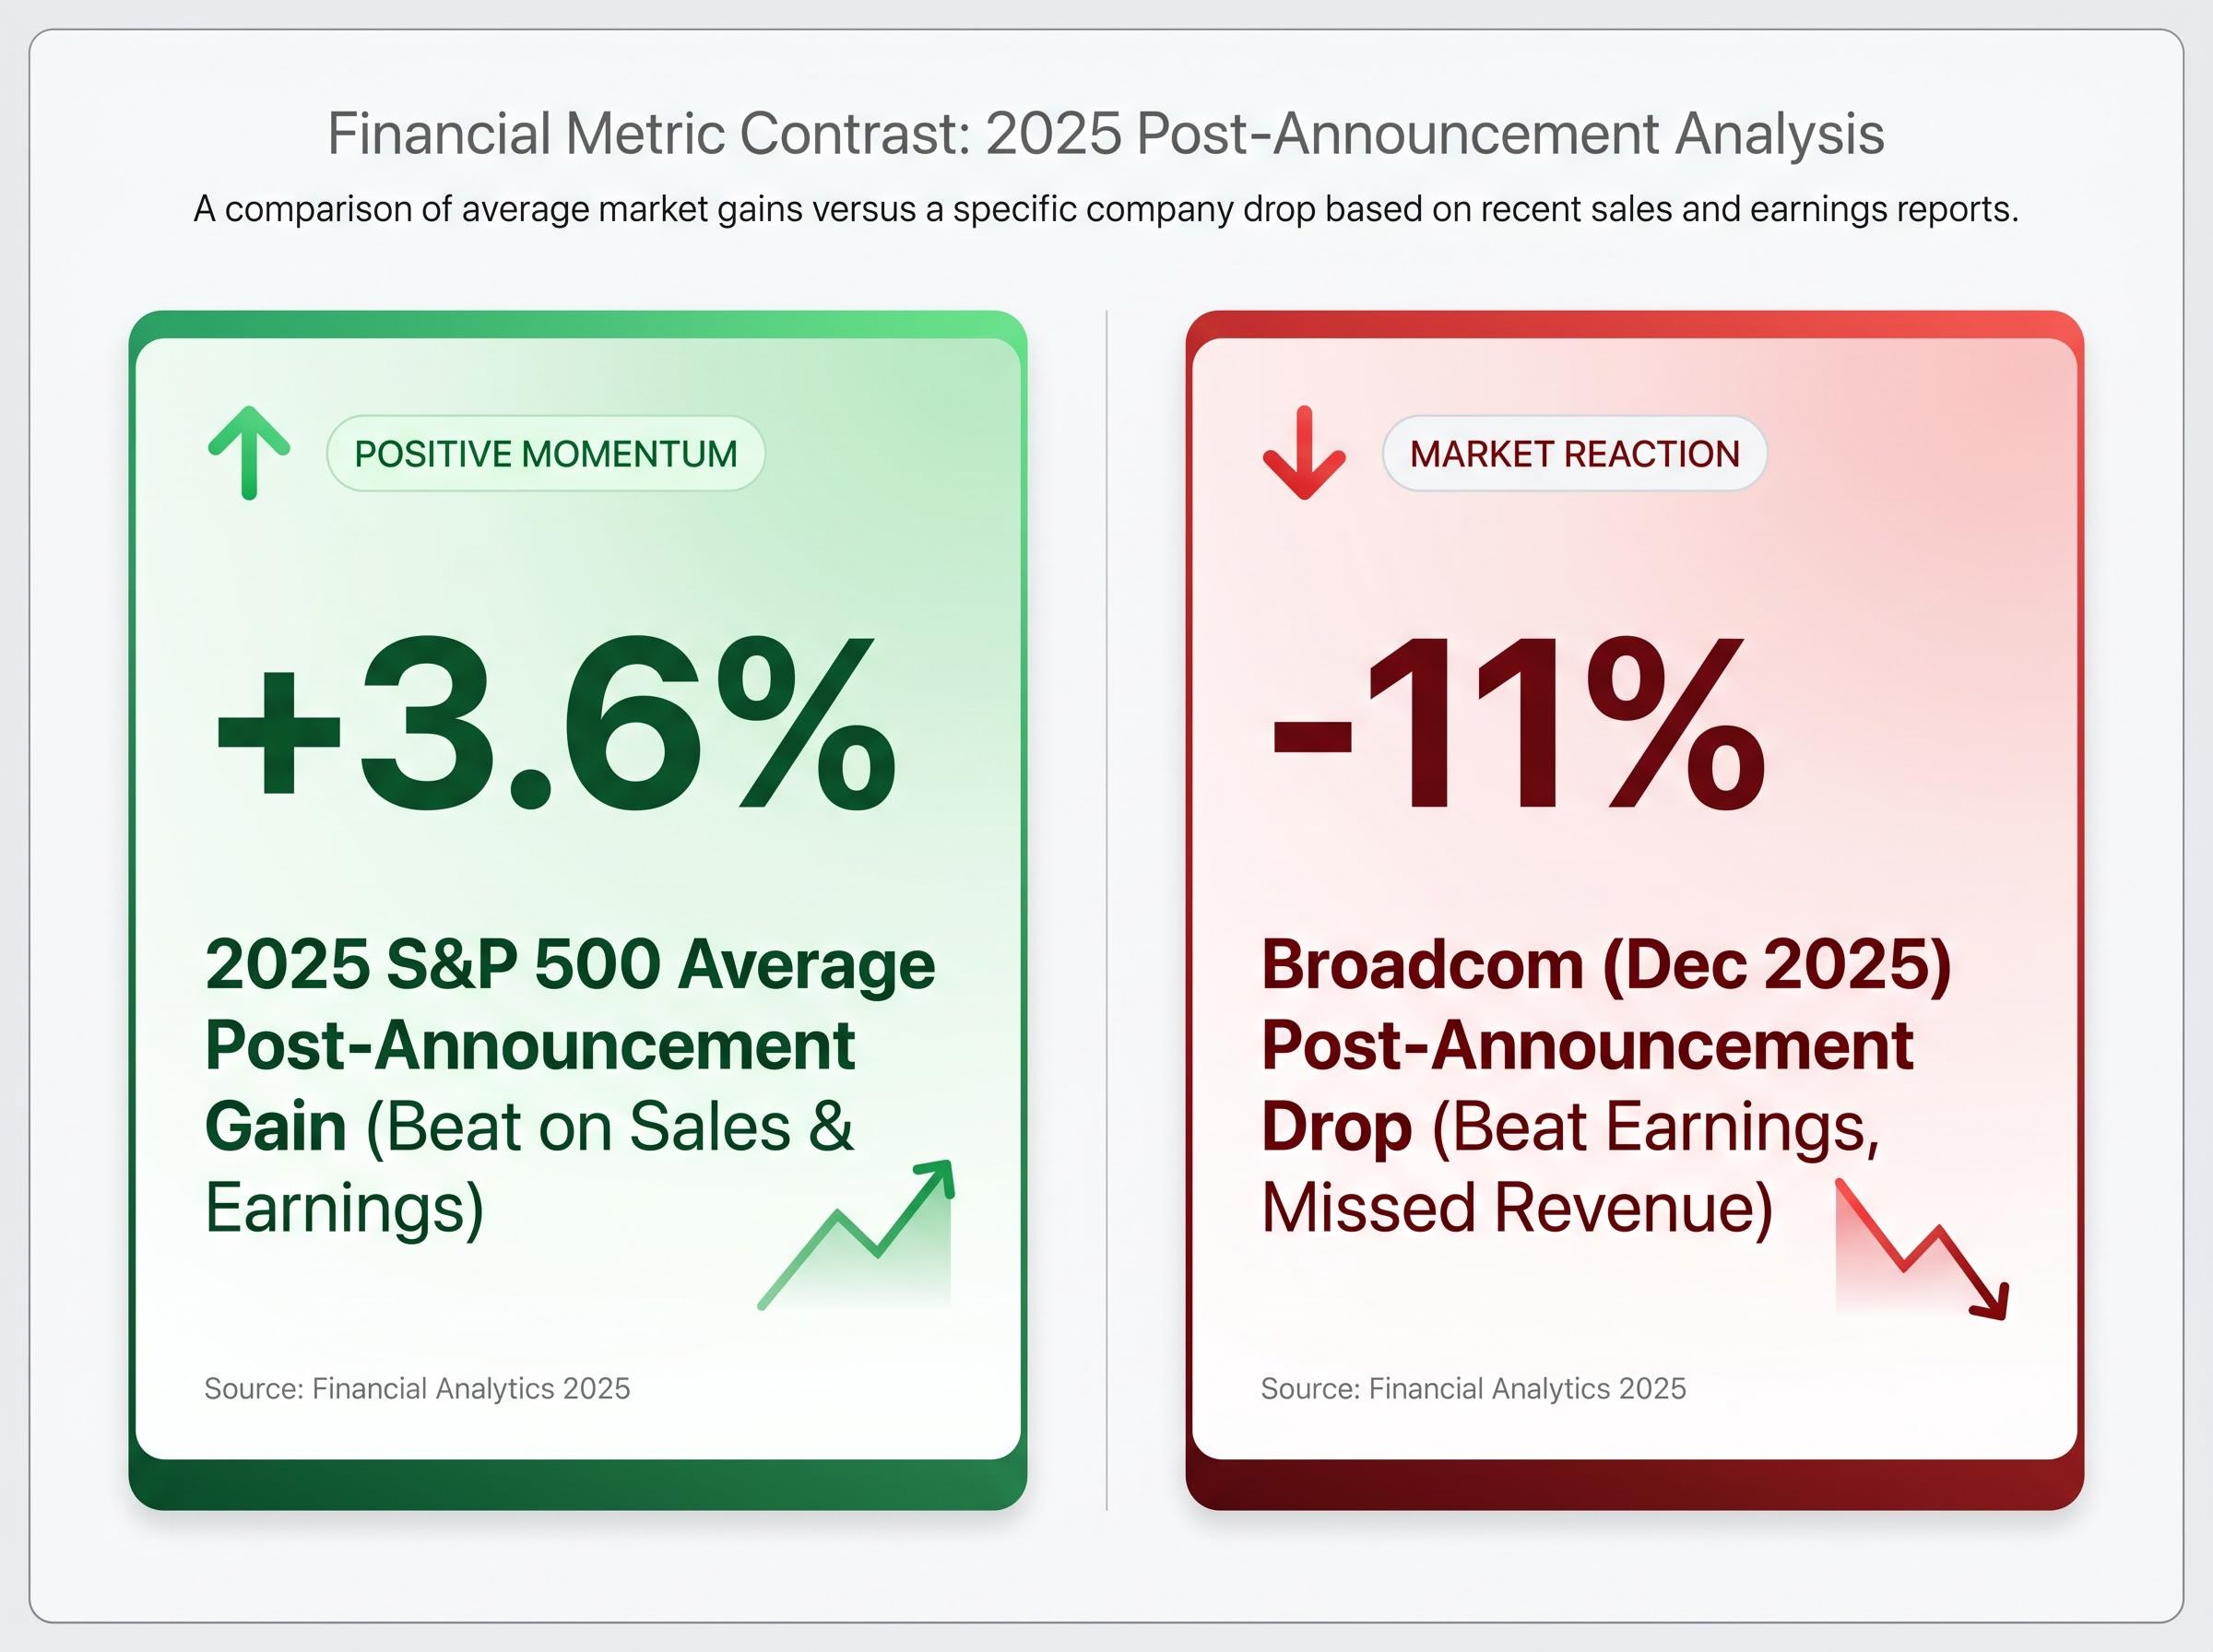
In 2025, S&P 500 companies that beat both sales and earnings expectations saw an average stock price gain of 3.6% post-announcement. That same season, Broadcom beat earnings expectations and its stock dropped 11% the next day. The difference was not the headline number; it was what sat underneath it.
Earnings season arrives four times a year and generates intense market noise. Most retail investors are trained to read the headline: did the company beat or miss? That framing is too blunt to be useful. The same quarterly result can represent a durable business compounding in strength or a management team using financial levers to manufacture a number that satisfies consensus. Knowing which one is which remains one of the most practically valuable skills in fundamental investing.
This guide provides a repeatable, step-by-step framework for evaluating whether an earnings beat reflects genuine business momentum or temporary factors that will not persist. Readers will leave with a set of specific checks to run on any earnings report, from revenue quality and margin trends to GAAP/non-GAAP divergence and forward guidance signals.
The headline earnings per share (EPS) beat is a starting point for analysis, not a conclusion. Two companies can both beat consensus by $0.05 and arrive there through entirely different paths: one by selling more product at higher margins, the other by cutting headcount and deferring investment. The source of the earnings improvement, not the size of it, is the variable that separates durable strength from a single-quarter mirage.
The expectations gap, the distance between what the market had already priced in and what the company actually reported, is why Q1 2026 produced an 84% beat rate alongside frequent post-earnings stock declines; a beat relative to consensus is only half the equation when consensus itself had already been reset higher by prior guidance.
Broadcom, December 2025: Beat on earnings, missed on revenue, stock fell approximately 11%. Management flagged lower-margin AI processors squeezing overall margins. The headline beat masked a deteriorating revenue picture and a margin trajectory moving in the wrong direction.
Revenue-led growth, where the top line expands and costs grow at a slower rate, is the clearest signal that a business is generating real operating leverage. Cost-reduction-driven profitability can look identical on the EPS line, but it tells a fundamentally different story. A company trimming its way to a beat has a ceiling: costs can only be cut so far before the business itself begins to erode.
The 3.6% average post-announcement gain for companies beating on both sales and earnings in 2025 frames the implied cost of a bottom-line-only beat. When revenue does not participate, the market often sees through the headline number within hours.
Most investors skip to net income or EPS. The income statement, read from top to bottom, tells a richer story when followed as a diagnostic sequence. Each line item narrows the lens.
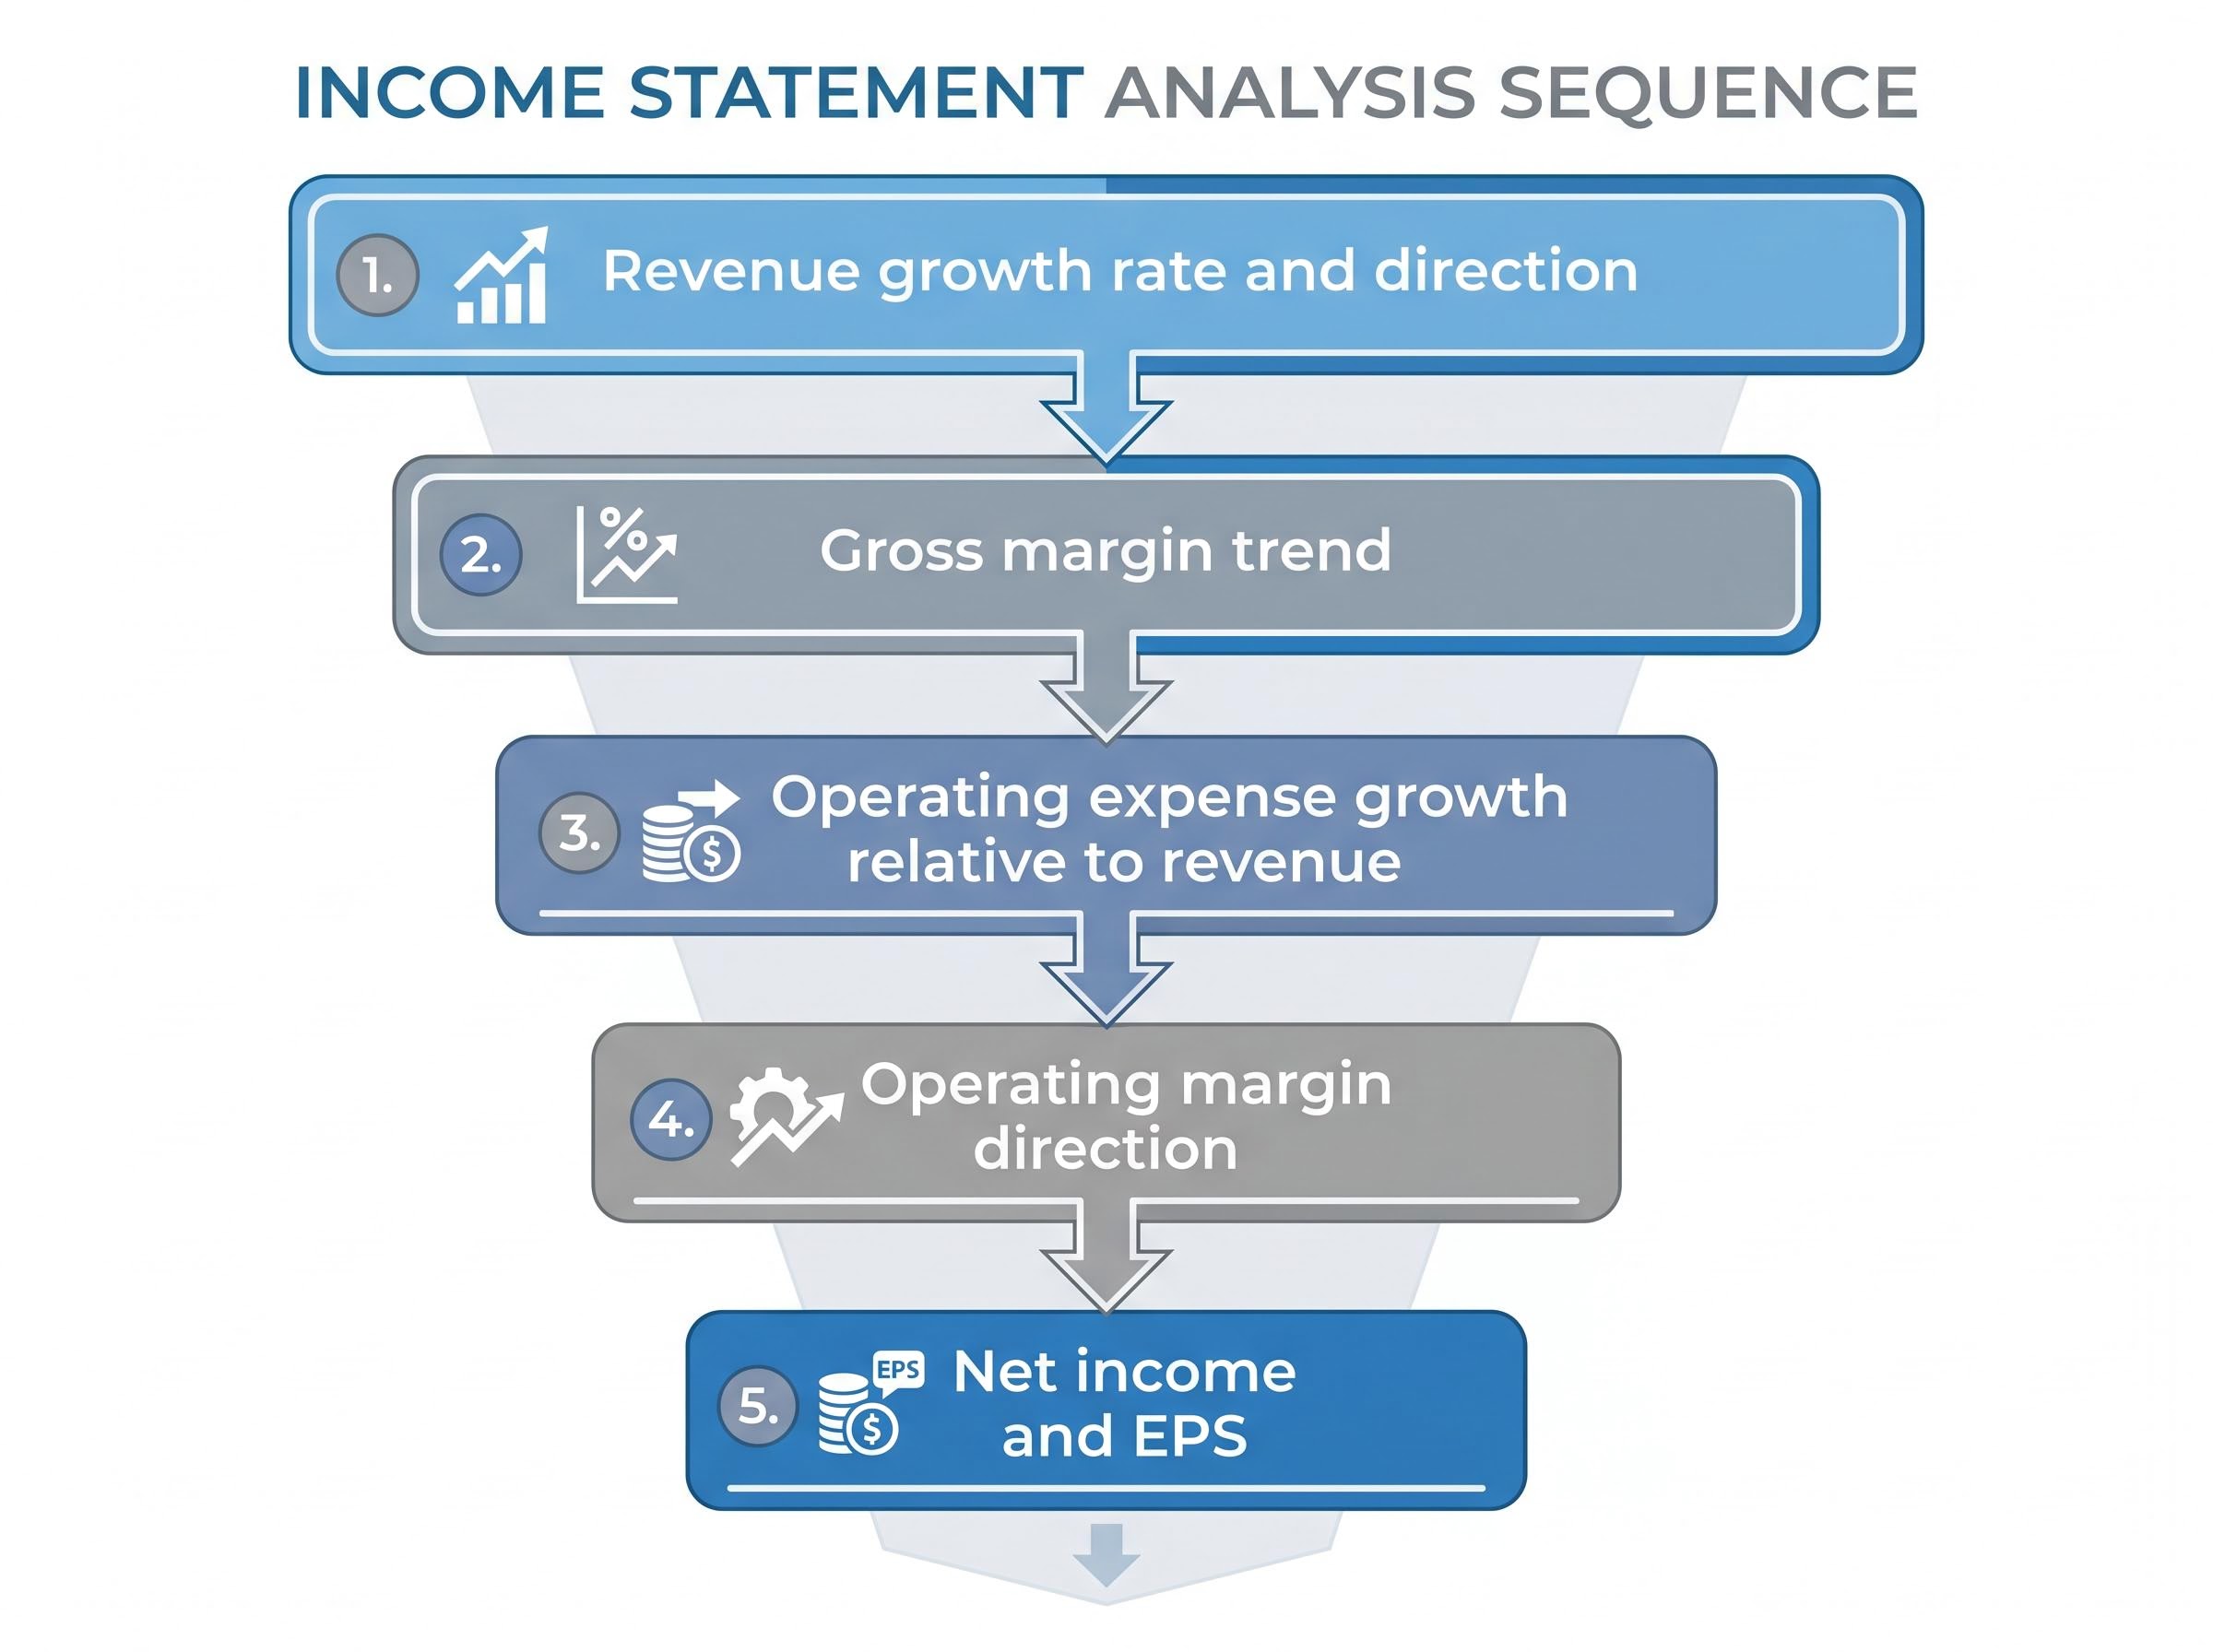
Revenue growth not accompanied by proportional cost increases is the clearest signal of operating leverage and genuine earnings quality. When operating expenses grow faster than revenue, margin compression follows regardless of what the headline beat says.
A company with flat or declining revenue can still beat EPS expectations through aggressive cost reduction. Workforce cuts, deferred R&D spending, and pulled-back marketing budgets all flow directly to the bottom line. In the quarter they occur, they look like discipline. Over multiple quarters, they look like retreat.
Investors checking for this pattern should note whether headcount, R&D expense, and sales and marketing spend are declining. The question is whether those declines reflect intentional efficiency improvements or a business that is pulling back from growth investment. Amazon and Uber offer the inverse case: both companies deliberately compressed near-term margins to invest in market share expansion, requiring investors to apply a different interpretive lens where low profitability signalled strategic ambition rather than weakness.
Earnings quality is not a single number. The CFA Institute’s 2025 guidance on quality of earnings frames it through three distinct dimensions, each measuring a different facet of whether reported results will persist.
The CFA Institute quality of earnings framework identifies earnings persistence, accrual quality, and cash flow alignment as the three core dimensions analysts use to determine whether a reported result reflects genuine economic activity or accounting flexibility being pushed to its limits.
| Dimension | What it measures | What good looks like | Red flag signal |
|---|---|---|---|
| Earnings persistence | Whether earnings are sustainable across periods or driven by non-recurring items | Consistent earnings growth over 3-4 consecutive quarters | Large one-time gains or reversals inflating a single quarter |
| Accrual quality | Whether accruals reflect genuine economic activity or aggressive accounting | Accruals that convert to cash within normal business cycles | Rising accruals with no corresponding cash flow improvement |
| Cash flow alignment | Whether reported earnings translate into free cash flow | Free cash flow tracking closely with net income over time | A growing gap between net income and free cash flow |
Free cash flow tracking closely with net income is one of the most reliable indicators of high-quality earnings. When the two diverge, with net income growing but free cash flow stagnating or declining, it often signals aggressive revenue recognition, rising accruals, or capital expenditures that reported earnings are not fully reflecting.
Operating cash flow divergence from net income, when cash lags reported earnings across several consecutive quarters rather than just one, is among the most reliable early signals of accrual manipulation or aggressive revenue recognition before the income statement visibly reflects the problem.
The Sustainable Growth Rate (SGR) adds a quantitative cross-check to this framework. SGR measures how fast a company can grow using only its internally generated resources, without issuing new debt or equity. It functions as a ceiling: growth that stays at or below SGR is self-funded. Growth that consistently exceeds it requires external financing or one-time items to sustain.
The SGR diagnostic: High reported EPS growth combined with stagnant or declining SGR is a red flag. It suggests the earnings growth narrative may be relying on financial engineering rather than organic business strength. The divergence between actual growth rate and SGR is one of the clearest quantitative signals available.
According to a Calcbench study from June 2025, 71% of S&P 500 companies report both GAAP and non-GAAP earnings figures. The practice is so widespread that retail investors encounter non-GAAP numbers first in nearly every earnings press release. The question is not whether to read them, but how critically.
SEC Regulation G requires companies to reconcile non-GAAP figures to the nearest comparable GAAP measure. That reconciliation table, usually buried several pages into the earnings release, shows exactly what has been stripped out. Investors who read it gain a clear view of whether the adjustments are reasonable or whether they are systematically inflating the headline number.
The non-GAAP reconciliation table is the section of an earnings release that most retail investors skip and management teams bury deepest; reading it first, before engaging with the headline EPS figure, is the single habit that separates disciplined analysis from headline-driven reaction.
The most common non-GAAP exclusions fall into two categories:
The distinction matters. When a company excludes a cost every quarter and calls it non-recurring every time, the non-GAAP figure becomes progressively less representative of actual economic performance. AlphaStreet’s 2025 analysis found the average GAAP/non-GAAP EPS gap in technology firms sits at 25-30%. When that gap widens year over year without clear explanation, or when GAAP results miss while non-GAAP beats, the earnings beat may be substantially less meaningful than it appears.
Stock-based compensation (SBC) is the most consequential and most routinely excluded item in technology sector earnings. SBC is a real, recurring cost to shareholders: it dilutes existing ownership and represents genuine compensation expense. Yet it is stripped out of non-GAAP earnings by nearly every major technology company.
When SBC as a percentage of revenue grows over time, it signals that the non-GAAP earnings presentation is becoming progressively less representative of true economic performance. A company reporting strong non-GAAP earnings growth while SBC climbs from 10% of revenue to 15% is not generating the profitability its headline number suggests.
Profit margin trends reveal whether a company is converting revenue growth into proportionally more earnings, less, or the same. A single quarter’s margin level is a snapshot. The direction of the trend across multiple quarters is the signal.
| Margin type | What it measures | Healthy trend signal | Warning signal |
|---|---|---|---|
| Gross margin | Revenue retained after direct production costs | Stable or expanding, indicating pricing power | Compression, suggesting rising input costs or discounting |
| Operating margin | Revenue retained after all operating expenses | Expanding as revenue scales faster than costs | Declining despite revenue growth, suggesting cost discipline issues |
| Net margin | Revenue retained after all costs, taxes, and interest | Tracking operating margin direction closely | Diverging from operating margin due to rising debt costs or tax changes |
Margin expansion driven by pricing power, where a company can charge more without losing customers, tends to be durable. Margin expansion driven by volume growth via discounting is fragile; it works until a competitor matches the price. Investors can often distinguish the two by checking whether revenue per unit is rising or falling alongside total revenue growth.
Forward guidance is frequently the single most important driver of post-earnings stock movement. Revenue outlook, EPS projections, and free cash flow targets tell the market where management believes the business is headed. Management commentary on earnings calls often carries as much weight as the numerical guidance itself.
Stocks react to where earnings are going, not where they have been. It is not uncommon for share prices to decline even when a company posts strong quarterly numbers, because investor focus is on forward expectations. Broadcom’s December 2025 case reinforced this: margin compression warnings in forward guidance offset the nominal earnings beat.
Earlier-stage companies may deliberately compress near-term margins to invest in market share. Amazon and Uber both followed this playbook for years. In those cases, forward guidance about customer acquisition rates and addressable market expansion mattered more than current-quarter profitability. Recognising when this framework applies prevents misclassifying intentional investment as weakness.
The analytical dimensions covered in this guide compress into a single sequential checklist. Running through these seven steps for any earnings report on a watchlist should take less than 30 minutes and produce a clear reading of whether a beat is genuine or manufactured.
One quarter proves nothing; four quarters prove a pattern. Revenue and earnings growth holding up across several consecutive quarters is a stronger indicator than any single period’s result. The most reliable investment cases are built on multi-quarter consistency, not isolated beats.
Comparing results against sector peers adds a final layer. When every company in a sector reports strong numbers, the tailwind is likely macro rather than company-specific. Genuine competitive advantage shows up as outperformance relative to the sector, not just outperformance relative to consensus.
Companies that pass the dual-beat test, exceeding both sales and earnings expectations, averaged 3.6% post-announcement gains in 2025. That dual beat remains the gold standard: it confirms that the bottom-line result is supported by real top-line momentum.
The Q1 2026 earnings season, which produced a blended S&P 500 growth rate of 27.1% against an initial consensus forecast of 13.1%, offers a live stress test of this framework: with 84% of companies beating EPS estimates, the analytical challenge shifted from identifying beats to determining which beats reflected genuine acceleration versus analyst estimates that had been set unusually low entering the season.
The headline earnings beat is where analysis begins, not where it ends. Investors who understand this carry a structural advantage over those who stop at the beat/miss binary and make decisions based on a single number stripped of context.
The framework above is not designed for a single use. Applying the seven-step checklist consistently across multiple quarters and multiple companies builds pattern recognition over time. The first earnings report analysed this way will feel slow. By the fifth, the checks become instinctive.
The concrete next step: pull up the next earnings report on the watchlist, run through the seven checks, and identify which category of beat is on the table before making any investment decision. A revenue-led beat with expanding margins, strong free cash flow alignment, and confident forward guidance tells a different story than a cost-cut-driven beat with a widening GAAP/non-GAAP gap and cautious outlook.
The numbers are always available. The skill is knowing which ones to read, and in what order.
This article is for informational purposes only and should not be considered financial advice. Investors should conduct their own research and consult with financial professionals before making investment decisions.
Earnings quality refers to how reliably a company's reported profits reflect genuine economic activity rather than accounting adjustments. The CFA Institute identifies three core dimensions: earnings persistence, accrual quality, and cash flow alignment, each measuring whether a reported result is likely to repeat in future quarters.
Check whether revenue grew alongside earnings per share. If EPS rose while revenue was flat or declining, the beat was likely achieved through cost reductions, buybacks, or tax rate changes rather than genuine business expansion, a pattern that has a ceiling because costs can only be cut so far.
GAAP earnings follow standardised accounting rules, while non-GAAP earnings exclude certain costs that management deems non-recurring, such as stock-based compensation or restructuring charges. A 2025 Calcbench study found 71% of S&P 500 companies report both, and the average GAAP/non-GAAP gap in technology firms sits at 25-30%.
Stock prices react to where earnings are going, not just where they have been. If forward guidance is lowered, margins are compressing, or the beat was driven by cost cuts rather than revenue growth, the market often looks through the headline number, as Broadcom demonstrated in December 2025 when its stock fell approximately 11% despite beating EPS.
The Sustainable Growth Rate (SGR) measures how fast a company can grow using only internally generated resources without issuing new debt or equity. High reported EPS growth combined with stagnant or declining SGR is a red flag, suggesting the earnings growth narrative may rely on financial engineering rather than organic business strength.